Introduction
This is a report for the insert benchmark with 400M docs and 20 client(s). It is generated by scripts (bash, awk, sed) and Tufte might not be impressed. An overview of the insert benchmark is here and a short update is here. Below, by DBMS, I mean DBMS+version.config. An example is my8020.c10b40 where my means MySQL, 8020 is version 8.0.20 and c10b40 is the name for the configuration file.
This is a report for the insert benchmark with 400M docs and 20 client(s). It is generated by scripts (bash, awk, sed) and Tufte might not be impressed. An overview of the insert benchmark is here and a short update is here. Below, by DBMS, I mean DBMS+version.config. An example is my8020.c10b40 where my means MySQL, 8020 is version 8.0.20 and c10b40 is the name for the configuration file.The test server is c2-standard-60 from GCP with 30 cores, hyperthreads disabled, 240G RAM and 3T of NVMe (XFS with RAID0 over 8 devices). The benchmark was run with 20 clients and there were 1 or 2 connections per client (1 for queries, 1 for inserts). It uses 1 table. It loads 400M rows per table without secondary indexes, creates secondary indexes, loads another 400M rows per table then does 3 read+write tests for one hour each that do queries as fast as possible with 100, 500 and then 1000 writes/second/client concurrent with the queries. The database is cached by the storage engine and the only IO is for writes. Clients and the DBMS share one server. The per-database configs are in the per-database subdirectories here.
The tested DBMS are:
- my5651_rel.cy10a_gcp_c2s60 - MySQL 5.6.51, the cy10a_gcp_c2s60 config and the build used CMAKE_BUILD_TYPE=Release
- my5740_rel_lto.cy10a_gcp_c2s60 - MySQL 5.7.40, the cy10a_gcp_c2s60 config and the build used CMAKE_BUILD_TYPE=Release -flto
- my8022_rel_lto.cy10a_gcp_c2s60 - MySQL 8.0.22, the cy10a_gcp_c2s60 config and the build used CMAKE_BUILD_TYPE=Release -flto
- my8028_rel_lto.cy10a_gcp_c2s60 - MySQL 8.0.28, the cy10a_gcp_c2s60 config and the build used CMAKE_BUILD_TYPE=Release -flto
- my8031_rel_lto.cy10a_gcp_c2s60 - MySQL 8.0.31, the cy10a_gcp_c2s60 config and the build used CMAKE_BUILD_TYPE=Release -flto
- my8032_rel_lto.cy10a_gcp_c2s60 - MySQL 8.0.32, the cy10a_gcp_c2s60 config and the build used CMAKE_BUILD_TYPE=Release -flto
Contents
- Summary
- l.i0: load without secondary indexes
- l.x: create secondary indexes
- l.i1: continue load after secondary indexes created
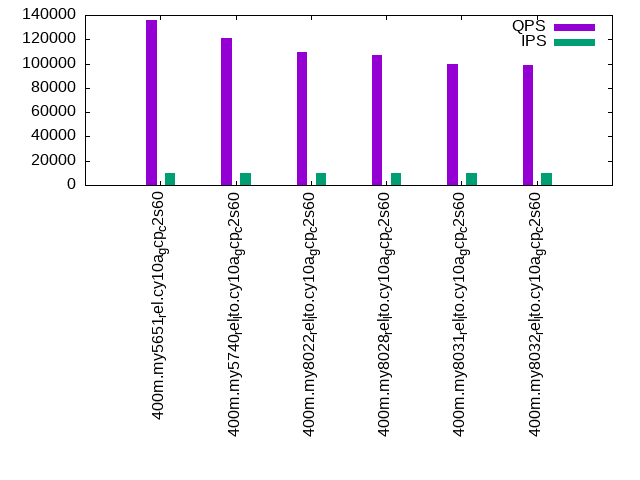
- q100.1: range queries with 100 insert/s per client
- q500.1: range queries with 500 insert/s per client
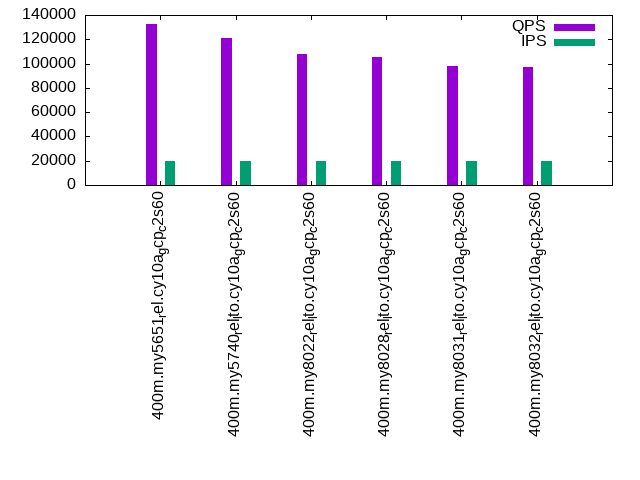
- q1000.1: range queries with 1000 insert/s per client
Summary
The numbers are inserts/s for l.i0 and l.i1, indexed docs (or rows) /s for l.x and queries/s for q*.2. The values are the average rate over the entire test for inserts (IPS) and queries (QPS). The range of values for IPS and QPS is split into 3 parts: bottom 25%, middle 50%, top 25%. Values in the bottom 25% have a red background, values in the top 25% have a green background and values in the middle have no color. A gray background is used for values that can be ignored because the DBMS did not sustain the target insert rate. Red backgrounds are not used when the minimum value is within 80% of the max value.
| dbms | l.i0 | l.x | l.i1 | q100.1 | q500.1 | q1000.1 |
|---|---|---|---|---|---|---|
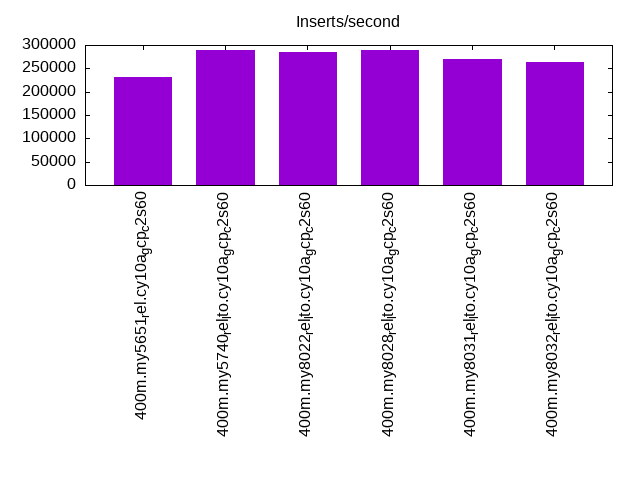
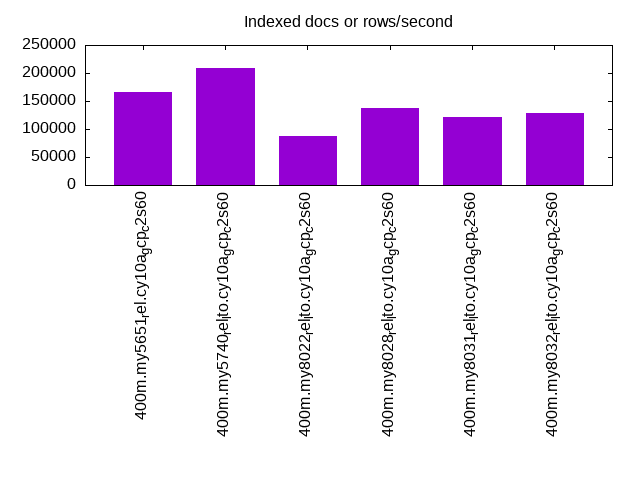
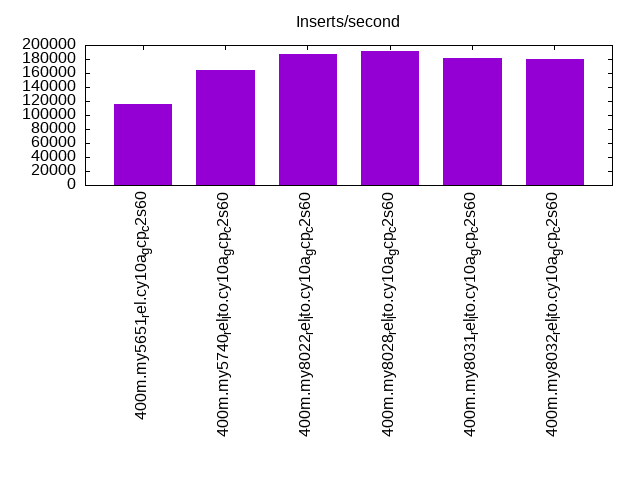
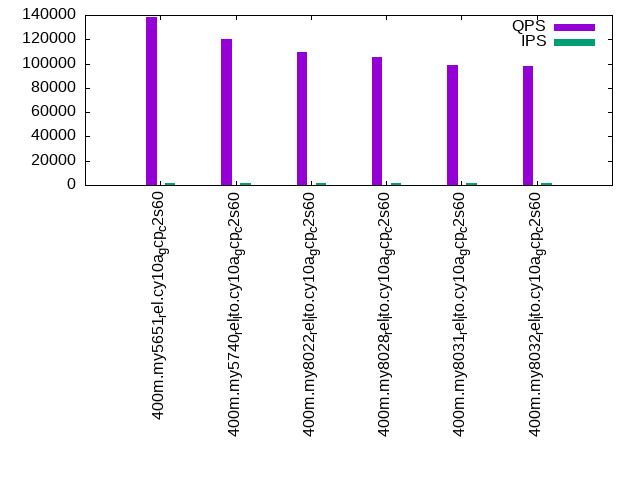
| 400m.my5651_rel.cy10a_gcp_c2s60 | 231080 | 166570 | 115976 | 138130 | 135939 | 132399 |
| 400m.my5740_rel_lto.cy10a_gcp_c2s60 | 289645 | 208168 | 163666 | 120564 | 120747 | 121097 |
| 400m.my8022_rel_lto.cy10a_gcp_c2s60 | 284698 | 87016 | 186567 | 109647 | 109452 | 108198 |
| 400m.my8028_rel_lto.cy10a_gcp_c2s60 | 289645 | 137966 | 191663 | 105801 | 107448 | 105541 |
| 400m.my8031_rel_lto.cy10a_gcp_c2s60 | 268998 | 122317 | 180914 | 99113 | 99607 | 97977 |
| 400m.my8032_rel_lto.cy10a_gcp_c2s60 | 264201 | 128650 | 179453 | 98197 | 98890 | 97010 |
This table has relative throughput, throughput for the DBMS relative to the DBMS in the first line, using the absolute throughput from the previous table.
| dbms | l.i0 | l.x | l.i1 | q100.1 | q500.1 | q1000.1 |
|---|---|---|---|---|---|---|
| 400m.my5651_rel.cy10a_gcp_c2s60 | 1.00 | 1.00 | 1.00 | 1.00 | 1.00 | 1.00 |
| 400m.my5740_rel_lto.cy10a_gcp_c2s60 | 1.25 | 1.25 | 1.41 | 0.87 | 0.89 | 0.91 |
| 400m.my8022_rel_lto.cy10a_gcp_c2s60 | 1.23 | 0.52 | 1.61 | 0.79 | 0.81 | 0.82 |
| 400m.my8028_rel_lto.cy10a_gcp_c2s60 | 1.25 | 0.83 | 1.65 | 0.77 | 0.79 | 0.80 |
| 400m.my8031_rel_lto.cy10a_gcp_c2s60 | 1.16 | 0.73 | 1.56 | 0.72 | 0.73 | 0.74 |
| 400m.my8032_rel_lto.cy10a_gcp_c2s60 | 1.14 | 0.77 | 1.55 | 0.71 | 0.73 | 0.73 |
This lists the average rate of inserts/s for the tests that do inserts concurrent with queries. For such tests the query rate is listed in the table above. The read+write tests are setup so that the insert rate should match the target rate every second. Cells that are not at least 95% of the target have a red background to indicate a failure to satisfy the target.
| dbms | q100.1 | q500.1 | q1000.1 |
|---|---|---|---|
| my5651_rel.cy10a_gcp_c2s60 | 1976 | 9885 | 19769 |
| my5740_rel_lto.cy10a_gcp_c2s60 | 1976 | 9885 | 19769 |
| my8022_rel_lto.cy10a_gcp_c2s60 | 1976 | 9885 | 19780 |
| my8028_rel_lto.cy10a_gcp_c2s60 | 1976 | 9890 | 19769 |
| my8031_rel_lto.cy10a_gcp_c2s60 | 1976 | 9885 | 19769 |
| my8032_rel_lto.cy10a_gcp_c2s60 | 1977 | 9885 | 19769 |
| target | 2000 | 10000 | 20000 |
l.i0
l.i0: load without secondary indexes. Graphs for performance per 1-second interval are here.
Average throughput:
Insert response time histogram: each cell has the percentage of responses that take <= the time in the header and max is the max response time in seconds. For the max column values in the top 25% of the range have a red background and in the bottom 25% of the range have a green background. The red background is not used when the min value is within 80% of the max value.
| dbms | 256us | 1ms | 4ms | 16ms | 64ms | 256ms | 1s | 4s | 16s | gt | max |
|---|---|---|---|---|---|---|---|---|---|---|---|
| my5651_rel.cy10a_gcp_c2s60 | 0.534 | 0.538 | 98.085 | 0.807 | 0.036 | 0.239 | |||||
| my5740_rel_lto.cy10a_gcp_c2s60 | 0.501 | 0.915 | 98.440 | 0.107 | 0.036 | 0.235 | |||||
| my8022_rel_lto.cy10a_gcp_c2s60 | 0.313 | 0.843 | 98.779 | 0.026 | 0.038 | 0.228 | |||||
| my8028_rel_lto.cy10a_gcp_c2s60 | 0.324 | 0.916 | 98.688 | 0.036 | 0.036 | nonzero | 0.270 | ||||
| my8031_rel_lto.cy10a_gcp_c2s60 | 0.294 | 0.655 | 98.972 | 0.043 | 0.037 | 0.253 | |||||
| my8032_rel_lto.cy10a_gcp_c2s60 | 0.290 | 0.559 | 99.070 | 0.044 | 0.037 | 0.235 |
Performance metrics for the DBMS listed above. Some are normalized by throughput, others are not. Legend for results is here.
ips	qps	rps	rmbps	wps	wmbps	rpq	rkbpq	wpi	wkbpi	csps	cpups	cspq	cpupq	dbgb1	dbgb2	rss	maxop	p50	p99	tag
231080	0	1645	6.4	265.6	76.0	0.007	0.028	0.001	0.337	215336	43.9	0.932	57	44.1	172.6	7.3	0.239	11691	9589	400m.my5651_rel.cy10a_gcp_c2s60
289645	0	0	0.0	382.5	94.9	0.000	0.000	0.001	0.335	224032	57.1	0.773	59	44.8	173.3	9.1	0.235	14684	11787	400m.my5740_rel_lto.cy10a_gcp_c2s60
284698	0	0	0.0	672.2	99.4	0.000	0.000	0.002	0.358	302314	57.7	1.062	61	44.7	173.3	9.2	0.228	14384	11886	400m.my8022_rel_lto.cy10a_gcp_c2s60
289645	0	0	0.0	646.1	91.2	0.000	0.000	0.002	0.322	282769	58.9	0.976	61	44.6	173.1	9.3	0.270	14684	11887	400m.my8028_rel_lto.cy10a_gcp_c2s60
268998	0	0	0.0	625.6	81.7	0.000	0.000	0.002	0.311	245872	59.4	0.914	66	44.5	173.1	9.3	0.253	13685	10992	400m.my8031_rel_lto.cy10a_gcp_c2s60
264201	0	0	0.0	614.4	65.4	0.000	0.000	0.002	0.254	248761	59.6	0.942	68	44.5	173.0	9.3	0.235	13385	10888	400m.my8032_rel_lto.cy10a_gcp_c2s60
l.x
l.x: create secondary indexes.
Average throughput:
Performance metrics for the DBMS listed above. Some are normalized by throughput, others are not. Legend for results is here.
ips	qps	rps	rmbps	wps	wmbps	rpq	rkbpq	wpi	wkbpi	csps	cpups	cspq	cpupq	dbgb1	dbgb2	rss	maxop	p50	p99	tag
166570	0	54	1.9	903.3	198.2	0.000	0.012	0.005	1.219	7303	3.2	0.044	6	71.9	200.4	7.3	0.005	NA	NA	400m.my5651_rel.cy10a_gcp_c2s60
208168	0	4	1.2	715.7	222.7	0.000	0.006	0.003	1.096	11372	3.5	0.055	5	77.3	205.8	9.2	0.004	NA	NA	400m.my5740_rel_lto.cy10a_gcp_c2s60
87016	0	0	0.0	1298.6	96.3	0.000	0.000	0.015	1.133	12722	3.0	0.146	10	77.1	205.7	9.3	0.007	NA	NA	400m.my8022_rel_lto.cy10a_gcp_c2s60
137966	0	692	47.4	3230.2	167.0	0.005	0.352	0.023	1.239	21608	10.7	0.157	23	77.0	205.6	9.3	0.005	NA	NA	400m.my8028_rel_lto.cy10a_gcp_c2s60
122317	0	613	42.1	2861.4	148.1	0.005	0.352	0.023	1.240	19572	10.8	0.160	26	76.9	205.5	9.3	0.005	NA	NA	400m.my8031_rel_lto.cy10a_gcp_c2s60
128650	0	645	44.4	3005.9	155.8	0.005	0.353	0.023	1.240	20556	10.5	0.160	24	76.9	205.4	9.3	0.006	NA	NA	400m.my8032_rel_lto.cy10a_gcp_c2s60
l.i1
l.i1: continue load after secondary indexes created. Graphs for performance per 1-second interval are here.
Average throughput:
Insert response time histogram: each cell has the percentage of responses that take <= the time in the header and max is the max response time in seconds. For the max column values in the top 25% of the range have a red background and in the bottom 25% of the range have a green background. The red background is not used when the min value is within 80% of the max value.
| dbms | 256us | 1ms | 4ms | 16ms | 64ms | 256ms | 1s | 4s | 16s | gt | max |
|---|---|---|---|---|---|---|---|---|---|---|---|
| my5651_rel.cy10a_gcp_c2s60 | 0.056 | 98.818 | 0.985 | 0.141 | nonzero | 0.773 | |||||
| my5740_rel_lto.cy10a_gcp_c2s60 | 0.119 | 99.431 | 0.306 | 0.143 | nonzero | 0.290 | |||||
| my8022_rel_lto.cy10a_gcp_c2s60 | 5.099 | 94.489 | 0.261 | 0.151 | nonzero | 0.312 | |||||
| my8028_rel_lto.cy10a_gcp_c2s60 | 6.500 | 93.124 | 0.241 | 0.135 | 0.250 | ||||||
| my8031_rel_lto.cy10a_gcp_c2s60 | 2.116 | 97.483 | 0.246 | 0.154 | nonzero | 0.283 | |||||
| my8032_rel_lto.cy10a_gcp_c2s60 | 1.652 | 97.945 | 0.246 | 0.157 | nonzero | 0.279 |
Performance metrics for the DBMS listed above. Some are normalized by throughput, others are not. Legend for results is here.
ips	qps	rps	rmbps	wps	wmbps	rpq	rkbpq	wpi	wkbpi	csps	cpups	cspq	cpupq	dbgb1	dbgb2	rss	maxop	p50	p99	tag
115976	0	1768	6.9	1667.1	124.4	0.015	0.061	0.014	1.098	211189	41.5	1.821	107	183.2	311.7	7.3	0.773	6043	450	400m.my5651_rel.cy10a_gcp_c2s60
163666	0	0	0.0	4071.4	213.8	0.000	0.000	0.025	1.338	215868	56.6	1.319	104	183.2	311.7	9.1	0.290	8591	449	400m.my5740_rel_lto.cy10a_gcp_c2s60
186567	0	10	0.1	5389.5	255.7	0.000	0.001	0.029	1.403	256301	59.9	1.374	96	183.1	311.7	9.2	0.312	9939	400	400m.my8022_rel_lto.cy10a_gcp_c2s60
191663	0	4	0.1	5291.2	253.0	0.000	0.000	0.028	1.352	257029	60.6	1.341	95	183.2	311.8	9.3	0.250	10139	450	400m.my8028_rel_lto.cy10a_gcp_c2s60
180914	0	2	0.0	6351.7	283.8	0.000	0.000	0.035	1.607	230266	61.0	1.273	101	183.0	311.5	9.3	0.283	9598	400	400m.my8031_rel_lto.cy10a_gcp_c2s60
179453	0	33	0.6	6343.5	281.7	0.000	0.003	0.035	1.607	230919	61.2	1.287	102	182.8	311.4	9.3	0.279	9540	400	400m.my8032_rel_lto.cy10a_gcp_c2s60
q100.1
q100.1: range queries with 100 insert/s per client. Graphs for performance per 1-second interval are here.
Average throughput:
Query response time histogram: each cell has the percentage of responses that take <= the time in the header and max is the max response time in seconds. For max values in the top 25% of the range have a red background and in the bottom 25% of the range have a green background. The red background is not used when the min value is within 80% of the max value.
| dbms | 256us | 1ms | 4ms | 16ms | 64ms | 256ms | 1s | 4s | 16s | gt | max |
|---|---|---|---|---|---|---|---|---|---|---|---|
| my5651_rel.cy10a_gcp_c2s60 | 99.565 | 0.422 | 0.011 | 0.002 | nonzero | 0.024 | |||||
| my5740_rel_lto.cy10a_gcp_c2s60 | 98.660 | 1.334 | 0.005 | nonzero | nonzero | 0.026 | |||||
| my8022_rel_lto.cy10a_gcp_c2s60 | 97.698 | 2.281 | 0.021 | nonzero | nonzero | 0.027 | |||||
| my8028_rel_lto.cy10a_gcp_c2s60 | 97.436 | 2.537 | 0.027 | nonzero | nonzero | 0.028 | |||||
| my8031_rel_lto.cy10a_gcp_c2s60 | 95.664 | 4.305 | 0.031 | nonzero | nonzero | 0.024 | |||||
| my8032_rel_lto.cy10a_gcp_c2s60 | 95.267 | 4.694 | 0.038 | nonzero | nonzero | 0.023 |
Insert response time histogram: each cell has the percentage of responses that take <= the time in the header and max is the max response time in seconds. For max values in the top 25% of the range have a red background and in the bottom 25% of the range have a green background. The red background is not used when the min value is within 80% of the max value.
| dbms | 256us | 1ms | 4ms | 16ms | 64ms | 256ms | 1s | 4s | 16s | gt | max |
|---|---|---|---|---|---|---|---|---|---|---|---|
| my5651_rel.cy10a_gcp_c2s60 | 90.058 | 9.919 | 0.022 | 0.023 | |||||||
| my5740_rel_lto.cy10a_gcp_c2s60 | 96.324 | 3.662 | 0.014 | 0.019 | |||||||
| my8022_rel_lto.cy10a_gcp_c2s60 | 81.647 | 18.146 | 0.207 | 0.031 | |||||||
| my8028_rel_lto.cy10a_gcp_c2s60 | 84.361 | 15.568 | 0.071 | 0.023 | |||||||
| my8031_rel_lto.cy10a_gcp_c2s60 | 86.426 | 13.482 | 0.092 | 0.027 | |||||||
| my8032_rel_lto.cy10a_gcp_c2s60 | 86.544 | 13.356 | 0.100 | 0.030 |
Performance metrics for the DBMS listed above. Some are normalized by throughput, others are not. Legend for results is here.
ips	qps	rps	rmbps	wps	wmbps	rpq	rkbpq	wpi	wkbpi	csps	cpups	cspq	cpupq	dbgb1	dbgb2	rss	maxop	p50	p99	tag
1976	138130	33	0.1	842.1	35.0	0.000	0.001	0.426	18.160	492310	64.2	3.564	139	185.4	313.9	7.3	0.024	6904	6651	400m.my5651_rel.cy10a_gcp_c2s60
1976	120564	1	0.0	1041.0	43.9	0.000	0.000	0.527	22.731	436369	65.5	3.619	163	185.4	313.9	9.1	0.026	6089	5914	400m.my5740_rel_lto.cy10a_gcp_c2s60
1976	109647	129	5.1	1342.2	49.1	0.001	0.048	0.679	25.422	403672	65.3	3.682	179	185.3	313.9	9.2	0.027	5500	5178	400m.my8022_rel_lto.cy10a_gcp_c2s60
1976	105801	202	6.0	1402.4	50.6	0.002	0.058	0.710	26.249	392890	65.5	3.713	186	185.5	314.0	9.3	0.028	5356	4908	400m.my8028_rel_lto.cy10a_gcp_c2s60
1976	99113	152	5.2	1595.2	59.1	0.002	0.053	0.807	30.612	372230	65.8	3.756	199	185.2	313.8	9.3	0.024	5066	4411	400m.my8031_rel_lto.cy10a_gcp_c2s60
1977	98197	178	5.7	1595.5	59.0	0.002	0.059	0.807	30.576	369231	65.7	3.760	201	185.0	313.6	9.3	0.023	5005	3549	400m.my8032_rel_lto.cy10a_gcp_c2s60
q500.1
q500.1: range queries with 500 insert/s per client. Graphs for performance per 1-second interval are here.
Average throughput:
Query response time histogram: each cell has the percentage of responses that take <= the time in the header and max is the max response time in seconds. For max values in the top 25% of the range have a red background and in the bottom 25% of the range have a green background. The red background is not used when the min value is within 80% of the max value.
| dbms | 256us | 1ms | 4ms | 16ms | 64ms | 256ms | 1s | 4s | 16s | gt | max |
|---|---|---|---|---|---|---|---|---|---|---|---|
| my5651_rel.cy10a_gcp_c2s60 | 98.988 | 0.953 | 0.047 | 0.012 | nonzero | 0.024 | |||||
| my5740_rel_lto.cy10a_gcp_c2s60 | 98.720 | 1.249 | 0.029 | 0.001 | nonzero | 0.027 | |||||
| my8022_rel_lto.cy10a_gcp_c2s60 | 97.817 | 2.150 | 0.032 | 0.002 | nonzero | 0.027 | |||||
| my8028_rel_lto.cy10a_gcp_c2s60 | 97.849 | 2.119 | 0.030 | 0.001 | nonzero | 0.028 | |||||
| my8031_rel_lto.cy10a_gcp_c2s60 | 96.215 | 3.750 | 0.033 | 0.002 | nonzero | 0.028 | |||||
| my8032_rel_lto.cy10a_gcp_c2s60 | 96.017 | 3.948 | 0.034 | 0.002 | nonzero | 0.024 |
Insert response time histogram: each cell has the percentage of responses that take <= the time in the header and max is the max response time in seconds. For max values in the top 25% of the range have a red background and in the bottom 25% of the range have a green background. The red background is not used when the min value is within 80% of the max value.
| dbms | 256us | 1ms | 4ms | 16ms | 64ms | 256ms | 1s | 4s | 16s | gt | max |
|---|---|---|---|---|---|---|---|---|---|---|---|
| my5651_rel.cy10a_gcp_c2s60 | 6.715 | 80.114 | 13.170 | 0.052 | |||||||
| my5740_rel_lto.cy10a_gcp_c2s60 | 36.829 | 58.711 | 4.460 | 0.052 | |||||||
| my8022_rel_lto.cy10a_gcp_c2s60 | 29.107 | 65.587 | 5.306 | 0.049 | |||||||
| my8028_rel_lto.cy10a_gcp_c2s60 | 31.898 | 64.369 | 3.734 | 0.046 | |||||||
| my8031_rel_lto.cy10a_gcp_c2s60 | 27.689 | 67.398 | 4.914 | 0.049 | |||||||
| my8032_rel_lto.cy10a_gcp_c2s60 | 26.982 | 67.736 | 5.281 | 0.047 |
Performance metrics for the DBMS listed above. Some are normalized by throughput, others are not. Legend for results is here.
ips	qps	rps	rmbps	wps	wmbps	rpq	rkbpq	wpi	wkbpi	csps	cpups	cspq	cpupq	dbgb1	dbgb2	rss	maxop	p50	p99	tag
9885	135939	158	0.8	327.5	24.8	0.001	0.006	0.033	2.565	482549	65.1	3.550	144	194.8	323.3	7.3	0.024	6763	6361	400m.my5651_rel.cy10a_gcp_c2s60
9885	120747	8	0.2	281.7	20.6	0.000	0.002	0.028	2.135	423510	66.6	3.507	165	195.0	323.5	9.1	0.027	5945	5738	400m.my5740_rel_lto.cy10a_gcp_c2s60
9885	109452	6	0.1	491.5	26.2	0.000	0.001	0.050	2.714	391676	66.6	3.579	183	194.9	323.4	9.2	0.027	5514	5290	400m.my8022_rel_lto.cy10a_gcp_c2s60
9890	107448	6	0.1	478.3	25.7	0.000	0.001	0.048	2.664	382691	67.1	3.562	187	195.0	323.6	9.3	0.028	5354	5117	400m.my8028_rel_lto.cy10a_gcp_c2s60
9885	99607	6	0.1	540.7	27.0	0.000	0.001	0.055	2.793	359533	66.6	3.610	201	194.7	323.3	9.3	0.028	5050	4764	400m.my8031_rel_lto.cy10a_gcp_c2s60
9885	98890	6	0.1	534.8	26.8	0.000	0.001	0.054	2.778	356034	66.7	3.600	202	194.6	323.1	9.3	0.024	4907	4635	400m.my8032_rel_lto.cy10a_gcp_c2s60
q1000.1
q1000.1: range queries with 1000 insert/s per client. Graphs for performance per 1-second interval are here.
Average throughput:
Query response time histogram: each cell has the percentage of responses that take <= the time in the header and max is the max response time in seconds. For max values in the top 25% of the range have a red background and in the bottom 25% of the range have a green background. The red background is not used when the min value is within 80% of the max value.
| dbms | 256us | 1ms | 4ms | 16ms | 64ms | 256ms | 1s | 4s | 16s | gt | max |
|---|---|---|---|---|---|---|---|---|---|---|---|
| my5651_rel.cy10a_gcp_c2s60 | 98.165 | 1.766 | 0.058 | 0.011 | nonzero | 0.028 | |||||
| my5740_rel_lto.cy10a_gcp_c2s60 | 98.788 | 1.174 | 0.034 | 0.004 | nonzero | 0.028 | |||||
| my8022_rel_lto.cy10a_gcp_c2s60 | 97.812 | 2.147 | 0.035 | 0.006 | nonzero | 0.028 | |||||
| my8028_rel_lto.cy10a_gcp_c2s60 | 97.753 | 2.206 | 0.037 | 0.004 | nonzero | 0.041 | |||||
| my8031_rel_lto.cy10a_gcp_c2s60 | 96.010 | 3.943 | 0.042 | 0.005 | nonzero | 0.024 | |||||
| my8032_rel_lto.cy10a_gcp_c2s60 | 95.606 | 4.346 | 0.043 | 0.005 | nonzero | 0.028 |
Insert response time histogram: each cell has the percentage of responses that take <= the time in the header and max is the max response time in seconds. For max values in the top 25% of the range have a red background and in the bottom 25% of the range have a green background. The red background is not used when the min value is within 80% of the max value.
| dbms | 256us | 1ms | 4ms | 16ms | 64ms | 256ms | 1s | 4s | 16s | gt | max |
|---|---|---|---|---|---|---|---|---|---|---|---|
| my5651_rel.cy10a_gcp_c2s60 | 7.799 | 83.201 | 9.000 | 0.053 | |||||||
| my5740_rel_lto.cy10a_gcp_c2s60 | 49.319 | 48.596 | 2.085 | 0.054 | |||||||
| my8022_rel_lto.cy10a_gcp_c2s60 | 41.425 | 55.991 | 2.581 | 0.003 | 0.119 | ||||||
| my8028_rel_lto.cy10a_gcp_c2s60 | 41.154 | 56.690 | 2.156 | 0.063 | |||||||
| my8031_rel_lto.cy10a_gcp_c2s60 | 37.850 | 59.159 | 2.991 | 0.050 | |||||||
| my8032_rel_lto.cy10a_gcp_c2s60 | 37.939 | 59.081 | 2.980 | 0.056 |
Performance metrics for the DBMS listed above. Some are normalized by throughput, others are not. Legend for results is here.
ips	qps	rps	rmbps	wps	wmbps	rpq	rkbpq	wpi	wkbpi	csps	cpups	cspq	cpupq	dbgb1	dbgb2	rss	maxop	p50	p99	tag
19769	132399	313	1.4	401.5	30.7	0.002	0.011	0.020	1.591	473854	66.1	3.579	150	205.9	334.4	7.3	0.028	6649	6061	400m.my5651_rel.cy10a_gcp_c2s60
19769	121097	13	0.2	382.1	27.5	0.000	0.002	0.019	1.425	409739	68.1	3.384	169	206.2	334.7	9.1	0.028	6025	5839	400m.my5740_rel_lto.cy10a_gcp_c2s60
19780	108198	9	0.1	952.4	39.4	0.000	0.001	0.048	2.042	377430	68.1	3.488	189	206.0	334.6	9.2	0.028	5466	5258	400m.my8022_rel_lto.cy10a_gcp_c2s60
19769	105541	10	0.2	1104.6	42.7	0.000	0.002	0.056	2.211	369563	68.5	3.502	195	206.2	334.7	9.3	0.041	5354	5098	400m.my8028_rel_lto.cy10a_gcp_c2s60
19769	97977	10	0.2	2109.5	67.7	0.000	0.002	0.107	3.508	348536	68.8	3.557	211	205.9	334.5	9.3	0.024	5003	4719	400m.my8031_rel_lto.cy10a_gcp_c2s60
19769	97010	10	0.2	2133.9	68.4	0.000	0.002	0.108	3.542	345051	68.8	3.557	213	205.7	334.3	9.3	0.028	4923	4667	400m.my8032_rel_lto.cy10a_gcp_c2s60
l.i0
l.i0: load without secondary indexes
Performance metrics for all DBMS, not just the ones listed above. Some are normalized by throughput, others are not. Legend for results is here.
ips	qps	rps	rmbps	wps	wmbps	rpq	rkbpq	wpi	wkbpi	csps	cpups	cspq	cpupq	dbgb1	dbgb2	rss	maxop	p50	p99	tag
231080	0	1645	6.4	265.6	76.0	0.007	0.028	0.001	0.337	215336	43.9	0.932	57	44.1	172.6	7.3	0.239	11691	9589	400m.my5651_rel.cy10a_gcp_c2s60
289645	0	0	0.0	382.5	94.9	0.000	0.000	0.001	0.335	224032	57.1	0.773	59	44.8	173.3	9.1	0.235	14684	11787	400m.my5740_rel_lto.cy10a_gcp_c2s60
284698	0	0	0.0	672.2	99.4	0.000	0.000	0.002	0.358	302314	57.7	1.062	61	44.7	173.3	9.2	0.228	14384	11886	400m.my8022_rel_lto.cy10a_gcp_c2s60
289645	0	0	0.0	646.1	91.2	0.000	0.000	0.002	0.322	282769	58.9	0.976	61	44.6	173.1	9.3	0.270	14684	11887	400m.my8028_rel_lto.cy10a_gcp_c2s60
268998	0	0	0.0	625.6	81.7	0.000	0.000	0.002	0.311	245872	59.4	0.914	66	44.5	173.1	9.3	0.253	13685	10992	400m.my8031_rel_lto.cy10a_gcp_c2s60
264201	0	0	0.0	614.4	65.4	0.000	0.000	0.002	0.254	248761	59.6	0.942	68	44.5	173.0	9.3	0.235	13385	10888	400m.my8032_rel_lto.cy10a_gcp_c2s60
l.x
l.x: create secondary indexes
Performance metrics for all DBMS, not just the ones listed above. Some are normalized by throughput, others are not. Legend for results is here.
ips	qps	rps	rmbps	wps	wmbps	rpq	rkbpq	wpi	wkbpi	csps	cpups	cspq	cpupq	dbgb1	dbgb2	rss	maxop	p50	p99	tag
166570	0	54	1.9	903.3	198.2	0.000	0.012	0.005	1.219	7303	3.2	0.044	6	71.9	200.4	7.3	0.005	NA	NA	400m.my5651_rel.cy10a_gcp_c2s60
208168	0	4	1.2	715.7	222.7	0.000	0.006	0.003	1.096	11372	3.5	0.055	5	77.3	205.8	9.2	0.004	NA	NA	400m.my5740_rel_lto.cy10a_gcp_c2s60
87016	0	0	0.0	1298.6	96.3	0.000	0.000	0.015	1.133	12722	3.0	0.146	10	77.1	205.7	9.3	0.007	NA	NA	400m.my8022_rel_lto.cy10a_gcp_c2s60
137966	0	692	47.4	3230.2	167.0	0.005	0.352	0.023	1.239	21608	10.7	0.157	23	77.0	205.6	9.3	0.005	NA	NA	400m.my8028_rel_lto.cy10a_gcp_c2s60
122317	0	613	42.1	2861.4	148.1	0.005	0.352	0.023	1.240	19572	10.8	0.160	26	76.9	205.5	9.3	0.005	NA	NA	400m.my8031_rel_lto.cy10a_gcp_c2s60
128650	0	645	44.4	3005.9	155.8	0.005	0.353	0.023	1.240	20556	10.5	0.160	24	76.9	205.4	9.3	0.006	NA	NA	400m.my8032_rel_lto.cy10a_gcp_c2s60
l.i1
l.i1: continue load after secondary indexes created
Performance metrics for all DBMS, not just the ones listed above. Some are normalized by throughput, others are not. Legend for results is here.
ips	qps	rps	rmbps	wps	wmbps	rpq	rkbpq	wpi	wkbpi	csps	cpups	cspq	cpupq	dbgb1	dbgb2	rss	maxop	p50	p99	tag
115976	0	1768	6.9	1667.1	124.4	0.015	0.061	0.014	1.098	211189	41.5	1.821	107	183.2	311.7	7.3	0.773	6043	450	400m.my5651_rel.cy10a_gcp_c2s60
163666	0	0	0.0	4071.4	213.8	0.000	0.000	0.025	1.338	215868	56.6	1.319	104	183.2	311.7	9.1	0.290	8591	449	400m.my5740_rel_lto.cy10a_gcp_c2s60
186567	0	10	0.1	5389.5	255.7	0.000	0.001	0.029	1.403	256301	59.9	1.374	96	183.1	311.7	9.2	0.312	9939	400	400m.my8022_rel_lto.cy10a_gcp_c2s60
191663	0	4	0.1	5291.2	253.0	0.000	0.000	0.028	1.352	257029	60.6	1.341	95	183.2	311.8	9.3	0.250	10139	450	400m.my8028_rel_lto.cy10a_gcp_c2s60
180914	0	2	0.0	6351.7	283.8	0.000	0.000	0.035	1.607	230266	61.0	1.273	101	183.0	311.5	9.3	0.283	9598	400	400m.my8031_rel_lto.cy10a_gcp_c2s60
179453	0	33	0.6	6343.5	281.7	0.000	0.003	0.035	1.607	230919	61.2	1.287	102	182.8	311.4	9.3	0.279	9540	400	400m.my8032_rel_lto.cy10a_gcp_c2s60
q100.1
q100.1: range queries with 100 insert/s per client
Performance metrics for all DBMS, not just the ones listed above. Some are normalized by throughput, others are not. Legend for results is here.
ips	qps	rps	rmbps	wps	wmbps	rpq	rkbpq	wpi	wkbpi	csps	cpups	cspq	cpupq	dbgb1	dbgb2	rss	maxop	p50	p99	tag
1976	138130	33	0.1	842.1	35.0	0.000	0.001	0.426	18.160	492310	64.2	3.564	139	185.4	313.9	7.3	0.024	6904	6651	400m.my5651_rel.cy10a_gcp_c2s60
1976	120564	1	0.0	1041.0	43.9	0.000	0.000	0.527	22.731	436369	65.5	3.619	163	185.4	313.9	9.1	0.026	6089	5914	400m.my5740_rel_lto.cy10a_gcp_c2s60
1976	109647	129	5.1	1342.2	49.1	0.001	0.048	0.679	25.422	403672	65.3	3.682	179	185.3	313.9	9.2	0.027	5500	5178	400m.my8022_rel_lto.cy10a_gcp_c2s60
1976	105801	202	6.0	1402.4	50.6	0.002	0.058	0.710	26.249	392890	65.5	3.713	186	185.5	314.0	9.3	0.028	5356	4908	400m.my8028_rel_lto.cy10a_gcp_c2s60
1976	99113	152	5.2	1595.2	59.1	0.002	0.053	0.807	30.612	372230	65.8	3.756	199	185.2	313.8	9.3	0.024	5066	4411	400m.my8031_rel_lto.cy10a_gcp_c2s60
1977	98197	178	5.7	1595.5	59.0	0.002	0.059	0.807	30.576	369231	65.7	3.760	201	185.0	313.6	9.3	0.023	5005	3549	400m.my8032_rel_lto.cy10a_gcp_c2s60
q500.1
q500.1: range queries with 500 insert/s per client
Performance metrics for all DBMS, not just the ones listed above. Some are normalized by throughput, others are not. Legend for results is here.
ips	qps	rps	rmbps	wps	wmbps	rpq	rkbpq	wpi	wkbpi	csps	cpups	cspq	cpupq	dbgb1	dbgb2	rss	maxop	p50	p99	tag
9885	135939	158	0.8	327.5	24.8	0.001	0.006	0.033	2.565	482549	65.1	3.550	144	194.8	323.3	7.3	0.024	6763	6361	400m.my5651_rel.cy10a_gcp_c2s60
9885	120747	8	0.2	281.7	20.6	0.000	0.002	0.028	2.135	423510	66.6	3.507	165	195.0	323.5	9.1	0.027	5945	5738	400m.my5740_rel_lto.cy10a_gcp_c2s60
9885	109452	6	0.1	491.5	26.2	0.000	0.001	0.050	2.714	391676	66.6	3.579	183	194.9	323.4	9.2	0.027	5514	5290	400m.my8022_rel_lto.cy10a_gcp_c2s60
9890	107448	6	0.1	478.3	25.7	0.000	0.001	0.048	2.664	382691	67.1	3.562	187	195.0	323.6	9.3	0.028	5354	5117	400m.my8028_rel_lto.cy10a_gcp_c2s60
9885	99607	6	0.1	540.7	27.0	0.000	0.001	0.055	2.793	359533	66.6	3.610	201	194.7	323.3	9.3	0.028	5050	4764	400m.my8031_rel_lto.cy10a_gcp_c2s60
9885	98890	6	0.1	534.8	26.8	0.000	0.001	0.054	2.778	356034	66.7	3.600	202	194.6	323.1	9.3	0.024	4907	4635	400m.my8032_rel_lto.cy10a_gcp_c2s60
q1000.1
q1000.1: range queries with 1000 insert/s per client
Performance metrics for all DBMS, not just the ones listed above. Some are normalized by throughput, others are not. Legend for results is here.
ips	qps	rps	rmbps	wps	wmbps	rpq	rkbpq	wpi	wkbpi	csps	cpups	cspq	cpupq	dbgb1	dbgb2	rss	maxop	p50	p99	tag
19769	132399	313	1.4	401.5	30.7	0.002	0.011	0.020	1.591	473854	66.1	3.579	150	205.9	334.4	7.3	0.028	6649	6061	400m.my5651_rel.cy10a_gcp_c2s60
19769	121097	13	0.2	382.1	27.5	0.000	0.002	0.019	1.425	409739	68.1	3.384	169	206.2	334.7	9.1	0.028	6025	5839	400m.my5740_rel_lto.cy10a_gcp_c2s60
19780	108198	9	0.1	952.4	39.4	0.000	0.001	0.048	2.042	377430	68.1	3.488	189	206.0	334.6	9.2	0.028	5466	5258	400m.my8022_rel_lto.cy10a_gcp_c2s60
19769	105541	10	0.2	1104.6	42.7	0.000	0.002	0.056	2.211	369563	68.5	3.502	195	206.2	334.7	9.3	0.041	5354	5098	400m.my8028_rel_lto.cy10a_gcp_c2s60
19769	97977	10	0.2	2109.5	67.7	0.000	0.002	0.107	3.508	348536	68.8	3.557	211	205.9	334.5	9.3	0.024	5003	4719	400m.my8031_rel_lto.cy10a_gcp_c2s60
19769	97010	10	0.2	2133.9	68.4	0.000	0.002	0.108	3.542	345051	68.8	3.557	213	205.7	334.3	9.3	0.028	4923	4667	400m.my8032_rel_lto.cy10a_gcp_c2s60
l.i0
- l.i0: load without secondary indexes
- Legend for results is here.
- Each entry lists the percentage of responses that fit in that bucket (slower than max time for previous bucket, faster than min time for next bucket).
Insert response time histogram
256us	1ms	4ms	16ms	64ms	256ms	1s	4s	16s	gt	max	tag
0.000	0.534	0.538	98.085	0.807	0.036	0.000	0.000	0.000	0.000	0.239	my5651_rel.cy10a_gcp_c2s60
0.000	0.501	0.915	98.440	0.107	0.036	0.000	0.000	0.000	0.000	0.235	my5740_rel_lto.cy10a_gcp_c2s60
0.000	0.313	0.843	98.779	0.026	0.038	0.000	0.000	0.000	0.000	0.228	my8022_rel_lto.cy10a_gcp_c2s60
0.000	0.324	0.916	98.688	0.036	0.036	nonzero	0.000	0.000	0.000	0.270	my8028_rel_lto.cy10a_gcp_c2s60
0.000	0.294	0.655	98.972	0.043	0.037	0.000	0.000	0.000	0.000	0.253	my8031_rel_lto.cy10a_gcp_c2s60
0.000	0.290	0.559	99.070	0.044	0.037	0.000	0.000	0.000	0.000	0.235	my8032_rel_lto.cy10a_gcp_c2s60
l.x
- l.x: create secondary indexes
- Legend for results is here.
- Each entry lists the percentage of responses that fit in that bucket (slower than max time for previous bucket, faster than min time for next bucket).
TODO - determine whether there is data for create index response time
l.i1
- l.i1: continue load after secondary indexes created
- Legend for results is here.
- Each entry lists the percentage of responses that fit in that bucket (slower than max time for previous bucket, faster than min time for next bucket).
Insert response time histogram
256us	1ms	4ms	16ms	64ms	256ms	1s	4s	16s	gt	max	tag
0.000	0.000	0.056	98.818	0.985	0.141	nonzero	0.000	0.000	0.000	0.773	my5651_rel.cy10a_gcp_c2s60
0.000	0.000	0.119	99.431	0.306	0.143	nonzero	0.000	0.000	0.000	0.290	my5740_rel_lto.cy10a_gcp_c2s60
0.000	0.000	5.099	94.489	0.261	0.151	nonzero	0.000	0.000	0.000	0.312	my8022_rel_lto.cy10a_gcp_c2s60
0.000	0.000	6.500	93.124	0.241	0.135	0.000	0.000	0.000	0.000	0.250	my8028_rel_lto.cy10a_gcp_c2s60
0.000	0.000	2.116	97.483	0.246	0.154	nonzero	0.000	0.000	0.000	0.283	my8031_rel_lto.cy10a_gcp_c2s60
0.000	0.000	1.652	97.945	0.246	0.157	nonzero	0.000	0.000	0.000	0.279	my8032_rel_lto.cy10a_gcp_c2s60
q100.1
- q100.1: range queries with 100 insert/s per client
- Legend for results is here.
- Each entry lists the percentage of responses that fit in that bucket (slower than max time for previous bucket, faster than min time for next bucket).
Query response time histogram
256us	1ms	4ms	16ms	64ms	256ms	1s	4s	16s	gt	max	tag
99.565	0.422	0.011	0.002	nonzero	0.000	0.000	0.000	0.000	0.000	0.024	my5651_rel.cy10a_gcp_c2s60
98.660	1.334	0.005	nonzero	nonzero	0.000	0.000	0.000	0.000	0.000	0.026	my5740_rel_lto.cy10a_gcp_c2s60
97.698	2.281	0.021	nonzero	nonzero	0.000	0.000	0.000	0.000	0.000	0.027	my8022_rel_lto.cy10a_gcp_c2s60
97.436	2.537	0.027	nonzero	nonzero	0.000	0.000	0.000	0.000	0.000	0.028	my8028_rel_lto.cy10a_gcp_c2s60
95.664	4.305	0.031	nonzero	nonzero	0.000	0.000	0.000	0.000	0.000	0.024	my8031_rel_lto.cy10a_gcp_c2s60
95.267	4.694	0.038	nonzero	nonzero	0.000	0.000	0.000	0.000	0.000	0.023	my8032_rel_lto.cy10a_gcp_c2s60
Insert response time histogram
256us	1ms	4ms	16ms	64ms	256ms	1s	4s	16s	gt	max	tag
0.000	0.000	90.058	9.919	0.022	0.000	0.000	0.000	0.000	0.000	0.023	my5651_rel.cy10a_gcp_c2s60
0.000	0.000	96.324	3.662	0.014	0.000	0.000	0.000	0.000	0.000	0.019	my5740_rel_lto.cy10a_gcp_c2s60
0.000	0.000	81.647	18.146	0.207	0.000	0.000	0.000	0.000	0.000	0.031	my8022_rel_lto.cy10a_gcp_c2s60
0.000	0.000	84.361	15.568	0.071	0.000	0.000	0.000	0.000	0.000	0.023	my8028_rel_lto.cy10a_gcp_c2s60
0.000	0.000	86.426	13.482	0.092	0.000	0.000	0.000	0.000	0.000	0.027	my8031_rel_lto.cy10a_gcp_c2s60
0.000	0.000	86.544	13.356	0.100	0.000	0.000	0.000	0.000	0.000	0.030	my8032_rel_lto.cy10a_gcp_c2s60
q500.1
- q500.1: range queries with 500 insert/s per client
- Legend for results is here.
- Each entry lists the percentage of responses that fit in that bucket (slower than max time for previous bucket, faster than min time for next bucket).
Query response time histogram
256us	1ms	4ms	16ms	64ms	256ms	1s	4s	16s	gt	max	tag
98.988	0.953	0.047	0.012	nonzero	0.000	0.000	0.000	0.000	0.000	0.024	my5651_rel.cy10a_gcp_c2s60
98.720	1.249	0.029	0.001	nonzero	0.000	0.000	0.000	0.000	0.000	0.027	my5740_rel_lto.cy10a_gcp_c2s60
97.817	2.150	0.032	0.002	nonzero	0.000	0.000	0.000	0.000	0.000	0.027	my8022_rel_lto.cy10a_gcp_c2s60
97.849	2.119	0.030	0.001	nonzero	0.000	0.000	0.000	0.000	0.000	0.028	my8028_rel_lto.cy10a_gcp_c2s60
96.215	3.750	0.033	0.002	nonzero	0.000	0.000	0.000	0.000	0.000	0.028	my8031_rel_lto.cy10a_gcp_c2s60
96.017	3.948	0.034	0.002	nonzero	0.000	0.000	0.000	0.000	0.000	0.024	my8032_rel_lto.cy10a_gcp_c2s60
Insert response time histogram
256us	1ms	4ms	16ms	64ms	256ms	1s	4s	16s	gt	max	tag
0.000	0.000	6.715	80.114	13.170	0.000	0.000	0.000	0.000	0.000	0.052	my5651_rel.cy10a_gcp_c2s60
0.000	0.000	36.829	58.711	4.460	0.000	0.000	0.000	0.000	0.000	0.052	my5740_rel_lto.cy10a_gcp_c2s60
0.000	0.000	29.107	65.587	5.306	0.000	0.000	0.000	0.000	0.000	0.049	my8022_rel_lto.cy10a_gcp_c2s60
0.000	0.000	31.898	64.369	3.734	0.000	0.000	0.000	0.000	0.000	0.046	my8028_rel_lto.cy10a_gcp_c2s60
0.000	0.000	27.689	67.398	4.914	0.000	0.000	0.000	0.000	0.000	0.049	my8031_rel_lto.cy10a_gcp_c2s60
0.000	0.000	26.982	67.736	5.281	0.000	0.000	0.000	0.000	0.000	0.047	my8032_rel_lto.cy10a_gcp_c2s60
q1000.1
- q1000.1: range queries with 1000 insert/s per client
- Legend for results is here.
- Each entry lists the percentage of responses that fit in that bucket (slower than max time for previous bucket, faster than min time for next bucket).
Query response time histogram
256us	1ms	4ms	16ms	64ms	256ms	1s	4s	16s	gt	max	tag
98.165	1.766	0.058	0.011	nonzero	0.000	0.000	0.000	0.000	0.000	0.028	my5651_rel.cy10a_gcp_c2s60
98.788	1.174	0.034	0.004	nonzero	0.000	0.000	0.000	0.000	0.000	0.028	my5740_rel_lto.cy10a_gcp_c2s60
97.812	2.147	0.035	0.006	nonzero	0.000	0.000	0.000	0.000	0.000	0.028	my8022_rel_lto.cy10a_gcp_c2s60
97.753	2.206	0.037	0.004	nonzero	0.000	0.000	0.000	0.000	0.000	0.041	my8028_rel_lto.cy10a_gcp_c2s60
96.010	3.943	0.042	0.005	nonzero	0.000	0.000	0.000	0.000	0.000	0.024	my8031_rel_lto.cy10a_gcp_c2s60
95.606	4.346	0.043	0.005	nonzero	0.000	0.000	0.000	0.000	0.000	0.028	my8032_rel_lto.cy10a_gcp_c2s60
Insert response time histogram
256us	1ms	4ms	16ms	64ms	256ms	1s	4s	16s	gt	max	tag
0.000	0.000	7.799	83.201	9.000	0.000	0.000	0.000	0.000	0.000	0.053	my5651_rel.cy10a_gcp_c2s60
0.000	0.000	49.319	48.596	2.085	0.000	0.000	0.000	0.000	0.000	0.054	my5740_rel_lto.cy10a_gcp_c2s60
0.000	0.000	41.425	55.991	2.581	0.003	0.000	0.000	0.000	0.000	0.119	my8022_rel_lto.cy10a_gcp_c2s60
0.000	0.000	41.154	56.690	2.156	0.000	0.000	0.000	0.000	0.000	0.063	my8028_rel_lto.cy10a_gcp_c2s60
0.000	0.000	37.850	59.159	2.991	0.000	0.000	0.000	0.000	0.000	0.050	my8031_rel_lto.cy10a_gcp_c2s60
0.000	0.000	37.939	59.081	2.980	0.000	0.000	0.000	0.000	0.000	0.056	my8032_rel_lto.cy10a_gcp_c2s60