Introduction
This is a report for the insert benchmark with 400M docs and 20 client(s). It is generated by scripts (bash, awk, sed) and Tufte might not be impressed. An overview of the insert benchmark is here and a short update is here. Below, by DBMS, I mean DBMS+version.config. An example is my8020.c10b40 where my means MySQL, 8020 is version 8.0.20 and c10b40 is the name for the configuration file.
This is a report for the insert benchmark with 400M docs and 20 client(s). It is generated by scripts (bash, awk, sed) and Tufte might not be impressed. An overview of the insert benchmark is here and a short update is here. Below, by DBMS, I mean DBMS+version.config. An example is my8020.c10b40 where my means MySQL, 8020 is version 8.0.20 and c10b40 is the name for the configuration file.The test server is c2-standard-60 from GCP with 30 cores, hyperthreads disabled, 240G RAM and 3T of NVMe (XFS with RAID0 over 8 devices). The benchmark was run with 20 clients and there were 1 or 2 connections per client (1 for queries, 1 for inserts). It uses 1 table. It loads 400M rows per table without secondary indexes, creates secondary indexes, loads another 400M rows per table then does 3 read+write tests for one hour each that do queries as fast as possible with 100, 500 and then 1000 writes/second/client concurrent with the queries. The database is cached by the OS but not by InnoDB. Clients and the DBMS share one server. The per-database configs are in the per-database subdirectories here.
The tested DBMS are:
- my5651_rel.cy10a_gcp_c2s60 - MySQL 5.6.51, the cy10a_gcp_c2s60 config and the build used CMAKE_BUILD_TYPE=Release
- my5740_rel_lto.cy10a_gcp_c2s60 - MySQL 5.7.40, the cy10a_gcp_c2s60 config and the build used CMAKE_BUILD_TYPE=Release -flto
- my8022_rel_lto.cy10a_gcp_c2s60 - MySQL 8.0.22, the cy10a_gcp_c2s60 config and the build used CMAKE_BUILD_TYPE=Release -flto
- my8028_rel_lto.cy10a_gcp_c2s60 - MySQL 8.0.28, the cy10a_gcp_c2s60 config and the build used CMAKE_BUILD_TYPE=Release -flto
- my8031_rel_lto.cy10a_gcp_c2s60 - MySQL 8.0.31, the cy10a_gcp_c2s60 config and the build used CMAKE_BUILD_TYPE=Release -flto
- my8032_rel_lto.cy10a_gcp_c2s60 - MySQL 8.0.32, the cy10a_gcp_c2s60 config and the build used CMAKE_BUILD_TYPE=Release -flto
Contents
- Summary
- l.i0: load without secondary indexes
- l.x: create secondary indexes
- l.i1: continue load after secondary indexes created
- q100.1: range queries with 100 insert/s per client
- q500.1: range queries with 500 insert/s per client
- q1000.1: range queries with 1000 insert/s per client
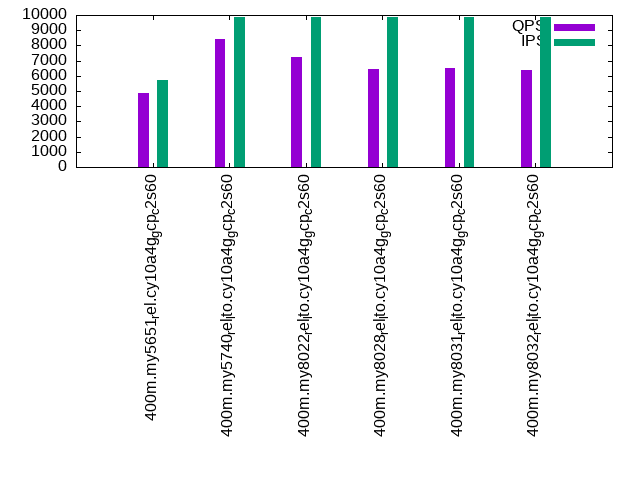
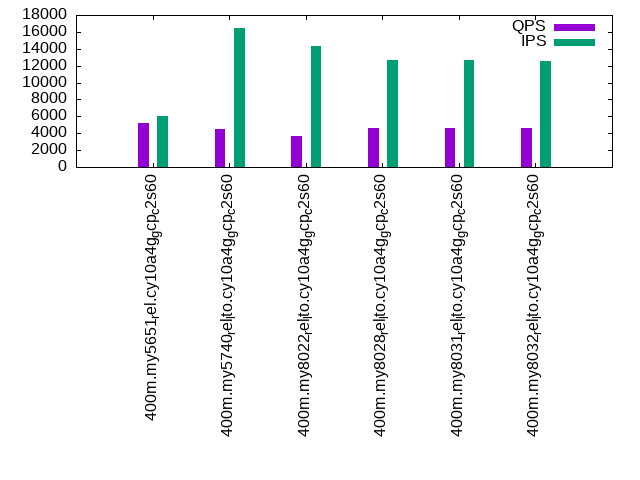
Summary
The numbers are inserts/s for l.i0 and l.i1, indexed docs (or rows) /s for l.x and queries/s for q*.2. The values are the average rate over the entire test for inserts (IPS) and queries (QPS). The range of values for IPS and QPS is split into 3 parts: bottom 25%, middle 50%, top 25%. Values in the bottom 25% have a red background, values in the top 25% have a green background and values in the middle have no color. A gray background is used for values that can be ignored because the DBMS did not sustain the target insert rate. Red backgrounds are not used when the minimum value is within 80% of the max value.
| dbms | l.i0 | l.x | l.i1 | q100.1 | q500.1 | q1000.1 |
|---|---|---|---|---|---|---|
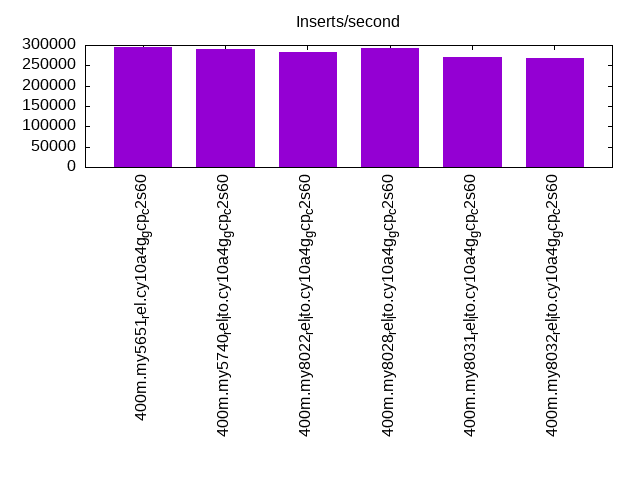
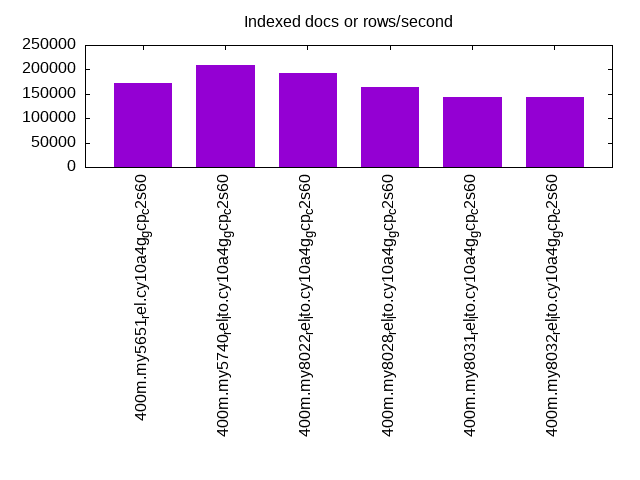
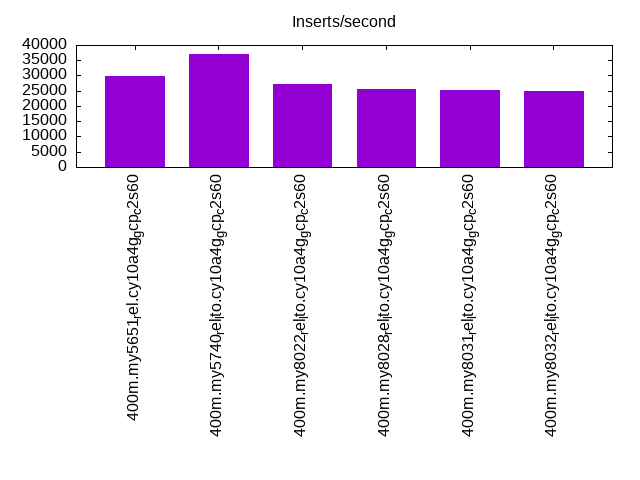
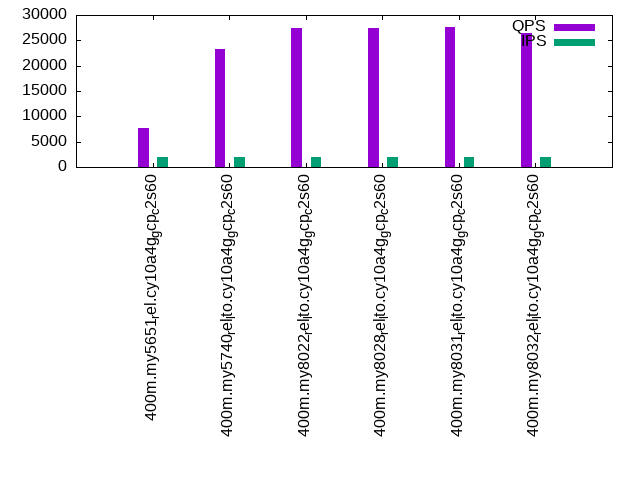
| 400m.my5651_rel.cy10a4g_gcp_c2s60 | 293902 | 172012 | 29976 | 7736 | 4883 | 5259 |
| 400m.my5740_rel_lto.cy10a4g_gcp_c2s60 | 290276 | 209367 | 36952 | 23306 | 8415 | 4544 |
| 400m.my8022_rel_lto.cy10a4g_gcp_c2s60 | 283688 | 192263 | 27069 | 27495 | 7242 | 3673 |
| 400m.my8028_rel_lto.cy10a4g_gcp_c2s60 | 293470 | 163774 | 25541 | 27342 | 6440 | 4613 |
| 400m.my8031_rel_lto.cy10a4g_gcp_c2s60 | 271555 | 142435 | 25374 | 27646 | 6518 | 4662 |
| 400m.my8032_rel_lto.cy10a4g_gcp_c2s60 | 267917 | 143559 | 24938 | 26507 | 6407 | 4568 |
This table has relative throughput, throughput for the DBMS relative to the DBMS in the first line, using the absolute throughput from the previous table.
| dbms | l.i0 | l.x | l.i1 | q100.1 | q500.1 | q1000.1 |
|---|---|---|---|---|---|---|
| 400m.my5651_rel.cy10a4g_gcp_c2s60 | 1.00 | 1.00 | 1.00 | 1.00 | 1.00 | 1.00 |
| 400m.my5740_rel_lto.cy10a4g_gcp_c2s60 | 0.99 | 1.22 | 1.23 | 3.01 | 1.72 | 0.86 |
| 400m.my8022_rel_lto.cy10a4g_gcp_c2s60 | 0.97 | 1.12 | 0.90 | 3.55 | 1.48 | 0.70 |
| 400m.my8028_rel_lto.cy10a4g_gcp_c2s60 | 1.00 | 0.95 | 0.85 | 3.53 | 1.32 | 0.88 |
| 400m.my8031_rel_lto.cy10a4g_gcp_c2s60 | 0.92 | 0.83 | 0.85 | 3.57 | 1.33 | 0.89 |
| 400m.my8032_rel_lto.cy10a4g_gcp_c2s60 | 0.91 | 0.83 | 0.83 | 3.43 | 1.31 | 0.87 |
This lists the average rate of inserts/s for the tests that do inserts concurrent with queries. For such tests the query rate is listed in the table above. The read+write tests are setup so that the insert rate should match the target rate every second. Cells that are not at least 95% of the target have a red background to indicate a failure to satisfy the target.
| dbms | q100.1 | q500.1 | q1000.1 |
|---|---|---|---|
| my5651_rel.cy10a4g_gcp_c2s60 | 1976 | 5725 | 6006 |
| my5740_rel_lto.cy10a4g_gcp_c2s60 | 1976 | 9885 | 16461 |
| my8022_rel_lto.cy10a4g_gcp_c2s60 | 1977 | 9885 | 14303 |
| my8028_rel_lto.cy10a4g_gcp_c2s60 | 1977 | 9885 | 12636 |
| my8031_rel_lto.cy10a4g_gcp_c2s60 | 1977 | 9885 | 12614 |
| my8032_rel_lto.cy10a4g_gcp_c2s60 | 1977 | 9885 | 12592 |
| target | 2000 | 10000 | 20000 |
l.i0
l.i0: load without secondary indexes. Graphs for performance per 1-second interval are here.
Average throughput:
Insert response time histogram: each cell has the percentage of responses that take <= the time in the header and max is the max response time in seconds. For the max column values in the top 25% of the range have a red background and in the bottom 25% of the range have a green background. The red background is not used when the min value is within 80% of the max value.
| dbms | 256us | 1ms | 4ms | 16ms | 64ms | 256ms | 1s | 4s | 16s | gt | max |
|---|---|---|---|---|---|---|---|---|---|---|---|
| my5651_rel.cy10a4g_gcp_c2s60 | 0.535 | 1.155 | 97.644 | 0.630 | 0.036 | 0.247 | |||||
| my5740_rel_lto.cy10a4g_gcp_c2s60 | 0.459 | 0.993 | 98.341 | 0.171 | 0.036 | 0.254 | |||||
| my8022_rel_lto.cy10a4g_gcp_c2s60 | 0.293 | 0.800 | 98.856 | 0.012 | 0.039 | nonzero | 0.259 | ||||
| my8028_rel_lto.cy10a4g_gcp_c2s60 | 0.333 | 0.979 | 98.619 | 0.032 | 0.036 | 0.244 | |||||
| my8031_rel_lto.cy10a4g_gcp_c2s60 | 0.303 | 0.687 | 98.934 | 0.039 | 0.036 | nonzero | 0.262 | ||||
| my8032_rel_lto.cy10a4g_gcp_c2s60 | 0.266 | 0.605 | 99.054 | 0.039 | 0.036 | 0.231 |
Performance metrics for the DBMS listed above. Some are normalized by throughput, others are not. Legend for results is here.
ips	qps	rps	rmbps	wps	wmbps	rpq	rkbpq	wpi	wkbpi	csps	cpups	cspq	cpupq	dbgb1	dbgb2	rss	maxop	p50	p99	tag
293902	0	503	2.0	390.5	108.8	0.002	0.007	0.001	0.379	229257	52.6	0.780	54	44.1	172.6	0.3	0.247	16082	10289	400m.my5651_rel.cy10a4g_gcp_c2s60
290276	0	0	0.0	444.0	112.0	0.000	0.000	0.002	0.395	215085	57.4	0.741	59	44.8	173.3	0.5	0.254	14684	11787	400m.my5740_rel_lto.cy10a4g_gcp_c2s60
283688	0	0	0.0	845.5	113.9	0.000	0.000	0.003	0.411	304760	58.1	1.074	61	44.7	173.3	0.6	0.259	14384	11787	400m.my8022_rel_lto.cy10a4g_gcp_c2s60
293470	0	0	0.0	836.0	108.5	0.000	0.000	0.003	0.379	285901	59.5	0.974	61	44.6	173.1	0.7	0.244	14884	11987	400m.my8028_rel_lto.cy10a4g_gcp_c2s60
271555	0	0	0.0	778.4	103.6	0.000	0.000	0.003	0.391	246787	59.8	0.909	66	44.5	173.1	0.7	0.262	13785	10988	400m.my8031_rel_lto.cy10a4g_gcp_c2s60
267917	0	0	0.0	764.1	90.4	0.000	0.000	0.003	0.346	249098	60.0	0.930	67	44.4	173.0	0.7	0.231	13585	11088	400m.my8032_rel_lto.cy10a4g_gcp_c2s60
l.x
l.x: create secondary indexes.
Average throughput:
Performance metrics for the DBMS listed above. Some are normalized by throughput, others are not. Legend for results is here.
ips	qps	rps	rmbps	wps	wmbps	rpq	rkbpq	wpi	wkbpi	csps	cpups	cspq	cpupq	dbgb1	dbgb2	rss	maxop	p50	p99	tag
172012	0	0	0.0	901.4	194.0	0.000	0.000	0.005	1.155	6424	3.3	0.037	6	71.8	200.3	0.3	0.005	NA	NA	400m.my5651_rel.cy10a4g_gcp_c2s60
209367	0	0	0.0	647.6	216.0	0.000	0.000	0.003	1.056	9754	3.5	0.047	5	77.3	205.8	0.5	0.004	NA	NA	400m.my5740_rel_lto.cy10a4g_gcp_c2s60
192263	0	0	0.0	911.1	202.1	0.000	0.000	0.005	1.076	11376	3.6	0.059	6	77.2	205.7	0.7	0.008	NA	NA	400m.my8022_rel_lto.cy10a4g_gcp_c2s60
163774	0	814	56.4	2652.7	193.7	0.005	0.353	0.016	1.211	17131	11.4	0.105	21	77.0	205.6	0.7	0.005	NA	NA	400m.my8028_rel_lto.cy10a4g_gcp_c2s60
142435	0	708	49.1	2454.9	168.5	0.005	0.353	0.017	1.211	15943	11.4	0.112	24	76.9	205.5	0.7	0.005	NA	NA	400m.my8031_rel_lto.cy10a4g_gcp_c2s60
143559	0	713	49.4	2425.9	169.8	0.005	0.352	0.017	1.211	15253	11.5	0.106	24	76.9	205.4	0.7	0.005	NA	NA	400m.my8032_rel_lto.cy10a4g_gcp_c2s60
l.i1
l.i1: continue load after secondary indexes created. Graphs for performance per 1-second interval are here.
Average throughput:
Insert response time histogram: each cell has the percentage of responses that take <= the time in the header and max is the max response time in seconds. For the max column values in the top 25% of the range have a red background and in the bottom 25% of the range have a green background. The red background is not used when the min value is within 80% of the max value.
| dbms | 256us | 1ms | 4ms | 16ms | 64ms | 256ms | 1s | 4s | 16s | gt | max |
|---|---|---|---|---|---|---|---|---|---|---|---|
| my5651_rel.cy10a4g_gcp_c2s60 | 0.266 | 27.973 | 61.278 | 10.318 | 0.165 | nonzero | 1.003 | ||||
| my5740_rel_lto.cy10a4g_gcp_c2s60 | 0.669 | 53.393 | 36.062 | 9.716 | 0.159 | 0.973 | |||||
| my8022_rel_lto.cy10a4g_gcp_c2s60 | 0.794 | 28.167 | 56.874 | 13.890 | 0.275 | nonzero | 1.128 | ||||
| my8028_rel_lto.cy10a4g_gcp_c2s60 | 0.436 | 29.707 | 53.880 | 15.496 | 0.479 | 0.001 | 1.203 | ||||
| my8031_rel_lto.cy10a4g_gcp_c2s60 | 0.232 | 29.912 | 53.774 | 15.574 | 0.507 | 0.001 | 1.297 | ||||
| my8032_rel_lto.cy10a4g_gcp_c2s60 | 0.205 | 28.511 | 54.723 | 16.063 | 0.497 | 0.001 | 1.242 |
Performance metrics for the DBMS listed above. Some are normalized by throughput, others are not. Legend for results is here.
ips	qps	rps	rmbps	wps	wmbps	rpq	rkbpq	wpi	wkbpi	csps	cpups	cspq	cpupq	dbgb1	dbgb2	rss	maxop	p50	p99	tag
29976	0	196	0.8	13992.1	465.0	0.007	0.027	0.467	15.885	153311	21.2	5.114	212	181.9	311.8	0.3	1.003	1698	100	400m.my5651_rel.cy10a4g_gcp_c2s60
36952	0	0	0.0	13716.1	490.8	0.000	0.000	0.371	13.602	147609	24.2	3.995	196	183.5	313.3	0.5	0.973	2048	150	400m.my5740_rel_lto.cy10a4g_gcp_c2s60
27069	0	4	0.1	17883.8	444.2	0.000	0.004	0.661	16.805	276693	19.8	10.222	219	184.6	314.5	0.6	1.128	1448	100	400m.my8022_rel_lto.cy10a4g_gcp_c2s60
25541	0	2	0.0	16779.5	432.7	0.000	0.002	0.657	17.348	234629	20.5	9.186	241	184.2	314.0	0.7	1.203	1349	100	400m.my8028_rel_lto.cy10a4g_gcp_c2s60
25374	0	0	0.0	16669.2	432.5	0.000	0.001	0.657	17.454	231990	21.8	9.143	258	184.0	313.8	0.7	1.297	1349	100	400m.my8031_rel_lto.cy10a4g_gcp_c2s60
24938	0	0	0.0	16374.8	422.8	0.000	0.001	0.657	17.362	229692	21.6	9.211	260	183.8	313.6	0.7	1.242	1299	100	400m.my8032_rel_lto.cy10a4g_gcp_c2s60
q100.1
q100.1: range queries with 100 insert/s per client. Graphs for performance per 1-second interval are here.
Average throughput:
Query response time histogram: each cell has the percentage of responses that take <= the time in the header and max is the max response time in seconds. For max values in the top 25% of the range have a red background and in the bottom 25% of the range have a green background. The red background is not used when the min value is within 80% of the max value.
| dbms | 256us | 1ms | 4ms | 16ms | 64ms | 256ms | 1s | 4s | 16s | gt | max |
|---|---|---|---|---|---|---|---|---|---|---|---|
| my5651_rel.cy10a4g_gcp_c2s60 | 24.885 | 22.473 | 29.767 | 22.253 | 0.622 | nonzero | 0.075 | ||||
| my5740_rel_lto.cy10a4g_gcp_c2s60 | 36.472 | 54.639 | 4.891 | 3.340 | 0.655 | 0.003 | 0.159 | ||||
| my8022_rel_lto.cy10a4g_gcp_c2s60 | 34.435 | 55.873 | 6.285 | 3.210 | 0.197 | 0.001 | 0.205 | ||||
| my8028_rel_lto.cy10a4g_gcp_c2s60 | 33.286 | 57.028 | 6.351 | 3.136 | 0.197 | 0.002 | 0.239 | ||||
| my8031_rel_lto.cy10a4g_gcp_c2s60 | 32.308 | 58.027 | 6.550 | 2.950 | 0.164 | 0.001 | 0.210 | ||||
| my8032_rel_lto.cy10a4g_gcp_c2s60 | 32.045 | 57.710 | 6.806 | 3.250 | 0.188 | 0.001 | 0.200 |
Insert response time histogram: each cell has the percentage of responses that take <= the time in the header and max is the max response time in seconds. For max values in the top 25% of the range have a red background and in the bottom 25% of the range have a green background. The red background is not used when the min value is within 80% of the max value.
| dbms | 256us | 1ms | 4ms | 16ms | 64ms | 256ms | 1s | 4s | 16s | gt | max |
|---|---|---|---|---|---|---|---|---|---|---|---|
| my5651_rel.cy10a4g_gcp_c2s60 | 0.001 | 0.051 | 10.435 | 81.289 | 8.224 | 0.382 | |||||
| my5740_rel_lto.cy10a4g_gcp_c2s60 | 2.847 | 68.458 | 28.647 | 0.047 | 0.334 | ||||||
| my8022_rel_lto.cy10a4g_gcp_c2s60 | 15.315 | 74.165 | 10.463 | 0.057 | 0.332 | ||||||
| my8028_rel_lto.cy10a4g_gcp_c2s60 | 32.968 | 58.508 | 8.107 | 0.417 | 0.914 | ||||||
| my8031_rel_lto.cy10a4g_gcp_c2s60 | 32.892 | 59.718 | 7.054 | 0.336 | 0.712 | ||||||
| my8032_rel_lto.cy10a4g_gcp_c2s60 | 0.001 | 28.915 | 62.910 | 7.739 | 0.435 | 0.588 |
Performance metrics for the DBMS listed above. Some are normalized by throughput, others are not. Legend for results is here.
ips	qps	rps	rmbps	wps	wmbps	rpq	rkbpq	wpi	wkbpi	csps	cpups	cspq	cpupq	dbgb1	dbgb2	rss	maxop	p50	p99	tag
1976	7736	172	5.0	4384.1	140.3	0.022	0.661	2.219	72.737	259474	39.9	33.541	1547	184.9	314.7	0.3	0.075	400	192	400m.my5651_rel.cy10a4g_gcp_c2s60
1976	23306	121	4.5	10365.4	241.6	0.005	0.198	5.246	125.228	252028	31.9	10.814	411	186.5	316.3	0.5	0.159	1279	256	400m.my5740_rel_lto.cy10a4g_gcp_c2s60
1977	27495	126	4.5	12711.3	263.9	0.005	0.168	6.430	136.702	297151	38.5	10.808	420	187.6	317.4	0.7	0.205	1438	224	400m.my8022_rel_lto.cy10a4g_gcp_c2s60
1977	27342	124	4.5	12513.5	258.9	0.005	0.167	6.330	134.116	300158	39.1	10.978	429	187.1	316.9	0.7	0.239	1438	192	400m.my8028_rel_lto.cy10a4g_gcp_c2s60
1977	27646	130	4.5	12236.4	256.1	0.005	0.168	6.190	132.644	295028	40.8	10.671	443	186.9	316.7	0.7	0.210	1454	208	400m.my8031_rel_lto.cy10a4g_gcp_c2s60
1977	26507	118	4.5	12446.3	260.1	0.004	0.172	6.296	134.713	294453	39.7	11.108	449	186.7	316.5	0.7	0.200	1390	192	400m.my8032_rel_lto.cy10a4g_gcp_c2s60
q500.1
q500.1: range queries with 500 insert/s per client. Graphs for performance per 1-second interval are here.
Average throughput:
Query response time histogram: each cell has the percentage of responses that take <= the time in the header and max is the max response time in seconds. For max values in the top 25% of the range have a red background and in the bottom 25% of the range have a green background. The red background is not used when the min value is within 80% of the max value.
| dbms | 256us | 1ms | 4ms | 16ms | 64ms | 256ms | 1s | 4s | 16s | gt | max |
|---|---|---|---|---|---|---|---|---|---|---|---|
| my5651_rel.cy10a4g_gcp_c2s60 | 17.461 | 14.674 | 32.162 | 32.532 | 3.171 | nonzero | 0.096 | ||||
| my5740_rel_lto.cy10a4g_gcp_c2s60 | 35.702 | 36.741 | 11.190 | 13.247 | 3.108 | 0.012 | 0.137 | ||||
| my8022_rel_lto.cy10a4g_gcp_c2s60 | 32.909 | 31.711 | 11.064 | 21.733 | 2.580 | 0.003 | 0.185 | ||||
| my8028_rel_lto.cy10a4g_gcp_c2s60 | 31.412 | 29.900 | 12.497 | 22.831 | 3.333 | 0.027 | nonzero | 0.273 | |||
| my8031_rel_lto.cy10a4g_gcp_c2s60 | 29.326 | 32.132 | 12.706 | 22.604 | 3.206 | 0.025 | nonzero | 0.269 | |||
| my8032_rel_lto.cy10a4g_gcp_c2s60 | 29.236 | 32.122 | 12.393 | 22.877 | 3.347 | 0.025 | nonzero | 0.267 |
Insert response time histogram: each cell has the percentage of responses that take <= the time in the header and max is the max response time in seconds. For max values in the top 25% of the range have a red background and in the bottom 25% of the range have a green background. The red background is not used when the min value is within 80% of the max value.
| dbms | 256us | 1ms | 4ms | 16ms | 64ms | 256ms | 1s | 4s | 16s | gt | max |
|---|---|---|---|---|---|---|---|---|---|---|---|
| my5651_rel.cy10a4g_gcp_c2s60 | 0.007 | 0.181 | 2.356 | 78.494 | 18.963 | 0.507 | |||||
| my5740_rel_lto.cy10a4g_gcp_c2s60 | 0.072 | 16.436 | 64.115 | 19.373 | 0.004 | 0.351 | |||||
| my8022_rel_lto.cy10a4g_gcp_c2s60 | 0.193 | 8.182 | 62.270 | 29.323 | 0.031 | 0.350 | |||||
| my8028_rel_lto.cy10a4g_gcp_c2s60 | 0.270 | 9.666 | 57.814 | 31.038 | 1.212 | 0.956 | |||||
| my8031_rel_lto.cy10a4g_gcp_c2s60 | 0.134 | 8.956 | 58.400 | 31.228 | 1.283 | 0.817 | |||||
| my8032_rel_lto.cy10a4g_gcp_c2s60 | 0.164 | 10.018 | 58.629 | 30.011 | 1.177 | 0.958 |
Performance metrics for the DBMS listed above. Some are normalized by throughput, others are not. Legend for results is here.
ips	qps	rps	rmbps	wps	wmbps	rpq	rkbpq	wpi	wkbpi	csps	cpups	cspq	cpupq	dbgb1	dbgb2	rss	maxop	p50	p99	tag
5725	4883	190	1.7	6767.6	225.0	0.039	0.362	1.182	40.243	279508	37.2	57.239	2285	194.2	324.0	0.3	0.096	240	208	400m.my5651_rel.cy10a4g_gcp_c2s60
9885	8415	128	1.8	14672.4	373.4	0.015	0.213	1.484	38.678	219381	20.9	26.071	745	195.9	325.7	0.5	0.137	416	288	400m.my5740_rel_lto.cy10a4g_gcp_c2s60
9885	7242	160	2.1	18582.2	367.3	0.022	0.297	1.880	38.049	382152	23.7	52.770	982	197.0	326.8	0.7	0.185	352	256	400m.my8022_rel_lto.cy10a4g_gcp_c2s60
9885	6440	207	2.7	18060.9	359.1	0.032	0.434	1.827	37.197	363619	23.3	56.463	1085	196.6	326.4	0.7	0.273	320	224	400m.my8028_rel_lto.cy10a4g_gcp_c2s60
9885	6518	233	3.0	18093.0	362.5	0.036	0.474	1.830	37.558	363443	24.5	55.758	1128	196.3	326.1	0.7	0.269	320	224	400m.my8031_rel_lto.cy10a4g_gcp_c2s60
9885	6407	175	2.5	17790.0	359.0	0.027	0.402	1.800	37.196	359334	24.5	56.087	1147	196.2	326.0	0.7	0.267	320	224	400m.my8032_rel_lto.cy10a4g_gcp_c2s60
q1000.1
q1000.1: range queries with 1000 insert/s per client. Graphs for performance per 1-second interval are here.
Average throughput:
Query response time histogram: each cell has the percentage of responses that take <= the time in the header and max is the max response time in seconds. For max values in the top 25% of the range have a red background and in the bottom 25% of the range have a green background. The red background is not used when the min value is within 80% of the max value.
| dbms | 256us | 1ms | 4ms | 16ms | 64ms | 256ms | 1s | 4s | 16s | gt | max |
|---|---|---|---|---|---|---|---|---|---|---|---|
| my5651_rel.cy10a4g_gcp_c2s60 | 19.192 | 15.180 | 31.968 | 31.238 | 2.423 | nonzero | 0.090 | ||||
| my5740_rel_lto.cy10a4g_gcp_c2s60 | 32.701 | 29.651 | 11.577 | 18.265 | 7.539 | 0.266 | 0.169 | ||||
| my8022_rel_lto.cy10a4g_gcp_c2s60 | 28.780 | 21.149 | 9.625 | 31.236 | 9.065 | 0.145 | 0.248 | ||||
| my8028_rel_lto.cy10a4g_gcp_c2s60 | 28.902 | 26.661 | 13.584 | 24.445 | 6.168 | 0.240 | nonzero | 0.364 | |||
| my8031_rel_lto.cy10a4g_gcp_c2s60 | 26.173 | 29.249 | 13.929 | 24.388 | 6.032 | 0.229 | nonzero | 0.355 | |||
| my8032_rel_lto.cy10a4g_gcp_c2s60 | 26.278 | 29.185 | 13.480 | 24.582 | 6.231 | 0.244 | nonzero | 0.394 |
Insert response time histogram: each cell has the percentage of responses that take <= the time in the header and max is the max response time in seconds. For max values in the top 25% of the range have a red background and in the bottom 25% of the range have a green background. The red background is not used when the min value is within 80% of the max value.
| dbms | 256us | 1ms | 4ms | 16ms | 64ms | 256ms | 1s | 4s | 16s | gt | max |
|---|---|---|---|---|---|---|---|---|---|---|---|
| my5651_rel.cy10a4g_gcp_c2s60 | 0.003 | 0.063 | 7.632 | 75.226 | 17.076 | 0.548 | |||||
| my5740_rel_lto.cy10a4g_gcp_c2s60 | 0.475 | 9.549 | 50.912 | 38.996 | 0.068 | 0.392 | |||||
| my8022_rel_lto.cy10a4g_gcp_c2s60 | 0.366 | 5.542 | 48.964 | 44.733 | 0.395 | 0.571 | |||||
| my8028_rel_lto.cy10a4g_gcp_c2s60 | 0.235 | 5.871 | 47.967 | 43.305 | 2.620 | 0.002 | 1.287 | ||||
| my8031_rel_lto.cy10a4g_gcp_c2s60 | 0.112 | 5.304 | 48.386 | 43.551 | 2.644 | 0.003 | 1.162 | ||||
| my8032_rel_lto.cy10a4g_gcp_c2s60 | 0.124 | 5.392 | 48.177 | 43.716 | 2.590 | 0.001 | 1.370 |
Performance metrics for the DBMS listed above. Some are normalized by throughput, others are not. Legend for results is here.
ips	qps	rps	rmbps	wps	wmbps	rpq	rkbpq	wpi	wkbpi	csps	cpups	cspq	cpupq	dbgb1	dbgb2	rss	maxop	p50	p99	tag
6006	5259	132	1.0	5772.5	202.7	0.025	0.200	0.961	34.566	295568	39.6	56.203	2259	206.0	335.8	0.2	0.090	256	208	400m.my5651_rel.cy10a4g_gcp_c2s60
16461	4544	164	2.4	14853.7	422.5	0.036	0.540	0.902	26.286	235686	22.3	51.862	1472	207.8	337.7	0.5	0.169	224	160	400m.my5740_rel_lto.cy10a4g_gcp_c2s60
14303	3673	207	2.8	17827.9	376.2	0.056	0.782	1.246	26.935	421395	23.7	114.718	1936	209.1	338.9	0.7	0.248	176	128	400m.my8022_rel_lto.cy10a4g_gcp_c2s60
12636	4613	183	2.7	16363.3	355.8	0.040	0.597	1.295	28.830	353855	23.7	76.712	1541	208.7	338.5	0.7	0.364	224	144	400m.my8028_rel_lto.cy10a4g_gcp_c2s60
12614	4662	211	2.9	16413.0	360.0	0.045	0.631	1.301	29.225	350666	25.1	75.213	1615	208.4	338.2	0.7	0.355	240	144	400m.my8031_rel_lto.cy10a4g_gcp_c2s60
12592	4568	187	2.7	16228.7	357.2	0.041	0.615	1.289	29.052	348287	24.9	76.245	1635	208.2	338.0	0.7	0.394	224	144	400m.my8032_rel_lto.cy10a4g_gcp_c2s60
l.i0
l.i0: load without secondary indexes
Performance metrics for all DBMS, not just the ones listed above. Some are normalized by throughput, others are not. Legend for results is here.
ips	qps	rps	rmbps	wps	wmbps	rpq	rkbpq	wpi	wkbpi	csps	cpups	cspq	cpupq	dbgb1	dbgb2	rss	maxop	p50	p99	tag
293902	0	503	2.0	390.5	108.8	0.002	0.007	0.001	0.379	229257	52.6	0.780	54	44.1	172.6	0.3	0.247	16082	10289	400m.my5651_rel.cy10a4g_gcp_c2s60
290276	0	0	0.0	444.0	112.0	0.000	0.000	0.002	0.395	215085	57.4	0.741	59	44.8	173.3	0.5	0.254	14684	11787	400m.my5740_rel_lto.cy10a4g_gcp_c2s60
283688	0	0	0.0	845.5	113.9	0.000	0.000	0.003	0.411	304760	58.1	1.074	61	44.7	173.3	0.6	0.259	14384	11787	400m.my8022_rel_lto.cy10a4g_gcp_c2s60
293470	0	0	0.0	836.0	108.5	0.000	0.000	0.003	0.379	285901	59.5	0.974	61	44.6	173.1	0.7	0.244	14884	11987	400m.my8028_rel_lto.cy10a4g_gcp_c2s60
271555	0	0	0.0	778.4	103.6	0.000	0.000	0.003	0.391	246787	59.8	0.909	66	44.5	173.1	0.7	0.262	13785	10988	400m.my8031_rel_lto.cy10a4g_gcp_c2s60
267917	0	0	0.0	764.1	90.4	0.000	0.000	0.003	0.346	249098	60.0	0.930	67	44.4	173.0	0.7	0.231	13585	11088	400m.my8032_rel_lto.cy10a4g_gcp_c2s60
l.x
l.x: create secondary indexes
Performance metrics for all DBMS, not just the ones listed above. Some are normalized by throughput, others are not. Legend for results is here.
ips	qps	rps	rmbps	wps	wmbps	rpq	rkbpq	wpi	wkbpi	csps	cpups	cspq	cpupq	dbgb1	dbgb2	rss	maxop	p50	p99	tag
172012	0	0	0.0	901.4	194.0	0.000	0.000	0.005	1.155	6424	3.3	0.037	6	71.8	200.3	0.3	0.005	NA	NA	400m.my5651_rel.cy10a4g_gcp_c2s60
209367	0	0	0.0	647.6	216.0	0.000	0.000	0.003	1.056	9754	3.5	0.047	5	77.3	205.8	0.5	0.004	NA	NA	400m.my5740_rel_lto.cy10a4g_gcp_c2s60
192263	0	0	0.0	911.1	202.1	0.000	0.000	0.005	1.076	11376	3.6	0.059	6	77.2	205.7	0.7	0.008	NA	NA	400m.my8022_rel_lto.cy10a4g_gcp_c2s60
163774	0	814	56.4	2652.7	193.7	0.005	0.353	0.016	1.211	17131	11.4	0.105	21	77.0	205.6	0.7	0.005	NA	NA	400m.my8028_rel_lto.cy10a4g_gcp_c2s60
142435	0	708	49.1	2454.9	168.5	0.005	0.353	0.017	1.211	15943	11.4	0.112	24	76.9	205.5	0.7	0.005	NA	NA	400m.my8031_rel_lto.cy10a4g_gcp_c2s60
143559	0	713	49.4	2425.9	169.8	0.005	0.352	0.017	1.211	15253	11.5	0.106	24	76.9	205.4	0.7	0.005	NA	NA	400m.my8032_rel_lto.cy10a4g_gcp_c2s60
l.i1
l.i1: continue load after secondary indexes created
Performance metrics for all DBMS, not just the ones listed above. Some are normalized by throughput, others are not. Legend for results is here.
ips	qps	rps	rmbps	wps	wmbps	rpq	rkbpq	wpi	wkbpi	csps	cpups	cspq	cpupq	dbgb1	dbgb2	rss	maxop	p50	p99	tag
29976	0	196	0.8	13992.1	465.0	0.007	0.027	0.467	15.885	153311	21.2	5.114	212	181.9	311.8	0.3	1.003	1698	100	400m.my5651_rel.cy10a4g_gcp_c2s60
36952	0	0	0.0	13716.1	490.8	0.000	0.000	0.371	13.602	147609	24.2	3.995	196	183.5	313.3	0.5	0.973	2048	150	400m.my5740_rel_lto.cy10a4g_gcp_c2s60
27069	0	4	0.1	17883.8	444.2	0.000	0.004	0.661	16.805	276693	19.8	10.222	219	184.6	314.5	0.6	1.128	1448	100	400m.my8022_rel_lto.cy10a4g_gcp_c2s60
25541	0	2	0.0	16779.5	432.7	0.000	0.002	0.657	17.348	234629	20.5	9.186	241	184.2	314.0	0.7	1.203	1349	100	400m.my8028_rel_lto.cy10a4g_gcp_c2s60
25374	0	0	0.0	16669.2	432.5	0.000	0.001	0.657	17.454	231990	21.8	9.143	258	184.0	313.8	0.7	1.297	1349	100	400m.my8031_rel_lto.cy10a4g_gcp_c2s60
24938	0	0	0.0	16374.8	422.8	0.000	0.001	0.657	17.362	229692	21.6	9.211	260	183.8	313.6	0.7	1.242	1299	100	400m.my8032_rel_lto.cy10a4g_gcp_c2s60
q100.1
q100.1: range queries with 100 insert/s per client
Performance metrics for all DBMS, not just the ones listed above. Some are normalized by throughput, others are not. Legend for results is here.
ips	qps	rps	rmbps	wps	wmbps	rpq	rkbpq	wpi	wkbpi	csps	cpups	cspq	cpupq	dbgb1	dbgb2	rss	maxop	p50	p99	tag
1976	7736	172	5.0	4384.1	140.3	0.022	0.661	2.219	72.737	259474	39.9	33.541	1547	184.9	314.7	0.3	0.075	400	192	400m.my5651_rel.cy10a4g_gcp_c2s60
1976	23306	121	4.5	10365.4	241.6	0.005	0.198	5.246	125.228	252028	31.9	10.814	411	186.5	316.3	0.5	0.159	1279	256	400m.my5740_rel_lto.cy10a4g_gcp_c2s60
1977	27495	126	4.5	12711.3	263.9	0.005	0.168	6.430	136.702	297151	38.5	10.808	420	187.6	317.4	0.7	0.205	1438	224	400m.my8022_rel_lto.cy10a4g_gcp_c2s60
1977	27342	124	4.5	12513.5	258.9	0.005	0.167	6.330	134.116	300158	39.1	10.978	429	187.1	316.9	0.7	0.239	1438	192	400m.my8028_rel_lto.cy10a4g_gcp_c2s60
1977	27646	130	4.5	12236.4	256.1	0.005	0.168	6.190	132.644	295028	40.8	10.671	443	186.9	316.7	0.7	0.210	1454	208	400m.my8031_rel_lto.cy10a4g_gcp_c2s60
1977	26507	118	4.5	12446.3	260.1	0.004	0.172	6.296	134.713	294453	39.7	11.108	449	186.7	316.5	0.7	0.200	1390	192	400m.my8032_rel_lto.cy10a4g_gcp_c2s60
q500.1
q500.1: range queries with 500 insert/s per client
Performance metrics for all DBMS, not just the ones listed above. Some are normalized by throughput, others are not. Legend for results is here.
ips	qps	rps	rmbps	wps	wmbps	rpq	rkbpq	wpi	wkbpi	csps	cpups	cspq	cpupq	dbgb1	dbgb2	rss	maxop	p50	p99	tag
5725	4883	190	1.7	6767.6	225.0	0.039	0.362	1.182	40.243	279508	37.2	57.239	2285	194.2	324.0	0.3	0.096	240	208	400m.my5651_rel.cy10a4g_gcp_c2s60
9885	8415	128	1.8	14672.4	373.4	0.015	0.213	1.484	38.678	219381	20.9	26.071	745	195.9	325.7	0.5	0.137	416	288	400m.my5740_rel_lto.cy10a4g_gcp_c2s60
9885	7242	160	2.1	18582.2	367.3	0.022	0.297	1.880	38.049	382152	23.7	52.770	982	197.0	326.8	0.7	0.185	352	256	400m.my8022_rel_lto.cy10a4g_gcp_c2s60
9885	6440	207	2.7	18060.9	359.1	0.032	0.434	1.827	37.197	363619	23.3	56.463	1085	196.6	326.4	0.7	0.273	320	224	400m.my8028_rel_lto.cy10a4g_gcp_c2s60
9885	6518	233	3.0	18093.0	362.5	0.036	0.474	1.830	37.558	363443	24.5	55.758	1128	196.3	326.1	0.7	0.269	320	224	400m.my8031_rel_lto.cy10a4g_gcp_c2s60
9885	6407	175	2.5	17790.0	359.0	0.027	0.402	1.800	37.196	359334	24.5	56.087	1147	196.2	326.0	0.7	0.267	320	224	400m.my8032_rel_lto.cy10a4g_gcp_c2s60
q1000.1
q1000.1: range queries with 1000 insert/s per client
Performance metrics for all DBMS, not just the ones listed above. Some are normalized by throughput, others are not. Legend for results is here.
ips	qps	rps	rmbps	wps	wmbps	rpq	rkbpq	wpi	wkbpi	csps	cpups	cspq	cpupq	dbgb1	dbgb2	rss	maxop	p50	p99	tag
6006	5259	132	1.0	5772.5	202.7	0.025	0.200	0.961	34.566	295568	39.6	56.203	2259	206.0	335.8	0.2	0.090	256	208	400m.my5651_rel.cy10a4g_gcp_c2s60
16461	4544	164	2.4	14853.7	422.5	0.036	0.540	0.902	26.286	235686	22.3	51.862	1472	207.8	337.7	0.5	0.169	224	160	400m.my5740_rel_lto.cy10a4g_gcp_c2s60
14303	3673	207	2.8	17827.9	376.2	0.056	0.782	1.246	26.935	421395	23.7	114.718	1936	209.1	338.9	0.7	0.248	176	128	400m.my8022_rel_lto.cy10a4g_gcp_c2s60
12636	4613	183	2.7	16363.3	355.8	0.040	0.597	1.295	28.830	353855	23.7	76.712	1541	208.7	338.5	0.7	0.364	224	144	400m.my8028_rel_lto.cy10a4g_gcp_c2s60
12614	4662	211	2.9	16413.0	360.0	0.045	0.631	1.301	29.225	350666	25.1	75.213	1615	208.4	338.2	0.7	0.355	240	144	400m.my8031_rel_lto.cy10a4g_gcp_c2s60
12592	4568	187	2.7	16228.7	357.2	0.041	0.615	1.289	29.052	348287	24.9	76.245	1635	208.2	338.0	0.7	0.394	224	144	400m.my8032_rel_lto.cy10a4g_gcp_c2s60
l.i0
- l.i0: load without secondary indexes
- Legend for results is here.
- Each entry lists the percentage of responses that fit in that bucket (slower than max time for previous bucket, faster than min time for next bucket).
Insert response time histogram
256us	1ms	4ms	16ms	64ms	256ms	1s	4s	16s	gt	max	tag
0.000	0.535	1.155	97.644	0.630	0.036	0.000	0.000	0.000	0.000	0.247	my5651_rel.cy10a4g_gcp_c2s60
0.000	0.459	0.993	98.341	0.171	0.036	0.000	0.000	0.000	0.000	0.254	my5740_rel_lto.cy10a4g_gcp_c2s60
0.000	0.293	0.800	98.856	0.012	0.039	nonzero	0.000	0.000	0.000	0.259	my8022_rel_lto.cy10a4g_gcp_c2s60
0.000	0.333	0.979	98.619	0.032	0.036	0.000	0.000	0.000	0.000	0.244	my8028_rel_lto.cy10a4g_gcp_c2s60
0.000	0.303	0.687	98.934	0.039	0.036	nonzero	0.000	0.000	0.000	0.262	my8031_rel_lto.cy10a4g_gcp_c2s60
0.000	0.266	0.605	99.054	0.039	0.036	0.000	0.000	0.000	0.000	0.231	my8032_rel_lto.cy10a4g_gcp_c2s60
l.x
- l.x: create secondary indexes
- Legend for results is here.
- Each entry lists the percentage of responses that fit in that bucket (slower than max time for previous bucket, faster than min time for next bucket).
TODO - determine whether there is data for create index response time
l.i1
- l.i1: continue load after secondary indexes created
- Legend for results is here.
- Each entry lists the percentage of responses that fit in that bucket (slower than max time for previous bucket, faster than min time for next bucket).
Insert response time histogram
256us	1ms	4ms	16ms	64ms	256ms	1s	4s	16s	gt	max	tag
0.000	0.000	0.266	27.973	61.278	10.318	0.165	nonzero	0.000	0.000	1.003	my5651_rel.cy10a4g_gcp_c2s60
0.000	0.000	0.669	53.393	36.062	9.716	0.159	0.000	0.000	0.000	0.973	my5740_rel_lto.cy10a4g_gcp_c2s60
0.000	0.000	0.794	28.167	56.874	13.890	0.275	nonzero	0.000	0.000	1.128	my8022_rel_lto.cy10a4g_gcp_c2s60
0.000	0.000	0.436	29.707	53.880	15.496	0.479	0.001	0.000	0.000	1.203	my8028_rel_lto.cy10a4g_gcp_c2s60
0.000	0.000	0.232	29.912	53.774	15.574	0.507	0.001	0.000	0.000	1.297	my8031_rel_lto.cy10a4g_gcp_c2s60
0.000	0.000	0.205	28.511	54.723	16.063	0.497	0.001	0.000	0.000	1.242	my8032_rel_lto.cy10a4g_gcp_c2s60
q100.1
- q100.1: range queries with 100 insert/s per client
- Legend for results is here.
- Each entry lists the percentage of responses that fit in that bucket (slower than max time for previous bucket, faster than min time for next bucket).
Query response time histogram
256us	1ms	4ms	16ms	64ms	256ms	1s	4s	16s	gt	max	tag
24.885	22.473	29.767	22.253	0.622	nonzero	0.000	0.000	0.000	0.000	0.075	my5651_rel.cy10a4g_gcp_c2s60
36.472	54.639	4.891	3.340	0.655	0.003	0.000	0.000	0.000	0.000	0.159	my5740_rel_lto.cy10a4g_gcp_c2s60
34.435	55.873	6.285	3.210	0.197	0.001	0.000	0.000	0.000	0.000	0.205	my8022_rel_lto.cy10a4g_gcp_c2s60
33.286	57.028	6.351	3.136	0.197	0.002	0.000	0.000	0.000	0.000	0.239	my8028_rel_lto.cy10a4g_gcp_c2s60
32.308	58.027	6.550	2.950	0.164	0.001	0.000	0.000	0.000	0.000	0.210	my8031_rel_lto.cy10a4g_gcp_c2s60
32.045	57.710	6.806	3.250	0.188	0.001	0.000	0.000	0.000	0.000	0.200	my8032_rel_lto.cy10a4g_gcp_c2s60
Insert response time histogram
256us	1ms	4ms	16ms	64ms	256ms	1s	4s	16s	gt	max	tag
0.000	0.000	0.001	0.051	10.435	81.289	8.224	0.000	0.000	0.000	0.382	my5651_rel.cy10a4g_gcp_c2s60
0.000	0.000	0.000	2.847	68.458	28.647	0.047	0.000	0.000	0.000	0.334	my5740_rel_lto.cy10a4g_gcp_c2s60
0.000	0.000	0.000	15.315	74.165	10.463	0.057	0.000	0.000	0.000	0.332	my8022_rel_lto.cy10a4g_gcp_c2s60
0.000	0.000	0.000	32.968	58.508	8.107	0.417	0.000	0.000	0.000	0.914	my8028_rel_lto.cy10a4g_gcp_c2s60
0.000	0.000	0.000	32.892	59.718	7.054	0.336	0.000	0.000	0.000	0.712	my8031_rel_lto.cy10a4g_gcp_c2s60
0.000	0.000	0.001	28.915	62.910	7.739	0.435	0.000	0.000	0.000	0.588	my8032_rel_lto.cy10a4g_gcp_c2s60
q500.1
- q500.1: range queries with 500 insert/s per client
- Legend for results is here.
- Each entry lists the percentage of responses that fit in that bucket (slower than max time for previous bucket, faster than min time for next bucket).
Query response time histogram
256us	1ms	4ms	16ms	64ms	256ms	1s	4s	16s	gt	max	tag
17.461	14.674	32.162	32.532	3.171	nonzero	0.000	0.000	0.000	0.000	0.096	my5651_rel.cy10a4g_gcp_c2s60
35.702	36.741	11.190	13.247	3.108	0.012	0.000	0.000	0.000	0.000	0.137	my5740_rel_lto.cy10a4g_gcp_c2s60
32.909	31.711	11.064	21.733	2.580	0.003	0.000	0.000	0.000	0.000	0.185	my8022_rel_lto.cy10a4g_gcp_c2s60
31.412	29.900	12.497	22.831	3.333	0.027	nonzero	0.000	0.000	0.000	0.273	my8028_rel_lto.cy10a4g_gcp_c2s60
29.326	32.132	12.706	22.604	3.206	0.025	nonzero	0.000	0.000	0.000	0.269	my8031_rel_lto.cy10a4g_gcp_c2s60
29.236	32.122	12.393	22.877	3.347	0.025	nonzero	0.000	0.000	0.000	0.267	my8032_rel_lto.cy10a4g_gcp_c2s60
Insert response time histogram
256us	1ms	4ms	16ms	64ms	256ms	1s	4s	16s	gt	max	tag
0.000	0.000	0.007	0.181	2.356	78.494	18.963	0.000	0.000	0.000	0.507	my5651_rel.cy10a4g_gcp_c2s60
0.000	0.000	0.072	16.436	64.115	19.373	0.004	0.000	0.000	0.000	0.351	my5740_rel_lto.cy10a4g_gcp_c2s60
0.000	0.000	0.193	8.182	62.270	29.323	0.031	0.000	0.000	0.000	0.350	my8022_rel_lto.cy10a4g_gcp_c2s60
0.000	0.000	0.270	9.666	57.814	31.038	1.212	0.000	0.000	0.000	0.956	my8028_rel_lto.cy10a4g_gcp_c2s60
0.000	0.000	0.134	8.956	58.400	31.228	1.283	0.000	0.000	0.000	0.817	my8031_rel_lto.cy10a4g_gcp_c2s60
0.000	0.000	0.164	10.018	58.629	30.011	1.177	0.000	0.000	0.000	0.958	my8032_rel_lto.cy10a4g_gcp_c2s60
q1000.1
- q1000.1: range queries with 1000 insert/s per client
- Legend for results is here.
- Each entry lists the percentage of responses that fit in that bucket (slower than max time for previous bucket, faster than min time for next bucket).
Query response time histogram
256us	1ms	4ms	16ms	64ms	256ms	1s	4s	16s	gt	max	tag
19.192	15.180	31.968	31.238	2.423	nonzero	0.000	0.000	0.000	0.000	0.090	my5651_rel.cy10a4g_gcp_c2s60
32.701	29.651	11.577	18.265	7.539	0.266	0.000	0.000	0.000	0.000	0.169	my5740_rel_lto.cy10a4g_gcp_c2s60
28.780	21.149	9.625	31.236	9.065	0.145	0.000	0.000	0.000	0.000	0.248	my8022_rel_lto.cy10a4g_gcp_c2s60
28.902	26.661	13.584	24.445	6.168	0.240	nonzero	0.000	0.000	0.000	0.364	my8028_rel_lto.cy10a4g_gcp_c2s60
26.173	29.249	13.929	24.388	6.032	0.229	nonzero	0.000	0.000	0.000	0.355	my8031_rel_lto.cy10a4g_gcp_c2s60
26.278	29.185	13.480	24.582	6.231	0.244	nonzero	0.000	0.000	0.000	0.394	my8032_rel_lto.cy10a4g_gcp_c2s60
Insert response time histogram
256us	1ms	4ms	16ms	64ms	256ms	1s	4s	16s	gt	max	tag
0.000	0.000	0.003	0.063	7.632	75.226	17.076	0.000	0.000	0.000	0.548	my5651_rel.cy10a4g_gcp_c2s60
0.000	0.000	0.475	9.549	50.912	38.996	0.068	0.000	0.000	0.000	0.392	my5740_rel_lto.cy10a4g_gcp_c2s60
0.000	0.000	0.366	5.542	48.964	44.733	0.395	0.000	0.000	0.000	0.571	my8022_rel_lto.cy10a4g_gcp_c2s60
0.000	0.000	0.235	5.871	47.967	43.305	2.620	0.002	0.000	0.000	1.287	my8028_rel_lto.cy10a4g_gcp_c2s60
0.000	0.000	0.112	5.304	48.386	43.551	2.644	0.003	0.000	0.000	1.162	my8031_rel_lto.cy10a4g_gcp_c2s60
0.000	0.000	0.124	5.392	48.177	43.716	2.590	0.001	0.000	0.000	1.370	my8032_rel_lto.cy10a4g_gcp_c2s60