Introduction
This is a report for the insert benchmark with 400M docs and 20 client(s). It is generated by scripts (bash, awk, sed) and Tufte might not be impressed. An overview of the insert benchmark is here and a short update is here. Below, by DBMS, I mean DBMS+version.config. An example is my8020.c10b40 where my means MySQL, 8020 is version 8.0.20 and c10b40 is the name for the configuration file.
This is a report for the insert benchmark with 400M docs and 20 client(s). It is generated by scripts (bash, awk, sed) and Tufte might not be impressed. An overview of the insert benchmark is here and a short update is here. Below, by DBMS, I mean DBMS+version.config. An example is my8020.c10b40 where my means MySQL, 8020 is version 8.0.20 and c10b40 is the name for the configuration file.The test server is c2-standard-60 from GCP with 30 cores, hyperthreads disabled, 240G RAM and 3T of NVMe (XFS with RAID0 over 8 devices). The benchmark was run with 20 clients and there were 1 or 2 connections per client (1 for queries, 1 for inserts). It uses 20 tables with a client per table. It loads 20M rows per table without secondary indexes, creates secondary indexes, loads another 20M rows per table then does 3 read+write tests for one hour each that do queries as fast as possible with 100, 500 and then 1000 writes/second/client concurrent with the queries. The database is cached by the OS but not by InnoDB. Clients and the DBMS share one server. The per-database configs are in the per-database subdirectories here.
The tested DBMS are:
- my5651_rel.cy10a_gcp_c2s60 - MySQL 5.6.51, the cy10a_gcp_c2s60 config and the build used CMAKE_BUILD_TYPE=Release
- my5740_rel_lto.cy10a_gcp_c2s60 - MySQL 5.7.40, the cy10a_gcp_c2s60 config and the build used CMAKE_BUILD_TYPE=Release -flto
- my8022_rel_lto.cy10a_gcp_c2s60 - MySQL 8.0.22, the cy10a_gcp_c2s60 config and the build used CMAKE_BUILD_TYPE=Release -flto
- my8028_rel_lto.cy10a_gcp_c2s60 - MySQL 8.0.28, the cy10a_gcp_c2s60 config and the build used CMAKE_BUILD_TYPE=Release -flto
- my8031_rel_lto.cy10a_gcp_c2s60 - MySQL 8.0.31, the cy10a_gcp_c2s60 config and the build used CMAKE_BUILD_TYPE=Release -flto
- my8032_rel_lto.cy10a_gcp_c2s60 - MySQL 8.0.32, the cy10a_gcp_c2s60 config and the build used CMAKE_BUILD_TYPE=Release -flto
Contents
- Summary
- l.i0: load without secondary indexes
- l.x: create secondary indexes
- l.i1: continue load after secondary indexes created
- q100.1: range queries with 100 insert/s per client
- q500.1: range queries with 500 insert/s per client
- q1000.1: range queries with 1000 insert/s per client
Summary
The numbers are inserts/s for l.i0 and l.i1, indexed docs (or rows) /s for l.x and queries/s for q*.2. The values are the average rate over the entire test for inserts (IPS) and queries (QPS). The range of values for IPS and QPS is split into 3 parts: bottom 25%, middle 50%, top 25%. Values in the bottom 25% have a red background, values in the top 25% have a green background and values in the middle have no color. A gray background is used for values that can be ignored because the DBMS did not sustain the target insert rate. Red backgrounds are not used when the minimum value is within 80% of the max value.
| dbms | l.i0 | l.x | l.i1 | q100.1 | q500.1 | q1000.1 |
|---|---|---|---|---|---|---|
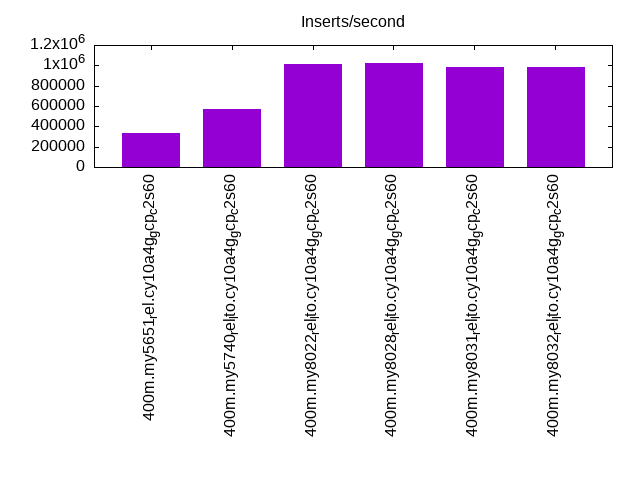
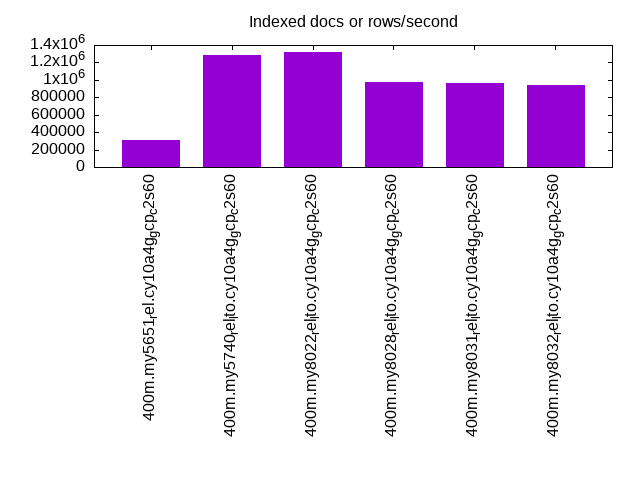
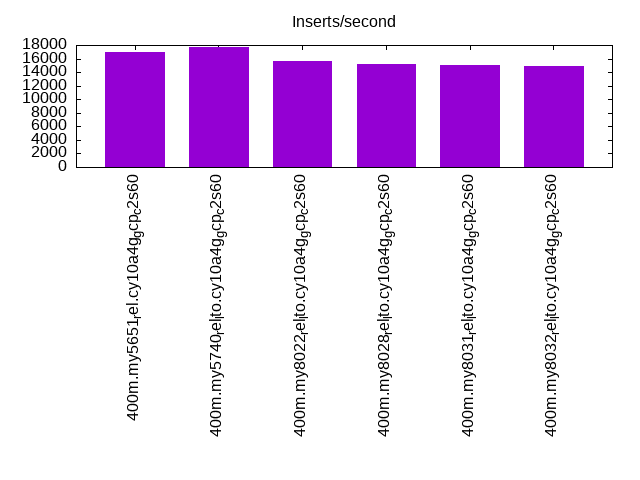
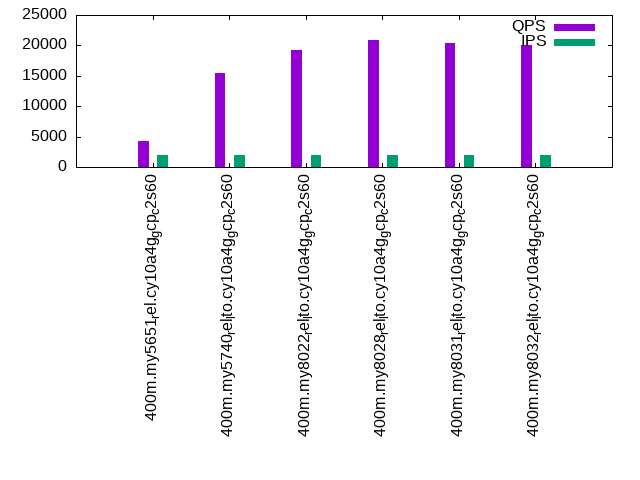
| 400m.my5651_rel.cy10a4g_gcp_c2s60 | 338696 | 310155 | 16946 | 4199 | 1421 | 1195 |
| 400m.my5740_rel_lto.cy10a4g_gcp_c2s60 | 568182 | 1290645 | 17736 | 15538 | 2203 | 1627 |
| 400m.my8022_rel_lto.cy10a4g_gcp_c2s60 | 1010101 | 1324834 | 15660 | 19230 | 1650 | 1156 |
| 400m.my8028_rel_lto.cy10a4g_gcp_c2s60 | 1025641 | 973479 | 15142 | 20837 | 1697 | 1378 |
| 400m.my8031_rel_lto.cy10a4g_gcp_c2s60 | 985222 | 966425 | 15093 | 20454 | 1707 | 1319 |
| 400m.my8032_rel_lto.cy10a4g_gcp_c2s60 | 985222 | 945863 | 14932 | 20102 | 1695 | 1289 |
This table has relative throughput, throughput for the DBMS relative to the DBMS in the first line, using the absolute throughput from the previous table.
| dbms | l.i0 | l.x | l.i1 | q100.1 | q500.1 | q1000.1 |
|---|---|---|---|---|---|---|
| 400m.my5651_rel.cy10a4g_gcp_c2s60 | 1.00 | 1.00 | 1.00 | 1.00 | 1.00 | 1.00 |
| 400m.my5740_rel_lto.cy10a4g_gcp_c2s60 | 1.68 | 4.16 | 1.05 | 3.70 | 1.55 | 1.36 |
| 400m.my8022_rel_lto.cy10a4g_gcp_c2s60 | 2.98 | 4.27 | 0.92 | 4.58 | 1.16 | 0.97 |
| 400m.my8028_rel_lto.cy10a4g_gcp_c2s60 | 3.03 | 3.14 | 0.89 | 4.96 | 1.19 | 1.15 |
| 400m.my8031_rel_lto.cy10a4g_gcp_c2s60 | 2.91 | 3.12 | 0.89 | 4.87 | 1.20 | 1.10 |
| 400m.my8032_rel_lto.cy10a4g_gcp_c2s60 | 2.91 | 3.05 | 0.88 | 4.79 | 1.19 | 1.08 |
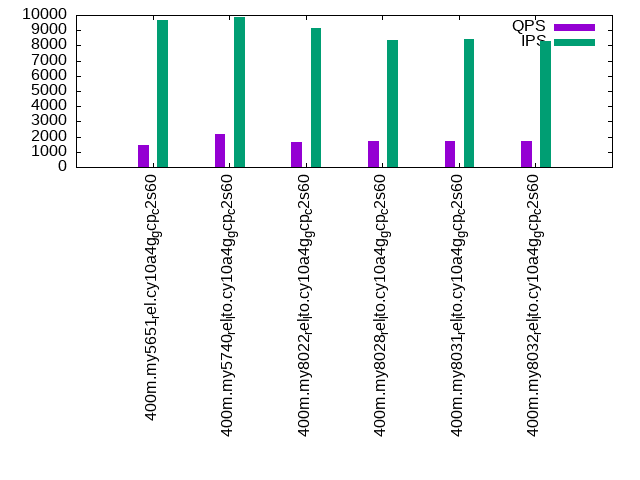
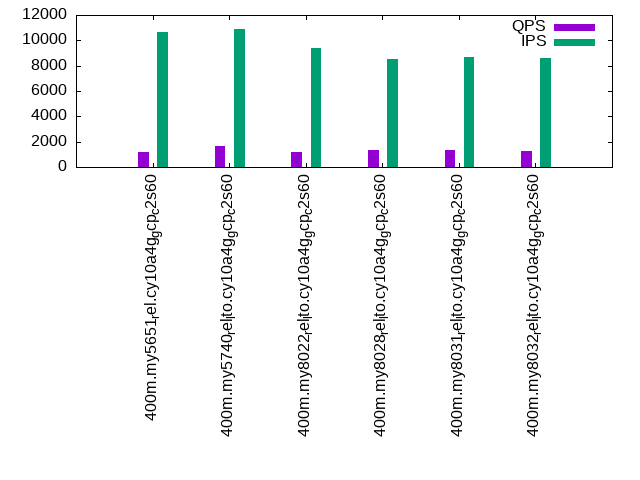
This lists the average rate of inserts/s for the tests that do inserts concurrent with queries. For such tests the query rate is listed in the table above. The read+write tests are setup so that the insert rate should match the target rate every second. Cells that are not at least 95% of the target have a red background to indicate a failure to satisfy the target.
| dbms | q100.1 | q500.1 | q1000.1 |
|---|---|---|---|
| my5651_rel.cy10a4g_gcp_c2s60 | 1976 | 9646 | 10635 |
| my5740_rel_lto.cy10a4g_gcp_c2s60 | 1976 | 9874 | 10902 |
| my8022_rel_lto.cy10a4g_gcp_c2s60 | 1978 | 9114 | 9404 |
| my8028_rel_lto.cy10a4g_gcp_c2s60 | 1977 | 8388 | 8565 |
| my8031_rel_lto.cy10a4g_gcp_c2s60 | 1977 | 8439 | 8662 |
| my8032_rel_lto.cy10a4g_gcp_c2s60 | 1977 | 8306 | 8610 |
| target | 2000 | 10000 | 20000 |
l.i0
l.i0: load without secondary indexes. Graphs for performance per 1-second interval are here.
Average throughput:
Insert response time histogram: each cell has the percentage of responses that take <= the time in the header and max is the max response time in seconds. For the max column values in the top 25% of the range have a red background and in the bottom 25% of the range have a green background. The red background is not used when the min value is within 80% of the max value.
| dbms | 256us | 1ms | 4ms | 16ms | 64ms | 256ms | 1s | 4s | 16s | gt | max |
|---|---|---|---|---|---|---|---|---|---|---|---|
| my5651_rel.cy10a4g_gcp_c2s60 | 0.753 | 8.410 | 90.348 | 0.452 | 0.036 | 0.238 | |||||
| my5740_rel_lto.cy10a4g_gcp_c2s60 | 1.121 | 95.734 | 3.035 | 0.074 | 0.036 | nonzero | 0.260 | ||||
| my8022_rel_lto.cy10a4g_gcp_c2s60 | 0.867 | 98.648 | 0.441 | 0.008 | 0.036 | 0.248 | |||||
| my8028_rel_lto.cy10a4g_gcp_c2s60 | 1.379 | 98.059 | 0.481 | 0.045 | 0.031 | 0.005 | 0.313 | ||||
| my8031_rel_lto.cy10a4g_gcp_c2s60 | 0.639 | 98.738 | 0.541 | 0.047 | 0.034 | 0.003 | 0.288 | ||||
| my8032_rel_lto.cy10a4g_gcp_c2s60 | 0.424 | 98.923 | 0.574 | 0.043 | 0.036 | 0.001 | 0.270 |
Performance metrics for the DBMS listed above. Some are normalized by throughput, others are not. Legend for results is here.
ips	qps	rps	rmbps	wps	wmbps	rpq	rkbpq	wpi	wkbpi	csps	cpups	cspq	cpupq	dbgb1	dbgb2	rss	maxop	p50	p99	tag
338696	0	1200	4.7	321.9	87.5	0.004	0.014	0.001	0.265	137479	54.7	0.406	48	26.5	155.0	0.3	0.238	14384	11288	400m.my5651_rel.cy10a4g_gcp_c2s60
568182	0	0	0.0	704.8	150.2	0.000	0.000	0.001	0.271	72121	67.9	0.127	36	26.5	155.0	0.5	0.260	29178	22575	400m.my5740_rel_lto.cy10a4g_gcp_c2s60
1010101	0	0	0.0	2675.0	275.6	0.000	0.000	0.003	0.279	217517	66.3	0.215	20	26.4	155.0	0.7	0.248	54540	40656	400m.my8022_rel_lto.cy10a4g_gcp_c2s60
1025641	0	0	0.0	2650.1	279.4	0.000	0.000	0.003	0.279	225417	65.4	0.220	19	26.4	155.0	0.7	0.313	57636	38358	400m.my8028_rel_lto.cy10a4g_gcp_c2s60
985222	0	0	0.0	2525.5	269.3	0.000	0.000	0.003	0.280	219555	65.7	0.223	20	26.4	155.0	0.7	0.288	53861	37559	400m.my8031_rel_lto.cy10a4g_gcp_c2s60
985222	0	0	0.0	2510.1	266.8	0.000	0.000	0.003	0.277	220331	66.4	0.224	20	26.4	155.0	0.7	0.270	52063	37572	400m.my8032_rel_lto.cy10a4g_gcp_c2s60
l.x
l.x: create secondary indexes.
Average throughput:
Performance metrics for the DBMS listed above. Some are normalized by throughput, others are not. Legend for results is here.
ips	qps	rps	rmbps	wps	wmbps	rpq	rkbpq	wpi	wkbpi	csps	cpups	cspq	cpupq	dbgb1	dbgb2	rss	maxop	p50	p99	tag
310155	0	0	0.0	4784.9	368.5	0.000	0.000	0.015	1.217	77799	57.7	0.251	56	54.3	182.8	0.3	0.011	NA	NA	400m.my5651_rel.cy10a4g_gcp_c2s60
1290645	0	0	0.0	5191.1	1026.8	0.000	0.000	0.004	0.815	74739	21.4	0.058	5	59.0	187.5	0.6	0.022	NA	NA	400m.my5740_rel_lto.cy10a4g_gcp_c2s60
1324834	0	0	0.0	11225.9	1084.5	0.000	0.000	0.008	0.838	123436	24.0	0.093	5	58.8	187.4	0.8	0.009	NA	NA	400m.my8022_rel_lto.cy10a4g_gcp_c2s60
973479	0	4880	337.7	18148.7	929.9	0.005	0.355	0.019	0.978	137147	30.9	0.141	10	58.8	187.4	0.7	0.025	NA	NA	400m.my8028_rel_lto.cy10a4g_gcp_c2s60
966425	0	4823	333.5	18018.0	921.4	0.005	0.353	0.019	0.976	139103	35.3	0.144	11	58.8	187.4	0.7	0.016	NA	NA	400m.my8031_rel_lto.cy10a4g_gcp_c2s60
945863	0	4764	329.6	17816.1	907.8	0.005	0.357	0.019	0.983	140985	35.2	0.149	11	58.8	187.4	0.7	0.015	NA	NA	400m.my8032_rel_lto.cy10a4g_gcp_c2s60
l.i1
l.i1: continue load after secondary indexes created. Graphs for performance per 1-second interval are here.
Average throughput:
Insert response time histogram: each cell has the percentage of responses that take <= the time in the header and max is the max response time in seconds. For the max column values in the top 25% of the range have a red background and in the bottom 25% of the range have a green background. The red background is not used when the min value is within 80% of the max value.
| dbms | 256us | 1ms | 4ms | 16ms | 64ms | 256ms | 1s | 4s | 16s | gt | max |
|---|---|---|---|---|---|---|---|---|---|---|---|
| my5651_rel.cy10a4g_gcp_c2s60 | 0.989 | 4.611 | 61.219 | 32.833 | 0.346 | 0.002 | 1.211 | ||||
| my5740_rel_lto.cy10a4g_gcp_c2s60 | 2.286 | 17.376 | 50.905 | 28.151 | 1.280 | 0.002 | 1.196 | ||||
| my8022_rel_lto.cy10a4g_gcp_c2s60 | 1.347 | 10.888 | 53.497 | 32.333 | 1.935 | nonzero | 1.297 | ||||
| my8028_rel_lto.cy10a4g_gcp_c2s60 | 1.086 | 11.414 | 53.686 | 31.131 | 2.683 | nonzero | 1.160 | ||||
| my8031_rel_lto.cy10a4g_gcp_c2s60 | 0.696 | 10.464 | 54.933 | 31.289 | 2.617 | nonzero | 1.209 | ||||
| my8032_rel_lto.cy10a4g_gcp_c2s60 | 0.893 | 11.418 | 53.635 | 31.221 | 2.833 | nonzero | 1.178 |
Performance metrics for the DBMS listed above. Some are normalized by throughput, others are not. Legend for results is here.
ips	qps	rps	rmbps	wps	wmbps	rpq	rkbpq	wpi	wkbpi	csps	cpups	cspq	cpupq	dbgb1	dbgb2	rss	maxop	p50	p99	tag
16946	0	121	0.5	14136.4	416.1	0.007	0.030	0.834	25.144	175596	15.5	10.362	274	155.9	285.7	0.3	1.211	899	150	400m.my5651_rel.cy10a4g_gcp_c2s60
17736	0	1	0.0	13313.2	419.5	0.000	0.002	0.751	24.222	175643	14.4	9.903	244	155.8	285.7	0.5	1.196	899	150	400m.my5740_rel_lto.cy10a4g_gcp_c2s60
15660	0	0	0.0	18029.8	411.7	0.000	0.001	1.151	26.923	407662	15.2	26.032	291	155.4	285.3	0.7	1.297	750	150	400m.my8022_rel_lto.cy10a4g_gcp_c2s60
15142	0	2	0.1	17109.1	398.2	0.000	0.009	1.130	26.932	272273	14.4	17.982	285	155.4	285.2	0.7	1.160	749	200	400m.my8028_rel_lto.cy10a4g_gcp_c2s60
15093	0	2	0.1	17199.1	405.2	0.000	0.007	1.140	27.492	275486	15.7	18.253	312	155.4	285.2	0.7	1.209	749	200	400m.my8031_rel_lto.cy10a4g_gcp_c2s60
14932	0	1	0.1	16918.1	397.2	0.000	0.006	1.133	27.240	270220	15.1	18.097	303	155.3	285.2	0.7	1.178	749	200	400m.my8032_rel_lto.cy10a4g_gcp_c2s60
q100.1
q100.1: range queries with 100 insert/s per client. Graphs for performance per 1-second interval are here.
Average throughput:
Query response time histogram: each cell has the percentage of responses that take <= the time in the header and max is the max response time in seconds. For max values in the top 25% of the range have a red background and in the bottom 25% of the range have a green background. The red background is not used when the min value is within 80% of the max value.
| dbms | 256us | 1ms | 4ms | 16ms | 64ms | 256ms | 1s | 4s | 16s | gt | max |
|---|---|---|---|---|---|---|---|---|---|---|---|
| my5651_rel.cy10a4g_gcp_c2s60 | 5.229 | 14.062 | 32.424 | 46.562 | 1.720 | 0.003 | 0.108 | ||||
| my5740_rel_lto.cy10a4g_gcp_c2s60 | 11.245 | 71.101 | 9.489 | 7.560 | 0.599 | 0.005 | nonzero | 0.388 | |||
| my8022_rel_lto.cy10a4g_gcp_c2s60 | 13.207 | 68.266 | 12.720 | 5.565 | 0.240 | 0.003 | nonzero | 0.288 | |||
| my8028_rel_lto.cy10a4g_gcp_c2s60 | 13.463 | 70.388 | 11.341 | 4.587 | 0.213 | 0.008 | nonzero | 0.672 | |||
| my8031_rel_lto.cy10a4g_gcp_c2s60 | 10.780 | 72.642 | 11.835 | 4.514 | 0.220 | 0.009 | nonzero | 0.748 | |||
| my8032_rel_lto.cy10a4g_gcp_c2s60 | 10.544 | 72.698 | 11.865 | 4.660 | 0.224 | 0.008 | nonzero | 0.595 |
Insert response time histogram: each cell has the percentage of responses that take <= the time in the header and max is the max response time in seconds. For max values in the top 25% of the range have a red background and in the bottom 25% of the range have a green background. The red background is not used when the min value is within 80% of the max value.
| dbms | 256us | 1ms | 4ms | 16ms | 64ms | 256ms | 1s | 4s | 16s | gt | max |
|---|---|---|---|---|---|---|---|---|---|---|---|
| my5651_rel.cy10a4g_gcp_c2s60 | 0.004 | 0.203 | 22.944 | 72.131 | 4.718 | 0.631 | |||||
| my5740_rel_lto.cy10a4g_gcp_c2s60 | 0.018 | 2.803 | 76.528 | 20.493 | 0.158 | 0.683 | |||||
| my8022_rel_lto.cy10a4g_gcp_c2s60 | 0.035 | 18.889 | 60.156 | 20.576 | 0.344 | 0.927 | |||||
| my8028_rel_lto.cy10a4g_gcp_c2s60 | 0.447 | 27.940 | 54.314 | 15.953 | 1.321 | 0.025 | 1.840 | ||||
| my8031_rel_lto.cy10a4g_gcp_c2s60 | 0.224 | 27.593 | 54.632 | 15.950 | 1.561 | 0.040 | 1.743 | ||||
| my8032_rel_lto.cy10a4g_gcp_c2s60 | 0.328 | 30.540 | 51.946 | 15.669 | 1.494 | 0.022 | 1.527 |
Performance metrics for the DBMS listed above. Some are normalized by throughput, others are not. Legend for results is here.
ips	qps	rps	rmbps	wps	wmbps	rpq	rkbpq	wpi	wkbpi	csps	cpups	cspq	cpupq	dbgb1	dbgb2	rss	maxop	p50	p99	tag
1976	4199	142	2.5	5957.1	183.5	0.034	0.620	3.015	95.092	229336	32.4	54.613	2315	158.3	288.1	0.3	0.108	224	160	400m.my5651_rel.cy10a4g_gcp_c2s60
1976	15538	125	2.6	10887.9	234.9	0.008	0.172	5.511	121.751	245951	28.8	15.829	556	158.3	288.2	0.5	0.388	799	128	400m.my5740_rel_lto.cy10a4g_gcp_c2s60
1978	19230	101	2.0	11917.0	246.9	0.005	0.104	6.025	127.811	267966	29.0	13.935	452	157.9	287.7	0.7	0.288	1135	96	400m.my8022_rel_lto.cy10a4g_gcp_c2s60
1977	20837	98	1.7	11014.1	231.4	0.005	0.082	5.571	119.838	253821	30.8	12.181	443	157.9	287.7	0.7	0.672	1231	96	400m.my8028_rel_lto.cy10a4g_gcp_c2s60
1977	20454	62	1.2	11063.7	234.2	0.003	0.062	5.596	121.319	251401	31.8	12.291	466	157.9	287.7	0.7	0.748	1215	96	400m.my8031_rel_lto.cy10a4g_gcp_c2s60
1977	20102	76	1.4	10833.3	230.1	0.004	0.072	5.480	119.168	247207	31.5	12.297	470	157.9	287.7	0.7	0.595	1199	80	400m.my8032_rel_lto.cy10a4g_gcp_c2s60
q500.1
q500.1: range queries with 500 insert/s per client. Graphs for performance per 1-second interval are here.
Average throughput:
Query response time histogram: each cell has the percentage of responses that take <= the time in the header and max is the max response time in seconds. For max values in the top 25% of the range have a red background and in the bottom 25% of the range have a green background. The red background is not used when the min value is within 80% of the max value.
| dbms | 256us | 1ms | 4ms | 16ms | 64ms | 256ms | 1s | 4s | 16s | gt | max |
|---|---|---|---|---|---|---|---|---|---|---|---|
| my5651_rel.cy10a4g_gcp_c2s60 | 3.580 | 6.601 | 13.725 | 44.441 | 30.791 | 0.861 | 0.200 | ||||
| my5740_rel_lto.cy10a4g_gcp_c2s60 | 7.492 | 31.999 | 9.711 | 32.665 | 17.170 | 0.963 | nonzero | 0.271 | |||
| my8022_rel_lto.cy10a4g_gcp_c2s60 | 7.069 | 12.684 | 9.956 | 44.809 | 24.584 | 0.895 | 0.003 | 0.488 | |||
| my8028_rel_lto.cy10a4g_gcp_c2s60 | 8.687 | 13.905 | 11.304 | 43.823 | 20.859 | 1.397 | 0.025 | nonzero | 1.230 | ||
| my8031_rel_lto.cy10a4g_gcp_c2s60 | 5.903 | 14.954 | 11.847 | 44.949 | 21.038 | 1.284 | 0.025 | nonzero | 1.096 | ||
| my8032_rel_lto.cy10a4g_gcp_c2s60 | 8.517 | 14.544 | 11.167 | 43.318 | 21.059 | 1.370 | 0.024 | 0.778 |
Insert response time histogram: each cell has the percentage of responses that take <= the time in the header and max is the max response time in seconds. For max values in the top 25% of the range have a red background and in the bottom 25% of the range have a green background. The red background is not used when the min value is within 80% of the max value.
| dbms | 256us | 1ms | 4ms | 16ms | 64ms | 256ms | 1s | 4s | 16s | gt | max |
|---|---|---|---|---|---|---|---|---|---|---|---|
| my5651_rel.cy10a4g_gcp_c2s60 | 0.562 | 2.886 | 31.957 | 64.240 | 0.355 | 0.429 | |||||
| my5740_rel_lto.cy10a4g_gcp_c2s60 | 0.720 | 4.602 | 45.506 | 48.341 | 0.832 | 0.618 | |||||
| my8022_rel_lto.cy10a4g_gcp_c2s60 | 0.193 | 2.524 | 38.638 | 54.574 | 4.072 | 0.851 | |||||
| my8028_rel_lto.cy10a4g_gcp_c2s60 | 0.202 | 2.454 | 37.083 | 52.396 | 7.844 | 0.021 | 1.458 | ||||
| my8031_rel_lto.cy10a4g_gcp_c2s60 | 0.129 | 2.139 | 36.653 | 53.373 | 7.685 | 0.020 | 1.759 | ||||
| my8032_rel_lto.cy10a4g_gcp_c2s60 | 0.178 | 2.169 | 36.096 | 53.595 | 7.934 | 0.027 | 1.673 |
Performance metrics for the DBMS listed above. Some are normalized by throughput, others are not. Legend for results is here.
ips	qps	rps	rmbps	wps	wmbps	rpq	rkbpq	wpi	wkbpi	csps	cpups	cspq	cpupq	dbgb1	dbgb2	rss	maxop	p50	p99	tag
9646	1421	264	2.5	14505.4	344.6	0.186	1.797	1.504	36.577	291911	20.6	205.426	4349	166.3	296.1	0.3	0.200	64	48	400m.my5651_rel.cy10a4g_gcp_c2s60
9874	2203	145	2.7	15563.7	389.6	0.066	1.272	1.576	40.404	256266	17.1	116.342	2329	166.2	296.1	0.5	0.271	96	64	400m.my5740_rel_lto.cy10a4g_gcp_c2s60
9114	1650	158	2.8	19011.2	359.0	0.096	1.738	2.086	40.338	544350	18.2	329.989	3310	165.7	295.5	0.7	0.488	64	48	400m.my8022_rel_lto.cy10a4g_gcp_c2s60
8388	1697	257	4.2	17455.1	339.2	0.152	2.552	2.081	41.410	355605	16.9	209.500	2987	165.7	295.5	0.7	1.230	64	48	400m.my8028_rel_lto.cy10a4g_gcp_c2s60
8439	1707	190	3.4	17519.2	344.0	0.111	2.061	2.076	41.744	359983	18.3	210.923	3217	165.7	295.5	0.7	1.096	64	48	400m.my8031_rel_lto.cy10a4g_gcp_c2s60
8306	1695	231	4.0	17250.2	338.4	0.136	2.410	2.077	41.713	351478	17.8	207.349	3150	165.7	295.5	0.7	0.778	64	48	400m.my8032_rel_lto.cy10a4g_gcp_c2s60
q1000.1
q1000.1: range queries with 1000 insert/s per client. Graphs for performance per 1-second interval are here.
Average throughput:
Query response time histogram: each cell has the percentage of responses that take <= the time in the header and max is the max response time in seconds. For max values in the top 25% of the range have a red background and in the bottom 25% of the range have a green background. The red background is not used when the min value is within 80% of the max value.
| dbms | 256us | 1ms | 4ms | 16ms | 64ms | 256ms | 1s | 4s | 16s | gt | max |
|---|---|---|---|---|---|---|---|---|---|---|---|
| my5651_rel.cy10a4g_gcp_c2s60 | 2.941 | 4.781 | 10.600 | 41.756 | 38.507 | 1.415 | 0.223 | ||||
| my5740_rel_lto.cy10a4g_gcp_c2s60 | 13.689 | 22.561 | 10.121 | 30.599 | 20.524 | 2.443 | 0.064 | 0.767 | |||
| my8022_rel_lto.cy10a4g_gcp_c2s60 | 9.092 | 5.763 | 7.760 | 43.826 | 30.622 | 2.664 | 0.274 | nonzero | 1.026 | ||
| my8028_rel_lto.cy10a4g_gcp_c2s60 | 15.454 | 8.913 | 10.853 | 41.629 | 20.384 | 2.359 | 0.406 | nonzero | 1.103 | ||
| my8031_rel_lto.cy10a4g_gcp_c2s60 | 8.428 | 10.230 | 11.912 | 44.826 | 21.746 | 2.443 | 0.414 | nonzero | 1.275 | ||
| my8032_rel_lto.cy10a4g_gcp_c2s60 | 7.893 | 10.121 | 11.686 | 45.024 | 22.308 | 2.534 | 0.435 | nonzero | 1.393 |
Insert response time histogram: each cell has the percentage of responses that take <= the time in the header and max is the max response time in seconds. For max values in the top 25% of the range have a red background and in the bottom 25% of the range have a green background. The red background is not used when the min value is within 80% of the max value.
| dbms | 256us | 1ms | 4ms | 16ms | 64ms | 256ms | 1s | 4s | 16s | gt | max |
|---|---|---|---|---|---|---|---|---|---|---|---|
| my5651_rel.cy10a4g_gcp_c2s60 | 0.704 | 2.535 | 26.032 | 70.102 | 0.627 | 0.495 | |||||
| my5740_rel_lto.cy10a4g_gcp_c2s60 | 2.118 | 8.110 | 41.004 | 44.496 | 4.271 | nonzero | 1.064 | ||||
| my8022_rel_lto.cy10a4g_gcp_c2s60 | 0.943 | 6.151 | 40.657 | 43.577 | 8.662 | 0.009 | 1.650 | ||||
| my8028_rel_lto.cy10a4g_gcp_c2s60 | 0.882 | 7.443 | 43.460 | 35.901 | 12.254 | 0.059 | 1.785 | ||||
| my8031_rel_lto.cy10a4g_gcp_c2s60 | 0.549 | 6.723 | 43.697 | 36.970 | 12.005 | 0.057 | 1.935 | ||||
| my8032_rel_lto.cy10a4g_gcp_c2s60 | 0.562 | 6.779 | 43.436 | 36.894 | 12.274 | 0.055 | 2.102 |
Performance metrics for the DBMS listed above. Some are normalized by throughput, others are not. Legend for results is here.
ips	qps	rps	rmbps	wps	wmbps	rpq	rkbpq	wpi	wkbpi	csps	cpups	cspq	cpupq	dbgb1	dbgb2	rss	maxop	p50	p99	tag
10635	1195	278	2.5	14375.2	354.3	0.233	2.145	1.352	34.118	305545	21.2	255.729	5323	174.9	304.8	0.3	0.223	64	48	400m.my5651_rel.cy10a4g_gcp_c2s60
10902	1627	212	4.4	14613.8	395.0	0.130	2.789	1.340	37.101	251999	17.1	154.857	3152	174.9	304.8	0.5	0.767	80	32	400m.my5740_rel_lto.cy10a4g_gcp_c2s60
9404	1156	204	4.0	17334.7	350.2	0.177	3.537	1.843	38.131	592639	17.7	512.619	4593	174.4	304.2	0.7	1.026	48	16	400m.my8022_rel_lto.cy10a4g_gcp_c2s60
8565	1378	288	6.1	15774.0	329.1	0.209	4.551	1.842	39.345	323777	15.7	235.012	3419	174.4	304.2	0.7	1.103	64	16	400m.my8028_rel_lto.cy10a4g_gcp_c2s60
8662	1319	286	6.1	15882.7	334.9	0.217	4.769	1.834	39.594	329607	17.1	249.854	3889	174.4	304.2	0.7	1.275	64	16	400m.my8031_rel_lto.cy10a4g_gcp_c2s60
8610	1289	297	6.4	15773.7	331.2	0.230	5.047	1.832	39.392	324809	16.8	251.985	3910	174.4	304.2	0.7	1.393	64	16	400m.my8032_rel_lto.cy10a4g_gcp_c2s60
l.i0
l.i0: load without secondary indexes
Performance metrics for all DBMS, not just the ones listed above. Some are normalized by throughput, others are not. Legend for results is here.
ips	qps	rps	rmbps	wps	wmbps	rpq	rkbpq	wpi	wkbpi	csps	cpups	cspq	cpupq	dbgb1	dbgb2	rss	maxop	p50	p99	tag
338696	0	1200	4.7	321.9	87.5	0.004	0.014	0.001	0.265	137479	54.7	0.406	48	26.5	155.0	0.3	0.238	14384	11288	400m.my5651_rel.cy10a4g_gcp_c2s60
568182	0	0	0.0	704.8	150.2	0.000	0.000	0.001	0.271	72121	67.9	0.127	36	26.5	155.0	0.5	0.260	29178	22575	400m.my5740_rel_lto.cy10a4g_gcp_c2s60
1010101	0	0	0.0	2675.0	275.6	0.000	0.000	0.003	0.279	217517	66.3	0.215	20	26.4	155.0	0.7	0.248	54540	40656	400m.my8022_rel_lto.cy10a4g_gcp_c2s60
1025641	0	0	0.0	2650.1	279.4	0.000	0.000	0.003	0.279	225417	65.4	0.220	19	26.4	155.0	0.7	0.313	57636	38358	400m.my8028_rel_lto.cy10a4g_gcp_c2s60
985222	0	0	0.0	2525.5	269.3	0.000	0.000	0.003	0.280	219555	65.7	0.223	20	26.4	155.0	0.7	0.288	53861	37559	400m.my8031_rel_lto.cy10a4g_gcp_c2s60
985222	0	0	0.0	2510.1	266.8	0.000	0.000	0.003	0.277	220331	66.4	0.224	20	26.4	155.0	0.7	0.270	52063	37572	400m.my8032_rel_lto.cy10a4g_gcp_c2s60
l.x
l.x: create secondary indexes
Performance metrics for all DBMS, not just the ones listed above. Some are normalized by throughput, others are not. Legend for results is here.
ips	qps	rps	rmbps	wps	wmbps	rpq	rkbpq	wpi	wkbpi	csps	cpups	cspq	cpupq	dbgb1	dbgb2	rss	maxop	p50	p99	tag
310155	0	0	0.0	4784.9	368.5	0.000	0.000	0.015	1.217	77799	57.7	0.251	56	54.3	182.8	0.3	0.011	NA	NA	400m.my5651_rel.cy10a4g_gcp_c2s60
1290645	0	0	0.0	5191.1	1026.8	0.000	0.000	0.004	0.815	74739	21.4	0.058	5	59.0	187.5	0.6	0.022	NA	NA	400m.my5740_rel_lto.cy10a4g_gcp_c2s60
1324834	0	0	0.0	11225.9	1084.5	0.000	0.000	0.008	0.838	123436	24.0	0.093	5	58.8	187.4	0.8	0.009	NA	NA	400m.my8022_rel_lto.cy10a4g_gcp_c2s60
973479	0	4880	337.7	18148.7	929.9	0.005	0.355	0.019	0.978	137147	30.9	0.141	10	58.8	187.4	0.7	0.025	NA	NA	400m.my8028_rel_lto.cy10a4g_gcp_c2s60
966425	0	4823	333.5	18018.0	921.4	0.005	0.353	0.019	0.976	139103	35.3	0.144	11	58.8	187.4	0.7	0.016	NA	NA	400m.my8031_rel_lto.cy10a4g_gcp_c2s60
945863	0	4764	329.6	17816.1	907.8	0.005	0.357	0.019	0.983	140985	35.2	0.149	11	58.8	187.4	0.7	0.015	NA	NA	400m.my8032_rel_lto.cy10a4g_gcp_c2s60
l.i1
l.i1: continue load after secondary indexes created
Performance metrics for all DBMS, not just the ones listed above. Some are normalized by throughput, others are not. Legend for results is here.
ips	qps	rps	rmbps	wps	wmbps	rpq	rkbpq	wpi	wkbpi	csps	cpups	cspq	cpupq	dbgb1	dbgb2	rss	maxop	p50	p99	tag
16946	0	121	0.5	14136.4	416.1	0.007	0.030	0.834	25.144	175596	15.5	10.362	274	155.9	285.7	0.3	1.211	899	150	400m.my5651_rel.cy10a4g_gcp_c2s60
17736	0	1	0.0	13313.2	419.5	0.000	0.002	0.751	24.222	175643	14.4	9.903	244	155.8	285.7	0.5	1.196	899	150	400m.my5740_rel_lto.cy10a4g_gcp_c2s60
15660	0	0	0.0	18029.8	411.7	0.000	0.001	1.151	26.923	407662	15.2	26.032	291	155.4	285.3	0.7	1.297	750	150	400m.my8022_rel_lto.cy10a4g_gcp_c2s60
15142	0	2	0.1	17109.1	398.2	0.000	0.009	1.130	26.932	272273	14.4	17.982	285	155.4	285.2	0.7	1.160	749	200	400m.my8028_rel_lto.cy10a4g_gcp_c2s60
15093	0	2	0.1	17199.1	405.2	0.000	0.007	1.140	27.492	275486	15.7	18.253	312	155.4	285.2	0.7	1.209	749	200	400m.my8031_rel_lto.cy10a4g_gcp_c2s60
14932	0	1	0.1	16918.1	397.2	0.000	0.006	1.133	27.240	270220	15.1	18.097	303	155.3	285.2	0.7	1.178	749	200	400m.my8032_rel_lto.cy10a4g_gcp_c2s60
q100.1
q100.1: range queries with 100 insert/s per client
Performance metrics for all DBMS, not just the ones listed above. Some are normalized by throughput, others are not. Legend for results is here.
ips	qps	rps	rmbps	wps	wmbps	rpq	rkbpq	wpi	wkbpi	csps	cpups	cspq	cpupq	dbgb1	dbgb2	rss	maxop	p50	p99	tag
1976	4199	142	2.5	5957.1	183.5	0.034	0.620	3.015	95.092	229336	32.4	54.613	2315	158.3	288.1	0.3	0.108	224	160	400m.my5651_rel.cy10a4g_gcp_c2s60
1976	15538	125	2.6	10887.9	234.9	0.008	0.172	5.511	121.751	245951	28.8	15.829	556	158.3	288.2	0.5	0.388	799	128	400m.my5740_rel_lto.cy10a4g_gcp_c2s60
1978	19230	101	2.0	11917.0	246.9	0.005	0.104	6.025	127.811	267966	29.0	13.935	452	157.9	287.7	0.7	0.288	1135	96	400m.my8022_rel_lto.cy10a4g_gcp_c2s60
1977	20837	98	1.7	11014.1	231.4	0.005	0.082	5.571	119.838	253821	30.8	12.181	443	157.9	287.7	0.7	0.672	1231	96	400m.my8028_rel_lto.cy10a4g_gcp_c2s60
1977	20454	62	1.2	11063.7	234.2	0.003	0.062	5.596	121.319	251401	31.8	12.291	466	157.9	287.7	0.7	0.748	1215	96	400m.my8031_rel_lto.cy10a4g_gcp_c2s60
1977	20102	76	1.4	10833.3	230.1	0.004	0.072	5.480	119.168	247207	31.5	12.297	470	157.9	287.7	0.7	0.595	1199	80	400m.my8032_rel_lto.cy10a4g_gcp_c2s60
q500.1
q500.1: range queries with 500 insert/s per client
Performance metrics for all DBMS, not just the ones listed above. Some are normalized by throughput, others are not. Legend for results is here.
ips	qps	rps	rmbps	wps	wmbps	rpq	rkbpq	wpi	wkbpi	csps	cpups	cspq	cpupq	dbgb1	dbgb2	rss	maxop	p50	p99	tag
9646	1421	264	2.5	14505.4	344.6	0.186	1.797	1.504	36.577	291911	20.6	205.426	4349	166.3	296.1	0.3	0.200	64	48	400m.my5651_rel.cy10a4g_gcp_c2s60
9874	2203	145	2.7	15563.7	389.6	0.066	1.272	1.576	40.404	256266	17.1	116.342	2329	166.2	296.1	0.5	0.271	96	64	400m.my5740_rel_lto.cy10a4g_gcp_c2s60
9114	1650	158	2.8	19011.2	359.0	0.096	1.738	2.086	40.338	544350	18.2	329.989	3310	165.7	295.5	0.7	0.488	64	48	400m.my8022_rel_lto.cy10a4g_gcp_c2s60
8388	1697	257	4.2	17455.1	339.2	0.152	2.552	2.081	41.410	355605	16.9	209.500	2987	165.7	295.5	0.7	1.230	64	48	400m.my8028_rel_lto.cy10a4g_gcp_c2s60
8439	1707	190	3.4	17519.2	344.0	0.111	2.061	2.076	41.744	359983	18.3	210.923	3217	165.7	295.5	0.7	1.096	64	48	400m.my8031_rel_lto.cy10a4g_gcp_c2s60
8306	1695	231	4.0	17250.2	338.4	0.136	2.410	2.077	41.713	351478	17.8	207.349	3150	165.7	295.5	0.7	0.778	64	48	400m.my8032_rel_lto.cy10a4g_gcp_c2s60
q1000.1
q1000.1: range queries with 1000 insert/s per client
Performance metrics for all DBMS, not just the ones listed above. Some are normalized by throughput, others are not. Legend for results is here.
ips	qps	rps	rmbps	wps	wmbps	rpq	rkbpq	wpi	wkbpi	csps	cpups	cspq	cpupq	dbgb1	dbgb2	rss	maxop	p50	p99	tag
10635	1195	278	2.5	14375.2	354.3	0.233	2.145	1.352	34.118	305545	21.2	255.729	5323	174.9	304.8	0.3	0.223	64	48	400m.my5651_rel.cy10a4g_gcp_c2s60
10902	1627	212	4.4	14613.8	395.0	0.130	2.789	1.340	37.101	251999	17.1	154.857	3152	174.9	304.8	0.5	0.767	80	32	400m.my5740_rel_lto.cy10a4g_gcp_c2s60
9404	1156	204	4.0	17334.7	350.2	0.177	3.537	1.843	38.131	592639	17.7	512.619	4593	174.4	304.2	0.7	1.026	48	16	400m.my8022_rel_lto.cy10a4g_gcp_c2s60
8565	1378	288	6.1	15774.0	329.1	0.209	4.551	1.842	39.345	323777	15.7	235.012	3419	174.4	304.2	0.7	1.103	64	16	400m.my8028_rel_lto.cy10a4g_gcp_c2s60
8662	1319	286	6.1	15882.7	334.9	0.217	4.769	1.834	39.594	329607	17.1	249.854	3889	174.4	304.2	0.7	1.275	64	16	400m.my8031_rel_lto.cy10a4g_gcp_c2s60
8610	1289	297	6.4	15773.7	331.2	0.230	5.047	1.832	39.392	324809	16.8	251.985	3910	174.4	304.2	0.7	1.393	64	16	400m.my8032_rel_lto.cy10a4g_gcp_c2s60
l.i0
- l.i0: load without secondary indexes
- Legend for results is here.
- Each entry lists the percentage of responses that fit in that bucket (slower than max time for previous bucket, faster than min time for next bucket).
Insert response time histogram
256us	1ms	4ms	16ms	64ms	256ms	1s	4s	16s	gt	max	tag
0.000	0.753	8.410	90.348	0.452	0.036	0.000	0.000	0.000	0.000	0.238	my5651_rel.cy10a4g_gcp_c2s60
0.000	1.121	95.734	3.035	0.074	0.036	nonzero	0.000	0.000	0.000	0.260	my5740_rel_lto.cy10a4g_gcp_c2s60
0.000	0.867	98.648	0.441	0.008	0.036	0.000	0.000	0.000	0.000	0.248	my8022_rel_lto.cy10a4g_gcp_c2s60
0.000	1.379	98.059	0.481	0.045	0.031	0.005	0.000	0.000	0.000	0.313	my8028_rel_lto.cy10a4g_gcp_c2s60
0.000	0.639	98.738	0.541	0.047	0.034	0.003	0.000	0.000	0.000	0.288	my8031_rel_lto.cy10a4g_gcp_c2s60
0.000	0.424	98.923	0.574	0.043	0.036	0.001	0.000	0.000	0.000	0.270	my8032_rel_lto.cy10a4g_gcp_c2s60
l.x
- l.x: create secondary indexes
- Legend for results is here.
- Each entry lists the percentage of responses that fit in that bucket (slower than max time for previous bucket, faster than min time for next bucket).
TODO - determine whether there is data for create index response time
l.i1
- l.i1: continue load after secondary indexes created
- Legend for results is here.
- Each entry lists the percentage of responses that fit in that bucket (slower than max time for previous bucket, faster than min time for next bucket).
Insert response time histogram
256us	1ms	4ms	16ms	64ms	256ms	1s	4s	16s	gt	max	tag
0.000	0.000	0.989	4.611	61.219	32.833	0.346	0.002	0.000	0.000	1.211	my5651_rel.cy10a4g_gcp_c2s60
0.000	0.000	2.286	17.376	50.905	28.151	1.280	0.002	0.000	0.000	1.196	my5740_rel_lto.cy10a4g_gcp_c2s60
0.000	0.000	1.347	10.888	53.497	32.333	1.935	nonzero	0.000	0.000	1.297	my8022_rel_lto.cy10a4g_gcp_c2s60
0.000	0.000	1.086	11.414	53.686	31.131	2.683	nonzero	0.000	0.000	1.160	my8028_rel_lto.cy10a4g_gcp_c2s60
0.000	0.000	0.696	10.464	54.933	31.289	2.617	nonzero	0.000	0.000	1.209	my8031_rel_lto.cy10a4g_gcp_c2s60
0.000	0.000	0.893	11.418	53.635	31.221	2.833	nonzero	0.000	0.000	1.178	my8032_rel_lto.cy10a4g_gcp_c2s60
q100.1
- q100.1: range queries with 100 insert/s per client
- Legend for results is here.
- Each entry lists the percentage of responses that fit in that bucket (slower than max time for previous bucket, faster than min time for next bucket).
Query response time histogram
256us	1ms	4ms	16ms	64ms	256ms	1s	4s	16s	gt	max	tag
5.229	14.062	32.424	46.562	1.720	0.003	0.000	0.000	0.000	0.000	0.108	my5651_rel.cy10a4g_gcp_c2s60
11.245	71.101	9.489	7.560	0.599	0.005	nonzero	0.000	0.000	0.000	0.388	my5740_rel_lto.cy10a4g_gcp_c2s60
13.207	68.266	12.720	5.565	0.240	0.003	nonzero	0.000	0.000	0.000	0.288	my8022_rel_lto.cy10a4g_gcp_c2s60
13.463	70.388	11.341	4.587	0.213	0.008	nonzero	0.000	0.000	0.000	0.672	my8028_rel_lto.cy10a4g_gcp_c2s60
10.780	72.642	11.835	4.514	0.220	0.009	nonzero	0.000	0.000	0.000	0.748	my8031_rel_lto.cy10a4g_gcp_c2s60
10.544	72.698	11.865	4.660	0.224	0.008	nonzero	0.000	0.000	0.000	0.595	my8032_rel_lto.cy10a4g_gcp_c2s60
Insert response time histogram
256us	1ms	4ms	16ms	64ms	256ms	1s	4s	16s	gt	max	tag
0.000	0.000	0.004	0.203	22.944	72.131	4.718	0.000	0.000	0.000	0.631	my5651_rel.cy10a4g_gcp_c2s60
0.000	0.000	0.018	2.803	76.528	20.493	0.158	0.000	0.000	0.000	0.683	my5740_rel_lto.cy10a4g_gcp_c2s60
0.000	0.000	0.035	18.889	60.156	20.576	0.344	0.000	0.000	0.000	0.927	my8022_rel_lto.cy10a4g_gcp_c2s60
0.000	0.000	0.447	27.940	54.314	15.953	1.321	0.025	0.000	0.000	1.840	my8028_rel_lto.cy10a4g_gcp_c2s60
0.000	0.000	0.224	27.593	54.632	15.950	1.561	0.040	0.000	0.000	1.743	my8031_rel_lto.cy10a4g_gcp_c2s60
0.000	0.000	0.328	30.540	51.946	15.669	1.494	0.022	0.000	0.000	1.527	my8032_rel_lto.cy10a4g_gcp_c2s60
q500.1
- q500.1: range queries with 500 insert/s per client
- Legend for results is here.
- Each entry lists the percentage of responses that fit in that bucket (slower than max time for previous bucket, faster than min time for next bucket).
Query response time histogram
256us	1ms	4ms	16ms	64ms	256ms	1s	4s	16s	gt	max	tag
3.580	6.601	13.725	44.441	30.791	0.861	0.000	0.000	0.000	0.000	0.200	my5651_rel.cy10a4g_gcp_c2s60
7.492	31.999	9.711	32.665	17.170	0.963	nonzero	0.000	0.000	0.000	0.271	my5740_rel_lto.cy10a4g_gcp_c2s60
7.069	12.684	9.956	44.809	24.584	0.895	0.003	0.000	0.000	0.000	0.488	my8022_rel_lto.cy10a4g_gcp_c2s60
8.687	13.905	11.304	43.823	20.859	1.397	0.025	nonzero	0.000	0.000	1.230	my8028_rel_lto.cy10a4g_gcp_c2s60
5.903	14.954	11.847	44.949	21.038	1.284	0.025	nonzero	0.000	0.000	1.096	my8031_rel_lto.cy10a4g_gcp_c2s60
8.517	14.544	11.167	43.318	21.059	1.370	0.024	0.000	0.000	0.000	0.778	my8032_rel_lto.cy10a4g_gcp_c2s60
Insert response time histogram
256us	1ms	4ms	16ms	64ms	256ms	1s	4s	16s	gt	max	tag
0.000	0.000	0.562	2.886	31.957	64.240	0.355	0.000	0.000	0.000	0.429	my5651_rel.cy10a4g_gcp_c2s60
0.000	0.000	0.720	4.602	45.506	48.341	0.832	0.000	0.000	0.000	0.618	my5740_rel_lto.cy10a4g_gcp_c2s60
0.000	0.000	0.193	2.524	38.638	54.574	4.072	0.000	0.000	0.000	0.851	my8022_rel_lto.cy10a4g_gcp_c2s60
0.000	0.000	0.202	2.454	37.083	52.396	7.844	0.021	0.000	0.000	1.458	my8028_rel_lto.cy10a4g_gcp_c2s60
0.000	0.000	0.129	2.139	36.653	53.373	7.685	0.020	0.000	0.000	1.759	my8031_rel_lto.cy10a4g_gcp_c2s60
0.000	0.000	0.178	2.169	36.096	53.595	7.934	0.027	0.000	0.000	1.673	my8032_rel_lto.cy10a4g_gcp_c2s60
q1000.1
- q1000.1: range queries with 1000 insert/s per client
- Legend for results is here.
- Each entry lists the percentage of responses that fit in that bucket (slower than max time for previous bucket, faster than min time for next bucket).
Query response time histogram
256us	1ms	4ms	16ms	64ms	256ms	1s	4s	16s	gt	max	tag
2.941	4.781	10.600	41.756	38.507	1.415	0.000	0.000	0.000	0.000	0.223	my5651_rel.cy10a4g_gcp_c2s60
13.689	22.561	10.121	30.599	20.524	2.443	0.064	0.000	0.000	0.000	0.767	my5740_rel_lto.cy10a4g_gcp_c2s60
9.092	5.763	7.760	43.826	30.622	2.664	0.274	nonzero	0.000	0.000	1.026	my8022_rel_lto.cy10a4g_gcp_c2s60
15.454	8.913	10.853	41.629	20.384	2.359	0.406	nonzero	0.000	0.000	1.103	my8028_rel_lto.cy10a4g_gcp_c2s60
8.428	10.230	11.912	44.826	21.746	2.443	0.414	nonzero	0.000	0.000	1.275	my8031_rel_lto.cy10a4g_gcp_c2s60
7.893	10.121	11.686	45.024	22.308	2.534	0.435	nonzero	0.000	0.000	1.393	my8032_rel_lto.cy10a4g_gcp_c2s60
Insert response time histogram
256us	1ms	4ms	16ms	64ms	256ms	1s	4s	16s	gt	max	tag
0.000	0.000	0.704	2.535	26.032	70.102	0.627	0.000	0.000	0.000	0.495	my5651_rel.cy10a4g_gcp_c2s60
0.000	0.000	2.118	8.110	41.004	44.496	4.271	nonzero	0.000	0.000	1.064	my5740_rel_lto.cy10a4g_gcp_c2s60
0.000	0.000	0.943	6.151	40.657	43.577	8.662	0.009	0.000	0.000	1.650	my8022_rel_lto.cy10a4g_gcp_c2s60
0.000	0.000	0.882	7.443	43.460	35.901	12.254	0.059	0.000	0.000	1.785	my8028_rel_lto.cy10a4g_gcp_c2s60
0.000	0.000	0.549	6.723	43.697	36.970	12.005	0.057	0.000	0.000	1.935	my8031_rel_lto.cy10a4g_gcp_c2s60
0.000	0.000	0.562	6.779	43.436	36.894	12.274	0.055	0.000	0.000	2.102	my8032_rel_lto.cy10a4g_gcp_c2s60