Introduction
This is a report for the insert benchmark with 400M docs and 20 client(s). It is generated by scripts (bash, awk, sed) and Tufte might not be impressed. An overview of the insert benchmark is here and a short update is here. Below, by DBMS, I mean DBMS+version.config. An example is my8020.c10b40 where my means MySQL, 8020 is version 8.0.20 and c10b40 is the name for the configuration file.
This is a report for the insert benchmark with 400M docs and 20 client(s). It is generated by scripts (bash, awk, sed) and Tufte might not be impressed. An overview of the insert benchmark is here and a short update is here. Below, by DBMS, I mean DBMS+version.config. An example is my8020.c10b40 where my means MySQL, 8020 is version 8.0.20 and c10b40 is the name for the configuration file.The test server is c2-standard-60 from GCP with 30 cores, hyperthreads disabled, 240G RAM and 3T of NVMe (XFS with RAID0 over 8 devices). The benchmark was run with 20 clients and there were 1 or 2 connections per client (1 for queries, 1 for inserts). It uses 1 table. It loads 400M rows per table without secondary indexes, creates secondary indexes, loads another 400M rows per table then does 3 read+write tests for one hour each that do queries as fast as possible with 100, 500 and then 1000 writes/second/client concurrent with the queries. The database is cached by the storage engine and the only IO is for writes. Clients and the DBMS share one server. The per-database configs are in the per-database subdirectories here.
The tested DBMS are:
- my8031_rel_withdbg.cy10a_gcp_c2s60 - MySQL 8.0.31, the cy10a_gcp_c2s60 config and the build used CMAKE_BUILD_TYPE=RelWithDebInfo
- my8031_rel_o2.cy10a_gcp_c2s60 - MySQL 8.0.31, the cy10a_gcp_c2s60 config and the build used CMAKE_BUILD_TYPE=Release -O2
- my8031_rel.cy10a_gcp_c2s60 - MySQL 8.0.31, the cy10a_gcp_c2s60 config and the build used CMAKE_BUILD_TYPE=Release
- my8031_rel_native.cy10a_gcp_c2s60 - MySQL 8.0.31, the cy10a_gcp_c2s60 config and the build used CMAKE_BUILD_TYPE=Release -march=native -mtune=native
- my8031_rel_o2_lto.cy10a_gcp_c2s60 - MySQL 8.0.31, the cy10a_gcp_c2s60 config and the build used CMAKE_BUILD_TYPE=Release -flto -O2
- my8031_rel_lto.cy10a_gcp_c2s60 - MySQL 8.0.31, the cy10a_gcp_c2s60 config and the build used CMAKE_BUILD_TYPE=Release -flto
- my8031_rel_native_lto.cy10a_gcp_c2s60 - MySQL 8.0.31, the cy10a_gcp_c2s60 config and the build used CMAKE_BUILD_TYPE=Release -flto -march=native -mtune=native
Contents
- Summary
- l.i0: load without secondary indexes
- l.x: create secondary indexes
- l.i1: continue load after secondary indexes created
- q100.1: range queries with 100 insert/s per client
- q500.1: range queries with 500 insert/s per client
- q1000.1: range queries with 1000 insert/s per client
Summary
The numbers are inserts/s for l.i0 and l.i1, indexed docs (or rows) /s for l.x and queries/s for q*.2. The values are the average rate over the entire test for inserts (IPS) and queries (QPS). The range of values for IPS and QPS is split into 3 parts: bottom 25%, middle 50%, top 25%. Values in the bottom 25% have a red background, values in the top 25% have a green background and values in the middle have no color. A gray background is used for values that can be ignored because the DBMS did not sustain the target insert rate. Red backgrounds are not used when the minimum value is within 80% of the max value.
| dbms | l.i0 | l.x | l.i1 | q100.1 | q500.1 | q1000.1 |
|---|---|---|---|---|---|---|
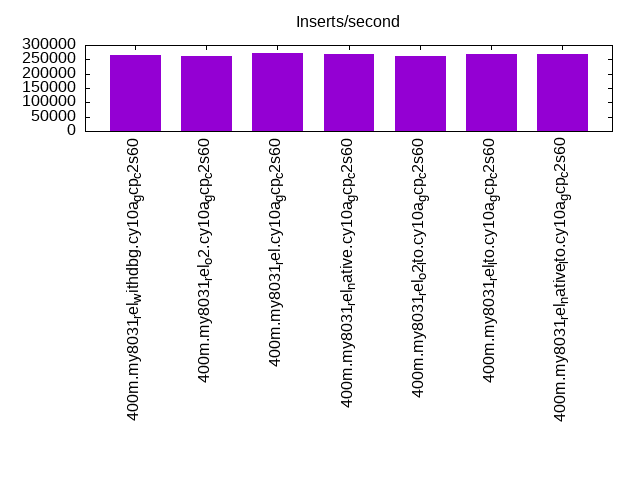
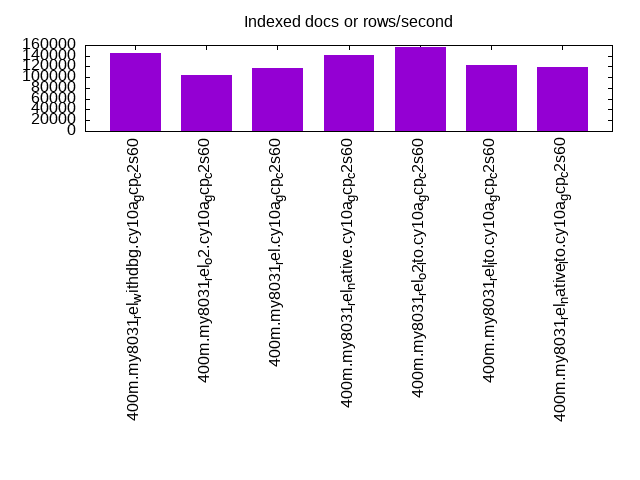
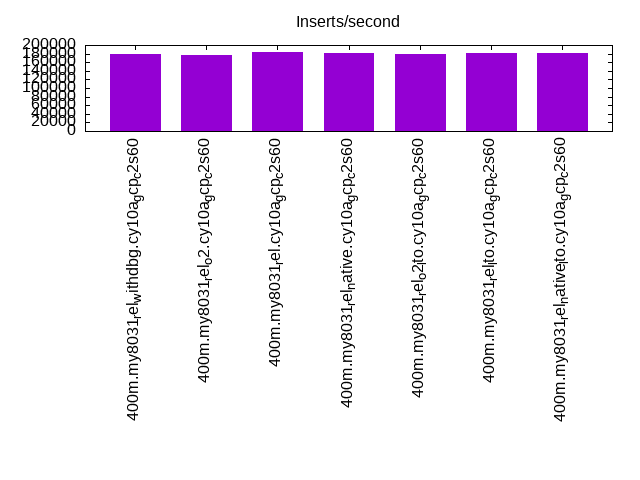
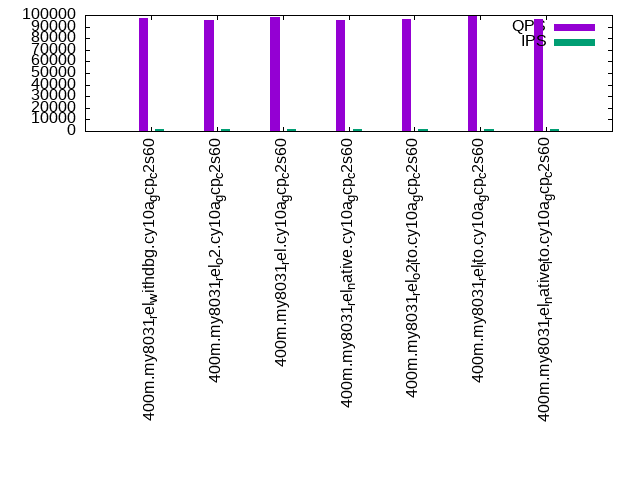
| 400m.my8031_rel_withdbg.cy10a_gcp_c2s60 | 265957 | 145862 | 178811 | 97499 | 97640 | 96477 |
| 400m.my8031_rel_o2.cy10a_gcp_c2s60 | 263158 | 103680 | 177778 | 96020 | 96621 | 95125 |
| 400m.my8031_rel.cy10a_gcp_c2s60 | 272480 | 116308 | 183993 | 97884 | 98484 | 96715 |
| 400m.my8031_rel_native.cy10a_gcp_c2s60 | 269179 | 140534 | 182149 | 95677 | 96257 | 94450 |
| 400m.my8031_rel_o2_lto.cy10a_gcp_c2s60 | 261952 | 156902 | 178731 | 96858 | 97086 | 95753 |
| 400m.my8031_rel_lto.cy10a_gcp_c2s60 | 268998 | 122317 | 180914 | 99113 | 99607 | 97977 |
| 400m.my8031_rel_native_lto.cy10a_gcp_c2s60 | 268637 | 119077 | 180505 | 96307 | 96865 | 95396 |
This table has relative throughput, throughput for the DBMS relative to the DBMS in the first line, using the absolute throughput from the previous table.
| dbms | l.i0 | l.x | l.i1 | q100.1 | q500.1 | q1000.1 |
|---|---|---|---|---|---|---|
| 400m.my8031_rel_withdbg.cy10a_gcp_c2s60 | 1.00 | 1.00 | 1.00 | 1.00 | 1.00 | 1.00 |
| 400m.my8031_rel_o2.cy10a_gcp_c2s60 | 0.99 | 0.71 | 0.99 | 0.98 | 0.99 | 0.99 |
| 400m.my8031_rel.cy10a_gcp_c2s60 | 1.02 | 0.80 | 1.03 | 1.00 | 1.01 | 1.00 |
| 400m.my8031_rel_native.cy10a_gcp_c2s60 | 1.01 | 0.96 | 1.02 | 0.98 | 0.99 | 0.98 |
| 400m.my8031_rel_o2_lto.cy10a_gcp_c2s60 | 0.98 | 1.08 | 1.00 | 0.99 | 0.99 | 0.99 |
| 400m.my8031_rel_lto.cy10a_gcp_c2s60 | 1.01 | 0.84 | 1.01 | 1.02 | 1.02 | 1.02 |
| 400m.my8031_rel_native_lto.cy10a_gcp_c2s60 | 1.01 | 0.82 | 1.01 | 0.99 | 0.99 | 0.99 |
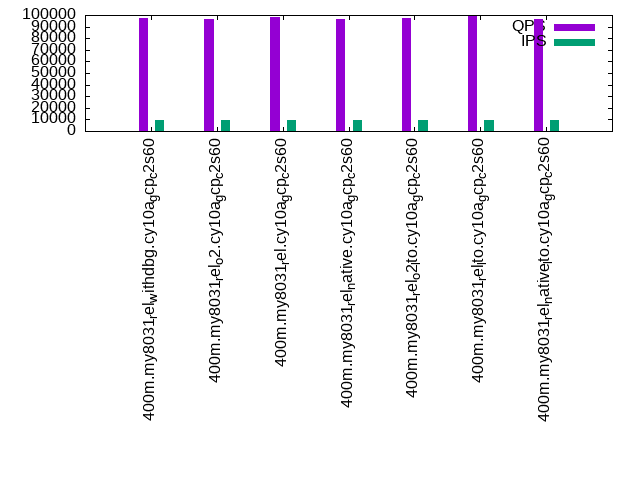
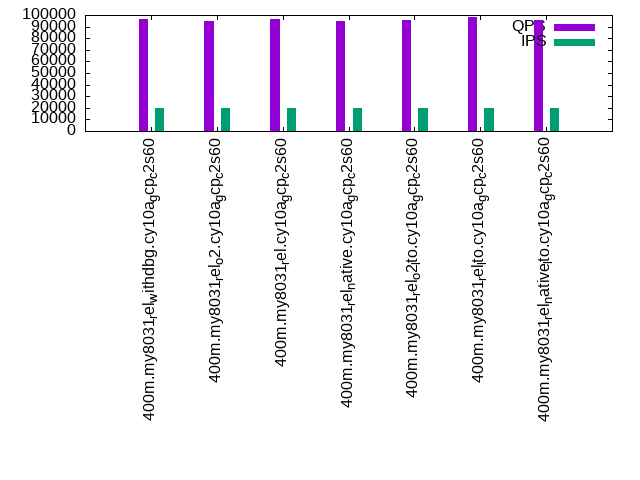
This lists the average rate of inserts/s for the tests that do inserts concurrent with queries. For such tests the query rate is listed in the table above. The read+write tests are setup so that the insert rate should match the target rate every second. Cells that are not at least 95% of the target have a red background to indicate a failure to satisfy the target.
| dbms | q100.1 | q500.1 | q1000.1 |
|---|---|---|---|
| my8031_rel_withdbg.cy10a_gcp_c2s60 | 1977 | 9890 | 19769 |
| my8031_rel_o2.cy10a_gcp_c2s60 | 1977 | 9885 | 19780 |
| my8031_rel.cy10a_gcp_c2s60 | 1977 | 9885 | 19769 |
| my8031_rel_native.cy10a_gcp_c2s60 | 1976 | 9885 | 19769 |
| my8031_rel_o2_lto.cy10a_gcp_c2s60 | 1976 | 9885 | 19769 |
| my8031_rel_lto.cy10a_gcp_c2s60 | 1976 | 9885 | 19769 |
| my8031_rel_native_lto.cy10a_gcp_c2s60 | 1977 | 9885 | 19769 |
| target | 2000 | 10000 | 20000 |
l.i0
l.i0: load without secondary indexes. Graphs for performance per 1-second interval are here.
Average throughput:
Insert response time histogram: each cell has the percentage of responses that take <= the time in the header and max is the max response time in seconds. For the max column values in the top 25% of the range have a red background and in the bottom 25% of the range have a green background. The red background is not used when the min value is within 80% of the max value.
| dbms | 256us | 1ms | 4ms | 16ms | 64ms | 256ms | 1s | 4s | 16s | gt | max |
|---|---|---|---|---|---|---|---|---|---|---|---|
| my8031_rel_withdbg.cy10a_gcp_c2s60 | 0.291 | 0.593 | 99.039 | 0.041 | 0.035 | nonzero | 0.263 | ||||
| my8031_rel_o2.cy10a_gcp_c2s60 | 0.261 | 0.541 | 99.120 | 0.042 | 0.036 | nonzero | 0.257 | ||||
| my8031_rel.cy10a_gcp_c2s60 | 0.307 | 0.637 | 98.979 | 0.040 | 0.037 | nonzero | 0.260 | ||||
| my8031_rel_native.cy10a_gcp_c2s60 | 0.275 | 0.642 | 99.016 | 0.031 | 0.037 | nonzero | 0.258 | ||||
| my8031_rel_o2_lto.cy10a_gcp_c2s60 | 0.274 | 0.583 | 99.072 | 0.036 | 0.036 | 0.249 | |||||
| my8031_rel_lto.cy10a_gcp_c2s60 | 0.294 | 0.655 | 98.972 | 0.043 | 0.037 | 0.253 | |||||
| my8031_rel_native_lto.cy10a_gcp_c2s60 | 0.298 | 0.616 | 99.013 | 0.036 | 0.037 | nonzero | 0.257 |
Performance metrics for the DBMS listed above. Some are normalized by throughput, others are not. Legend for results is here.
ips	qps	rps	rmbps	wps	wmbps	rpq	rkbpq	wpi	wkbpi	csps	cpups	cspq	cpupq	dbgb1	dbgb2	rss	maxop	p50	p99	tag
265957	0	0	0.0	621.3	94.7	0.000	0.000	0.002	0.365	245677	59.0	0.924	67	44.5	173.1	9.3	0.263	13490	10888	400m.my8031_rel_withdbg.cy10a_gcp_c2s60
263158	0	0	0.0	619.2	94.5	0.000	0.000	0.002	0.368	248425	59.0	0.944	67	44.5	173.1	9.3	0.257	13385	10694	400m.my8031_rel_o2.cy10a_gcp_c2s60
272480	0	0	0.0	633.3	95.3	0.000	0.000	0.002	0.358	247356	59.5	0.908	66	44.5	173.1	9.3	0.260	13789	11088	400m.my8031_rel.cy10a_gcp_c2s60
269179	0	0	0.0	627.0	68.6	0.000	0.000	0.002	0.261	245868	59.2	0.913	66	44.5	173.1	9.3	0.258	13685	10898	400m.my8031_rel_native.cy10a_gcp_c2s60
261952	0	0	0.0	616.4	93.8	0.000	0.000	0.002	0.367	247592	59.1	0.945	68	44.5	173.1	9.3	0.249	13285	10788	400m.my8031_rel_o2_lto.cy10a_gcp_c2s60
268998	0	0	0.0	625.6	81.7	0.000	0.000	0.002	0.311	245872	59.4	0.914	66	44.5	173.1	9.3	0.253	13685	10992	400m.my8031_rel_lto.cy10a_gcp_c2s60
268637	0	0	0.0	623.2	95.7	0.000	0.000	0.002	0.365	244298	59.4	0.909	66	44.5	173.1	9.3	0.257	13685	10892	400m.my8031_rel_native_lto.cy10a_gcp_c2s60
l.x
l.x: create secondary indexes.
Average throughput:
Performance metrics for the DBMS listed above. Some are normalized by throughput, others are not. Legend for results is here.
ips	qps	rps	rmbps	wps	wmbps	rpq	rkbpq	wpi	wkbpi	csps	cpups	cspq	cpupq	dbgb1	dbgb2	rss	maxop	p50	p99	tag
145862	0	725	50.2	3424.7	176.4	0.005	0.353	0.023	1.238	22858	9.8	0.157	20	76.9	205.5	9.3	0.005	NA	NA	400m.my8031_rel_withdbg.cy10a_gcp_c2s60
103680	0	518	35.7	2426.0	125.4	0.005	0.353	0.023	1.238	16445	10.8	0.159	31	76.9	205.5	9.3	0.005	NA	NA	400m.my8031_rel_o2.cy10a_gcp_c2s60
116308	0	581	40.0	2729.3	141.0	0.005	0.352	0.023	1.242	18547	10.7	0.159	28	76.9	205.5	9.3	0.005	NA	NA	400m.my8031_rel.cy10a_gcp_c2s60
140534	0	703	48.4	3281.3	169.7	0.005	0.352	0.023	1.236	22009	10.7	0.157	23	76.9	205.5	9.3	0.005	NA	NA	400m.my8031_rel_native.cy10a_gcp_c2s60
156902	0	785	54.0	3662.6	189.3	0.005	0.352	0.023	1.235	25061	10.5	0.160	20	76.9	205.5	9.3	0.005	NA	NA	400m.my8031_rel_o2_lto.cy10a_gcp_c2s60
122317	0	613	42.1	2861.4	148.1	0.005	0.352	0.023	1.240	19572	10.8	0.160	26	76.9	205.5	9.3	0.005	NA	NA	400m.my8031_rel_lto.cy10a_gcp_c2s60
119077	0	593	41.0	2796.4	144.0	0.005	0.352	0.023	1.239	18588	10.4	0.156	26	76.9	205.5	9.3	0.005	NA	NA	400m.my8031_rel_native_lto.cy10a_gcp_c2s60
l.i1
l.i1: continue load after secondary indexes created. Graphs for performance per 1-second interval are here.
Average throughput:
Insert response time histogram: each cell has the percentage of responses that take <= the time in the header and max is the max response time in seconds. For the max column values in the top 25% of the range have a red background and in the bottom 25% of the range have a green background. The red background is not used when the min value is within 80% of the max value.
| dbms | 256us | 1ms | 4ms | 16ms | 64ms | 256ms | 1s | 4s | 16s | gt | max |
|---|---|---|---|---|---|---|---|---|---|---|---|
| my8031_rel_withdbg.cy10a_gcp_c2s60 | 1.806 | 97.783 | 0.244 | 0.166 | 0.001 | 0.358 | |||||
| my8031_rel_o2.cy10a_gcp_c2s60 | 1.890 | 97.690 | 0.255 | 0.165 | 0.001 | 0.344 | |||||
| my8031_rel.cy10a_gcp_c2s60 | 2.888 | 96.682 | 0.275 | 0.155 | nonzero | 0.289 | |||||
| my8031_rel_native.cy10a_gcp_c2s60 | 2.313 | 97.281 | 0.251 | 0.156 | nonzero | 0.303 | |||||
| my8031_rel_o2_lto.cy10a_gcp_c2s60 | 1.667 | 97.923 | 0.245 | 0.164 | 0.001 | 0.350 | |||||
| my8031_rel_lto.cy10a_gcp_c2s60 | 2.116 | 97.483 | 0.246 | 0.154 | nonzero | 0.283 | |||||
| my8031_rel_native_lto.cy10a_gcp_c2s60 | 1.950 | 97.636 | 0.258 | 0.156 | nonzero | 0.291 |
Performance metrics for the DBMS listed above. Some are normalized by throughput, others are not. Legend for results is here.
ips	qps	rps	rmbps	wps	wmbps	rpq	rkbpq	wpi	wkbpi	csps	cpups	cspq	cpupq	dbgb1	dbgb2	rss	maxop	p50	p99	tag
178811	0	36	0.5	6321.6	280.4	0.000	0.003	0.035	1.606	224498	61.0	1.256	102	182.8	311.4	9.3	0.358	9540	350	400m.my8031_rel_withdbg.cy10a_gcp_c2s60
177778	0	13	0.2	6300.3	280.3	0.000	0.001	0.035	1.615	221891	61.1	1.248	103	182.7	311.3	9.3	0.344	9499	400	400m.my8031_rel_o2.cy10a_gcp_c2s60
183993	0	53	0.9	6418.8	287.2	0.000	0.005	0.035	1.598	225657	61.3	1.226	100	182.8	311.4	9.3	0.289	9794	400	400m.my8031_rel.cy10a_gcp_c2s60
182149	0	16	0.2	6398.4	285.3	0.000	0.001	0.035	1.604	225631	61.3	1.239	101	182.8	311.4	9.3	0.303	9689	400	400m.my8031_rel_native.cy10a_gcp_c2s60
178731	0	36	0.6	6321.9	280.7	0.000	0.003	0.035	1.608	225712	61.0	1.263	102	182.7	311.3	9.3	0.350	9540	350	400m.my8031_rel_o2_lto.cy10a_gcp_c2s60
180914	0	2	0.0	6351.7	283.8	0.000	0.000	0.035	1.607	230266	61.0	1.273	101	183.0	311.5	9.3	0.283	9598	400	400m.my8031_rel_lto.cy10a_gcp_c2s60
180505	0	4	0.1	6351.7	283.1	0.000	0.000	0.035	1.606	228065	61.2	1.263	102	182.9	311.5	9.3	0.291	9543	400	400m.my8031_rel_native_lto.cy10a_gcp_c2s60
q100.1
q100.1: range queries with 100 insert/s per client. Graphs for performance per 1-second interval are here.
Average throughput:
Query response time histogram: each cell has the percentage of responses that take <= the time in the header and max is the max response time in seconds. For max values in the top 25% of the range have a red background and in the bottom 25% of the range have a green background. The red background is not used when the min value is within 80% of the max value.
| dbms | 256us | 1ms | 4ms | 16ms | 64ms | 256ms | 1s | 4s | 16s | gt | max |
|---|---|---|---|---|---|---|---|---|---|---|---|
| my8031_rel_withdbg.cy10a_gcp_c2s60 | 94.982 | 4.982 | 0.036 | nonzero | nonzero | 0.032 | |||||
| my8031_rel_o2.cy10a_gcp_c2s60 | 94.428 | 5.534 | 0.038 | nonzero | nonzero | 0.021 | |||||
| my8031_rel.cy10a_gcp_c2s60 | 95.672 | 4.288 | 0.040 | nonzero | nonzero | 0.027 | |||||
| my8031_rel_native.cy10a_gcp_c2s60 | 94.410 | 5.552 | 0.038 | nonzero | nonzero | 0.024 | |||||
| my8031_rel_o2_lto.cy10a_gcp_c2s60 | 94.820 | 5.148 | 0.032 | nonzero | nonzero | 0.027 | |||||
| my8031_rel_lto.cy10a_gcp_c2s60 | 95.664 | 4.305 | 0.031 | nonzero | nonzero | 0.024 | |||||
| my8031_rel_native_lto.cy10a_gcp_c2s60 | 94.185 | 5.781 | 0.034 | nonzero | nonzero | 0.028 |
Insert response time histogram: each cell has the percentage of responses that take <= the time in the header and max is the max response time in seconds. For max values in the top 25% of the range have a red background and in the bottom 25% of the range have a green background. The red background is not used when the min value is within 80% of the max value.
| dbms | 256us | 1ms | 4ms | 16ms | 64ms | 256ms | 1s | 4s | 16s | gt | max |
|---|---|---|---|---|---|---|---|---|---|---|---|
| my8031_rel_withdbg.cy10a_gcp_c2s60 | 87.169 | 12.732 | 0.099 | 0.041 | |||||||
| my8031_rel_o2.cy10a_gcp_c2s60 | 80.842 | 18.943 | 0.215 | 0.028 | |||||||
| my8031_rel.cy10a_gcp_c2s60 | 82.008 | 17.850 | 0.142 | 0.030 | |||||||
| my8031_rel_native.cy10a_gcp_c2s60 | 87.625 | 12.292 | 0.083 | 0.027 | |||||||
| my8031_rel_o2_lto.cy10a_gcp_c2s60 | 87.326 | 12.611 | 0.062 | 0.029 | |||||||
| my8031_rel_lto.cy10a_gcp_c2s60 | 86.426 | 13.482 | 0.092 | 0.027 | |||||||
| my8031_rel_native_lto.cy10a_gcp_c2s60 | 87.185 | 12.743 | 0.072 | 0.029 |
Performance metrics for the DBMS listed above. Some are normalized by throughput, others are not. Legend for results is here.
ips	qps	rps	rmbps	wps	wmbps	rpq	rkbpq	wpi	wkbpi	csps	cpups	cspq	cpupq	dbgb1	dbgb2	rss	maxop	p50	p99	tag
1977	97499	160	5.7	1583.6	58.6	0.002	0.060	0.801	30.371	366375	65.8	3.758	202	185.0	313.6	9.3	0.032	4971	3728	400m.my8031_rel_withdbg.cy10a_gcp_c2s60
1977	96020	192	5.7	1574.3	58.4	0.002	0.061	0.796	30.268	361062	65.7	3.760	205	185.0	313.5	9.3	0.021	4876	3452	400m.my8031_rel_o2.cy10a_gcp_c2s60
1977	97884	194	5.7	1597.8	59.2	0.002	0.060	0.808	30.677	368094	65.8	3.760	202	185.1	313.7	9.3	0.027	4987	3167	400m.my8031_rel.cy10a_gcp_c2s60
1976	95677	159	5.5	1592.2	59.0	0.002	0.058	0.806	30.575	360432	65.6	3.767	206	185.0	313.6	9.3	0.024	4859	3452	400m.my8031_rel_native.cy10a_gcp_c2s60
1976	96858	141	5.2	1603.9	59.1	0.001	0.055	0.812	30.644	363387	65.7	3.752	203	185.0	313.5	9.3	0.027	5003	4077	400m.my8031_rel_o2_lto.cy10a_gcp_c2s60
1976	99113	152	5.2	1595.2	59.1	0.002	0.053	0.807	30.612	372230	65.8	3.756	199	185.2	313.8	9.3	0.024	5066	4411	400m.my8031_rel_lto.cy10a_gcp_c2s60
1977	96307	185	5.7	1596.9	59.1	0.002	0.061	0.808	30.592	361079	65.4	3.749	204	185.1	313.7	9.3	0.028	4941	3964	400m.my8031_rel_native_lto.cy10a_gcp_c2s60
q500.1
q500.1: range queries with 500 insert/s per client. Graphs for performance per 1-second interval are here.
Average throughput:
Query response time histogram: each cell has the percentage of responses that take <= the time in the header and max is the max response time in seconds. For max values in the top 25% of the range have a red background and in the bottom 25% of the range have a green background. The red background is not used when the min value is within 80% of the max value.
| dbms | 256us | 1ms | 4ms | 16ms | 64ms | 256ms | 1s | 4s | 16s | gt | max |
|---|---|---|---|---|---|---|---|---|---|---|---|
| my8031_rel_withdbg.cy10a_gcp_c2s60 | 95.531 | 4.431 | 0.036 | 0.002 | nonzero | 0.025 | |||||
| my8031_rel_o2.cy10a_gcp_c2s60 | 95.180 | 4.782 | 0.035 | 0.002 | nonzero | 0.027 | |||||
| my8031_rel.cy10a_gcp_c2s60 | 96.236 | 3.728 | 0.034 | 0.002 | nonzero | 0.028 | |||||
| my8031_rel_native.cy10a_gcp_c2s60 | 95.124 | 4.840 | 0.034 | 0.002 | nonzero | 0.024 | |||||
| my8031_rel_o2_lto.cy10a_gcp_c2s60 | 95.362 | 4.603 | 0.034 | 0.002 | nonzero | 0.024 | |||||
| my8031_rel_lto.cy10a_gcp_c2s60 | 96.215 | 3.750 | 0.033 | 0.002 | nonzero | 0.028 | |||||
| my8031_rel_native_lto.cy10a_gcp_c2s60 | 94.983 | 4.980 | 0.036 | 0.002 | nonzero | 0.026 |
Insert response time histogram: each cell has the percentage of responses that take <= the time in the header and max is the max response time in seconds. For max values in the top 25% of the range have a red background and in the bottom 25% of the range have a green background. The red background is not used when the min value is within 80% of the max value.
| dbms | 256us | 1ms | 4ms | 16ms | 64ms | 256ms | 1s | 4s | 16s | gt | max |
|---|---|---|---|---|---|---|---|---|---|---|---|
| my8031_rel_withdbg.cy10a_gcp_c2s60 | 25.338 | 68.954 | 5.708 | 0.050 | |||||||
| my8031_rel_o2.cy10a_gcp_c2s60 | 24.703 | 69.314 | 5.983 | nonzero | 0.070 | ||||||
| my8031_rel.cy10a_gcp_c2s60 | 26.906 | 67.861 | 5.233 | 0.050 | |||||||
| my8031_rel_native.cy10a_gcp_c2s60 | 26.924 | 67.825 | 5.251 | 0.054 | |||||||
| my8031_rel_o2_lto.cy10a_gcp_c2s60 | 26.384 | 68.334 | 5.282 | 0.062 | |||||||
| my8031_rel_lto.cy10a_gcp_c2s60 | 27.689 | 67.398 | 4.914 | 0.049 | |||||||
| my8031_rel_native_lto.cy10a_gcp_c2s60 | 26.712 | 68.032 | 5.256 | 0.047 |
Performance metrics for the DBMS listed above. Some are normalized by throughput, others are not. Legend for results is here.
ips	qps	rps	rmbps	wps	wmbps	rpq	rkbpq	wpi	wkbpi	csps	cpups	cspq	cpupq	dbgb1	dbgb2	rss	maxop	p50	p99	tag
9890	97640	6	0.1	552.8	27.6	0.000	0.001	0.056	2.858	352083	66.7	3.606	205	194.6	323.1	9.3	0.025	4876	4635	400m.my8031_rel_withdbg.cy10a_gcp_c2s60
9885	96621	6	0.1	552.5	27.4	0.000	0.001	0.056	2.843	348869	66.9	3.611	208	194.5	323.1	9.3	0.027	4859	4603	400m.my8031_rel_o2.cy10a_gcp_c2s60
9885	98484	7	0.1	539.1	27.2	0.000	0.001	0.055	2.813	355215	66.8	3.607	203	194.6	323.2	9.3	0.028	5035	4764	400m.my8031_rel.cy10a_gcp_c2s60
9885	96257	6	0.1	538.7	27.3	0.000	0.001	0.054	2.833	348544	66.7	3.621	208	194.6	323.1	9.3	0.024	4829	4573	400m.my8031_rel_native.cy10a_gcp_c2s60
9885	97086	6	0.1	544.8	27.0	0.000	0.001	0.055	2.801	349954	66.7	3.605	206	194.5	323.1	9.3	0.024	4957	4651	400m.my8031_rel_o2_lto.cy10a_gcp_c2s60
9885	99607	6	0.1	540.7	27.0	0.000	0.001	0.055	2.793	359533	66.6	3.610	201	194.7	323.3	9.3	0.028	5050	4764	400m.my8031_rel_lto.cy10a_gcp_c2s60
9885	96865	6	0.1	543.0	27.1	0.000	0.001	0.055	2.809	349930	66.5	3.613	206	194.7	323.2	9.3	0.026	4859	4605	400m.my8031_rel_native_lto.cy10a_gcp_c2s60
q1000.1
q1000.1: range queries with 1000 insert/s per client. Graphs for performance per 1-second interval are here.
Average throughput:
Query response time histogram: each cell has the percentage of responses that take <= the time in the header and max is the max response time in seconds. For max values in the top 25% of the range have a red background and in the bottom 25% of the range have a green background. The red background is not used when the min value is within 80% of the max value.
| dbms | 256us | 1ms | 4ms | 16ms | 64ms | 256ms | 1s | 4s | 16s | gt | max |
|---|---|---|---|---|---|---|---|---|---|---|---|
| my8031_rel_withdbg.cy10a_gcp_c2s60 | 95.452 | 4.500 | 0.043 | 0.005 | nonzero | 0.027 | |||||
| my8031_rel_o2.cy10a_gcp_c2s60 | 95.009 | 4.939 | 0.046 | 0.006 | nonzero | 0.028 | |||||
| my8031_rel.cy10a_gcp_c2s60 | 95.992 | 3.962 | 0.041 | 0.005 | nonzero | 0.034 | |||||
| my8031_rel_native.cy10a_gcp_c2s60 | 94.835 | 5.117 | 0.043 | 0.005 | nonzero | 0.030 | |||||
| my8031_rel_o2_lto.cy10a_gcp_c2s60 | 95.307 | 4.641 | 0.046 | 0.005 | nonzero | 0.028 | |||||
| my8031_rel_lto.cy10a_gcp_c2s60 | 96.010 | 3.943 | 0.042 | 0.005 | nonzero | 0.024 | |||||
| my8031_rel_native_lto.cy10a_gcp_c2s60 | 94.778 | 5.175 | 0.042 | 0.005 | nonzero | 0.027 |
Insert response time histogram: each cell has the percentage of responses that take <= the time in the header and max is the max response time in seconds. For max values in the top 25% of the range have a red background and in the bottom 25% of the range have a green background. The red background is not used when the min value is within 80% of the max value.
| dbms | 256us | 1ms | 4ms | 16ms | 64ms | 256ms | 1s | 4s | 16s | gt | max |
|---|---|---|---|---|---|---|---|---|---|---|---|
| my8031_rel_withdbg.cy10a_gcp_c2s60 | 36.606 | 60.274 | 3.120 | 0.056 | |||||||
| my8031_rel_o2.cy10a_gcp_c2s60 | 34.147 | 62.137 | 3.717 | 0.056 | |||||||
| my8031_rel.cy10a_gcp_c2s60 | 40.044 | 57.108 | 2.847 | nonzero | 0.069 | ||||||
| my8031_rel_native.cy10a_gcp_c2s60 | 36.877 | 60.064 | 3.059 | 0.052 | |||||||
| my8031_rel_o2_lto.cy10a_gcp_c2s60 | 34.715 | 61.610 | 3.675 | 0.060 | |||||||
| my8031_rel_lto.cy10a_gcp_c2s60 | 37.850 | 59.159 | 2.991 | 0.050 | |||||||
| my8031_rel_native_lto.cy10a_gcp_c2s60 | 38.705 | 58.456 | 2.839 | 0.060 |
Performance metrics for the DBMS listed above. Some are normalized by throughput, others are not. Legend for results is here.
ips	qps	rps	rmbps	wps	wmbps	rpq	rkbpq	wpi	wkbpi	csps	cpups	cspq	cpupq	dbgb1	dbgb2	rss	maxop	p50	p99	tag
19769	96477	10	0.2	2090.8	67.0	0.000	0.002	0.106	3.471	340378	68.9	3.528	214	205.7	334.3	9.3	0.027	4923	4589	400m.my8031_rel_withdbg.cy10a_gcp_c2s60
19780	95125	11	0.2	2086.2	66.7	0.000	0.002	0.105	3.455	336781	69.0	3.540	218	205.6	334.2	9.3	0.028	4795	4571	400m.my8031_rel_o2.cy10a_gcp_c2s60
19769	96715	10	0.1	2104.8	67.4	0.000	0.002	0.106	3.491	343437	68.9	3.551	214	205.8	334.4	9.3	0.034	4890	4653	400m.my8031_rel.cy10a_gcp_c2s60
19769	94450	10	0.2	2099.9	67.3	0.000	0.002	0.106	3.487	335633	68.7	3.554	218	205.7	334.3	9.3	0.030	4781	4555	400m.my8031_rel_native.cy10a_gcp_c2s60
19769	95753	10	0.2	2114.5	67.6	0.000	0.002	0.107	3.499	337351	68.8	3.523	216	205.6	334.2	9.3	0.028	4891	4539	400m.my8031_rel_o2_lto.cy10a_gcp_c2s60
19769	97977	10	0.2	2109.5	67.7	0.000	0.002	0.107	3.508	348536	68.8	3.557	211	205.9	334.5	9.3	0.024	5003	4719	400m.my8031_rel_lto.cy10a_gcp_c2s60
19769	95396	10	0.1	2197.3	70.3	0.000	0.002	0.111	3.640	339389	68.6	3.558	216	205.8	334.4	9.3	0.027	4859	4619	400m.my8031_rel_native_lto.cy10a_gcp_c2s60
l.i0
l.i0: load without secondary indexes
Performance metrics for all DBMS, not just the ones listed above. Some are normalized by throughput, others are not. Legend for results is here.
ips	qps	rps	rmbps	wps	wmbps	rpq	rkbpq	wpi	wkbpi	csps	cpups	cspq	cpupq	dbgb1	dbgb2	rss	maxop	p50	p99	tag
265957	0	0	0.0	621.3	94.7	0.000	0.000	0.002	0.365	245677	59.0	0.924	67	44.5	173.1	9.3	0.263	13490	10888	400m.my8031_rel_withdbg.cy10a_gcp_c2s60
263158	0	0	0.0	619.2	94.5	0.000	0.000	0.002	0.368	248425	59.0	0.944	67	44.5	173.1	9.3	0.257	13385	10694	400m.my8031_rel_o2.cy10a_gcp_c2s60
272480	0	0	0.0	633.3	95.3	0.000	0.000	0.002	0.358	247356	59.5	0.908	66	44.5	173.1	9.3	0.260	13789	11088	400m.my8031_rel.cy10a_gcp_c2s60
269179	0	0	0.0	627.0	68.6	0.000	0.000	0.002	0.261	245868	59.2	0.913	66	44.5	173.1	9.3	0.258	13685	10898	400m.my8031_rel_native.cy10a_gcp_c2s60
261952	0	0	0.0	616.4	93.8	0.000	0.000	0.002	0.367	247592	59.1	0.945	68	44.5	173.1	9.3	0.249	13285	10788	400m.my8031_rel_o2_lto.cy10a_gcp_c2s60
268998	0	0	0.0	625.6	81.7	0.000	0.000	0.002	0.311	245872	59.4	0.914	66	44.5	173.1	9.3	0.253	13685	10992	400m.my8031_rel_lto.cy10a_gcp_c2s60
268637	0	0	0.0	623.2	95.7	0.000	0.000	0.002	0.365	244298	59.4	0.909	66	44.5	173.1	9.3	0.257	13685	10892	400m.my8031_rel_native_lto.cy10a_gcp_c2s60
l.x
l.x: create secondary indexes
Performance metrics for all DBMS, not just the ones listed above. Some are normalized by throughput, others are not. Legend for results is here.
ips	qps	rps	rmbps	wps	wmbps	rpq	rkbpq	wpi	wkbpi	csps	cpups	cspq	cpupq	dbgb1	dbgb2	rss	maxop	p50	p99	tag
145862	0	725	50.2	3424.7	176.4	0.005	0.353	0.023	1.238	22858	9.8	0.157	20	76.9	205.5	9.3	0.005	NA	NA	400m.my8031_rel_withdbg.cy10a_gcp_c2s60
103680	0	518	35.7	2426.0	125.4	0.005	0.353	0.023	1.238	16445	10.8	0.159	31	76.9	205.5	9.3	0.005	NA	NA	400m.my8031_rel_o2.cy10a_gcp_c2s60
116308	0	581	40.0	2729.3	141.0	0.005	0.352	0.023	1.242	18547	10.7	0.159	28	76.9	205.5	9.3	0.005	NA	NA	400m.my8031_rel.cy10a_gcp_c2s60
140534	0	703	48.4	3281.3	169.7	0.005	0.352	0.023	1.236	22009	10.7	0.157	23	76.9	205.5	9.3	0.005	NA	NA	400m.my8031_rel_native.cy10a_gcp_c2s60
156902	0	785	54.0	3662.6	189.3	0.005	0.352	0.023	1.235	25061	10.5	0.160	20	76.9	205.5	9.3	0.005	NA	NA	400m.my8031_rel_o2_lto.cy10a_gcp_c2s60
122317	0	613	42.1	2861.4	148.1	0.005	0.352	0.023	1.240	19572	10.8	0.160	26	76.9	205.5	9.3	0.005	NA	NA	400m.my8031_rel_lto.cy10a_gcp_c2s60
119077	0	593	41.0	2796.4	144.0	0.005	0.352	0.023	1.239	18588	10.4	0.156	26	76.9	205.5	9.3	0.005	NA	NA	400m.my8031_rel_native_lto.cy10a_gcp_c2s60
l.i1
l.i1: continue load after secondary indexes created
Performance metrics for all DBMS, not just the ones listed above. Some are normalized by throughput, others are not. Legend for results is here.
ips	qps	rps	rmbps	wps	wmbps	rpq	rkbpq	wpi	wkbpi	csps	cpups	cspq	cpupq	dbgb1	dbgb2	rss	maxop	p50	p99	tag
178811	0	36	0.5	6321.6	280.4	0.000	0.003	0.035	1.606	224498	61.0	1.256	102	182.8	311.4	9.3	0.358	9540	350	400m.my8031_rel_withdbg.cy10a_gcp_c2s60
177778	0	13	0.2	6300.3	280.3	0.000	0.001	0.035	1.615	221891	61.1	1.248	103	182.7	311.3	9.3	0.344	9499	400	400m.my8031_rel_o2.cy10a_gcp_c2s60
183993	0	53	0.9	6418.8	287.2	0.000	0.005	0.035	1.598	225657	61.3	1.226	100	182.8	311.4	9.3	0.289	9794	400	400m.my8031_rel.cy10a_gcp_c2s60
182149	0	16	0.2	6398.4	285.3	0.000	0.001	0.035	1.604	225631	61.3	1.239	101	182.8	311.4	9.3	0.303	9689	400	400m.my8031_rel_native.cy10a_gcp_c2s60
178731	0	36	0.6	6321.9	280.7	0.000	0.003	0.035	1.608	225712	61.0	1.263	102	182.7	311.3	9.3	0.350	9540	350	400m.my8031_rel_o2_lto.cy10a_gcp_c2s60
180914	0	2	0.0	6351.7	283.8	0.000	0.000	0.035	1.607	230266	61.0	1.273	101	183.0	311.5	9.3	0.283	9598	400	400m.my8031_rel_lto.cy10a_gcp_c2s60
180505	0	4	0.1	6351.7	283.1	0.000	0.000	0.035	1.606	228065	61.2	1.263	102	182.9	311.5	9.3	0.291	9543	400	400m.my8031_rel_native_lto.cy10a_gcp_c2s60
q100.1
q100.1: range queries with 100 insert/s per client
Performance metrics for all DBMS, not just the ones listed above. Some are normalized by throughput, others are not. Legend for results is here.
ips	qps	rps	rmbps	wps	wmbps	rpq	rkbpq	wpi	wkbpi	csps	cpups	cspq	cpupq	dbgb1	dbgb2	rss	maxop	p50	p99	tag
1977	97499	160	5.7	1583.6	58.6	0.002	0.060	0.801	30.371	366375	65.8	3.758	202	185.0	313.6	9.3	0.032	4971	3728	400m.my8031_rel_withdbg.cy10a_gcp_c2s60
1977	96020	192	5.7	1574.3	58.4	0.002	0.061	0.796	30.268	361062	65.7	3.760	205	185.0	313.5	9.3	0.021	4876	3452	400m.my8031_rel_o2.cy10a_gcp_c2s60
1977	97884	194	5.7	1597.8	59.2	0.002	0.060	0.808	30.677	368094	65.8	3.760	202	185.1	313.7	9.3	0.027	4987	3167	400m.my8031_rel.cy10a_gcp_c2s60
1976	95677	159	5.5	1592.2	59.0	0.002	0.058	0.806	30.575	360432	65.6	3.767	206	185.0	313.6	9.3	0.024	4859	3452	400m.my8031_rel_native.cy10a_gcp_c2s60
1976	96858	141	5.2	1603.9	59.1	0.001	0.055	0.812	30.644	363387	65.7	3.752	203	185.0	313.5	9.3	0.027	5003	4077	400m.my8031_rel_o2_lto.cy10a_gcp_c2s60
1976	99113	152	5.2	1595.2	59.1	0.002	0.053	0.807	30.612	372230	65.8	3.756	199	185.2	313.8	9.3	0.024	5066	4411	400m.my8031_rel_lto.cy10a_gcp_c2s60
1977	96307	185	5.7	1596.9	59.1	0.002	0.061	0.808	30.592	361079	65.4	3.749	204	185.1	313.7	9.3	0.028	4941	3964	400m.my8031_rel_native_lto.cy10a_gcp_c2s60
q500.1
q500.1: range queries with 500 insert/s per client
Performance metrics for all DBMS, not just the ones listed above. Some are normalized by throughput, others are not. Legend for results is here.
ips	qps	rps	rmbps	wps	wmbps	rpq	rkbpq	wpi	wkbpi	csps	cpups	cspq	cpupq	dbgb1	dbgb2	rss	maxop	p50	p99	tag
9890	97640	6	0.1	552.8	27.6	0.000	0.001	0.056	2.858	352083	66.7	3.606	205	194.6	323.1	9.3	0.025	4876	4635	400m.my8031_rel_withdbg.cy10a_gcp_c2s60
9885	96621	6	0.1	552.5	27.4	0.000	0.001	0.056	2.843	348869	66.9	3.611	208	194.5	323.1	9.3	0.027	4859	4603	400m.my8031_rel_o2.cy10a_gcp_c2s60
9885	98484	7	0.1	539.1	27.2	0.000	0.001	0.055	2.813	355215	66.8	3.607	203	194.6	323.2	9.3	0.028	5035	4764	400m.my8031_rel.cy10a_gcp_c2s60
9885	96257	6	0.1	538.7	27.3	0.000	0.001	0.054	2.833	348544	66.7	3.621	208	194.6	323.1	9.3	0.024	4829	4573	400m.my8031_rel_native.cy10a_gcp_c2s60
9885	97086	6	0.1	544.8	27.0	0.000	0.001	0.055	2.801	349954	66.7	3.605	206	194.5	323.1	9.3	0.024	4957	4651	400m.my8031_rel_o2_lto.cy10a_gcp_c2s60
9885	99607	6	0.1	540.7	27.0	0.000	0.001	0.055	2.793	359533	66.6	3.610	201	194.7	323.3	9.3	0.028	5050	4764	400m.my8031_rel_lto.cy10a_gcp_c2s60
9885	96865	6	0.1	543.0	27.1	0.000	0.001	0.055	2.809	349930	66.5	3.613	206	194.7	323.2	9.3	0.026	4859	4605	400m.my8031_rel_native_lto.cy10a_gcp_c2s60
q1000.1
q1000.1: range queries with 1000 insert/s per client
Performance metrics for all DBMS, not just the ones listed above. Some are normalized by throughput, others are not. Legend for results is here.
ips	qps	rps	rmbps	wps	wmbps	rpq	rkbpq	wpi	wkbpi	csps	cpups	cspq	cpupq	dbgb1	dbgb2	rss	maxop	p50	p99	tag
19769	96477	10	0.2	2090.8	67.0	0.000	0.002	0.106	3.471	340378	68.9	3.528	214	205.7	334.3	9.3	0.027	4923	4589	400m.my8031_rel_withdbg.cy10a_gcp_c2s60
19780	95125	11	0.2	2086.2	66.7	0.000	0.002	0.105	3.455	336781	69.0	3.540	218	205.6	334.2	9.3	0.028	4795	4571	400m.my8031_rel_o2.cy10a_gcp_c2s60
19769	96715	10	0.1	2104.8	67.4	0.000	0.002	0.106	3.491	343437	68.9	3.551	214	205.8	334.4	9.3	0.034	4890	4653	400m.my8031_rel.cy10a_gcp_c2s60
19769	94450	10	0.2	2099.9	67.3	0.000	0.002	0.106	3.487	335633	68.7	3.554	218	205.7	334.3	9.3	0.030	4781	4555	400m.my8031_rel_native.cy10a_gcp_c2s60
19769	95753	10	0.2	2114.5	67.6	0.000	0.002	0.107	3.499	337351	68.8	3.523	216	205.6	334.2	9.3	0.028	4891	4539	400m.my8031_rel_o2_lto.cy10a_gcp_c2s60
19769	97977	10	0.2	2109.5	67.7	0.000	0.002	0.107	3.508	348536	68.8	3.557	211	205.9	334.5	9.3	0.024	5003	4719	400m.my8031_rel_lto.cy10a_gcp_c2s60
19769	95396	10	0.1	2197.3	70.3	0.000	0.002	0.111	3.640	339389	68.6	3.558	216	205.8	334.4	9.3	0.027	4859	4619	400m.my8031_rel_native_lto.cy10a_gcp_c2s60
l.i0
- l.i0: load without secondary indexes
- Legend for results is here.
- Each entry lists the percentage of responses that fit in that bucket (slower than max time for previous bucket, faster than min time for next bucket).
Insert response time histogram
256us	1ms	4ms	16ms	64ms	256ms	1s	4s	16s	gt	max	tag
0.000	0.291	0.593	99.039	0.041	0.035	nonzero	0.000	0.000	0.000	0.263	my8031_rel_withdbg.cy10a_gcp_c2s60
0.000	0.261	0.541	99.120	0.042	0.036	nonzero	0.000	0.000	0.000	0.257	my8031_rel_o2.cy10a_gcp_c2s60
0.000	0.307	0.637	98.979	0.040	0.037	nonzero	0.000	0.000	0.000	0.260	my8031_rel.cy10a_gcp_c2s60
0.000	0.275	0.642	99.016	0.031	0.037	nonzero	0.000	0.000	0.000	0.258	my8031_rel_native.cy10a_gcp_c2s60
0.000	0.274	0.583	99.072	0.036	0.036	0.000	0.000	0.000	0.000	0.249	my8031_rel_o2_lto.cy10a_gcp_c2s60
0.000	0.294	0.655	98.972	0.043	0.037	0.000	0.000	0.000	0.000	0.253	my8031_rel_lto.cy10a_gcp_c2s60
0.000	0.298	0.616	99.013	0.036	0.037	nonzero	0.000	0.000	0.000	0.257	my8031_rel_native_lto.cy10a_gcp_c2s60
l.x
- l.x: create secondary indexes
- Legend for results is here.
- Each entry lists the percentage of responses that fit in that bucket (slower than max time for previous bucket, faster than min time for next bucket).
TODO - determine whether there is data for create index response time
l.i1
- l.i1: continue load after secondary indexes created
- Legend for results is here.
- Each entry lists the percentage of responses that fit in that bucket (slower than max time for previous bucket, faster than min time for next bucket).
Insert response time histogram
256us	1ms	4ms	16ms	64ms	256ms	1s	4s	16s	gt	max	tag
0.000	0.000	1.806	97.783	0.244	0.166	0.001	0.000	0.000	0.000	0.358	my8031_rel_withdbg.cy10a_gcp_c2s60
0.000	0.000	1.890	97.690	0.255	0.165	0.001	0.000	0.000	0.000	0.344	my8031_rel_o2.cy10a_gcp_c2s60
0.000	0.000	2.888	96.682	0.275	0.155	nonzero	0.000	0.000	0.000	0.289	my8031_rel.cy10a_gcp_c2s60
0.000	0.000	2.313	97.281	0.251	0.156	nonzero	0.000	0.000	0.000	0.303	my8031_rel_native.cy10a_gcp_c2s60
0.000	0.000	1.667	97.923	0.245	0.164	0.001	0.000	0.000	0.000	0.350	my8031_rel_o2_lto.cy10a_gcp_c2s60
0.000	0.000	2.116	97.483	0.246	0.154	nonzero	0.000	0.000	0.000	0.283	my8031_rel_lto.cy10a_gcp_c2s60
0.000	0.000	1.950	97.636	0.258	0.156	nonzero	0.000	0.000	0.000	0.291	my8031_rel_native_lto.cy10a_gcp_c2s60
q100.1
- q100.1: range queries with 100 insert/s per client
- Legend for results is here.
- Each entry lists the percentage of responses that fit in that bucket (slower than max time for previous bucket, faster than min time for next bucket).
Query response time histogram
256us	1ms	4ms	16ms	64ms	256ms	1s	4s	16s	gt	max	tag
94.982	4.982	0.036	nonzero	nonzero	0.000	0.000	0.000	0.000	0.000	0.032	my8031_rel_withdbg.cy10a_gcp_c2s60
94.428	5.534	0.038	nonzero	nonzero	0.000	0.000	0.000	0.000	0.000	0.021	my8031_rel_o2.cy10a_gcp_c2s60
95.672	4.288	0.040	nonzero	nonzero	0.000	0.000	0.000	0.000	0.000	0.027	my8031_rel.cy10a_gcp_c2s60
94.410	5.552	0.038	nonzero	nonzero	0.000	0.000	0.000	0.000	0.000	0.024	my8031_rel_native.cy10a_gcp_c2s60
94.820	5.148	0.032	nonzero	nonzero	0.000	0.000	0.000	0.000	0.000	0.027	my8031_rel_o2_lto.cy10a_gcp_c2s60
95.664	4.305	0.031	nonzero	nonzero	0.000	0.000	0.000	0.000	0.000	0.024	my8031_rel_lto.cy10a_gcp_c2s60
94.185	5.781	0.034	nonzero	nonzero	0.000	0.000	0.000	0.000	0.000	0.028	my8031_rel_native_lto.cy10a_gcp_c2s60
Insert response time histogram
256us	1ms	4ms	16ms	64ms	256ms	1s	4s	16s	gt	max	tag
0.000	0.000	87.169	12.732	0.099	0.000	0.000	0.000	0.000	0.000	0.041	my8031_rel_withdbg.cy10a_gcp_c2s60
0.000	0.000	80.842	18.943	0.215	0.000	0.000	0.000	0.000	0.000	0.028	my8031_rel_o2.cy10a_gcp_c2s60
0.000	0.000	82.008	17.850	0.142	0.000	0.000	0.000	0.000	0.000	0.030	my8031_rel.cy10a_gcp_c2s60
0.000	0.000	87.625	12.292	0.083	0.000	0.000	0.000	0.000	0.000	0.027	my8031_rel_native.cy10a_gcp_c2s60
0.000	0.000	87.326	12.611	0.062	0.000	0.000	0.000	0.000	0.000	0.029	my8031_rel_o2_lto.cy10a_gcp_c2s60
0.000	0.000	86.426	13.482	0.092	0.000	0.000	0.000	0.000	0.000	0.027	my8031_rel_lto.cy10a_gcp_c2s60
0.000	0.000	87.185	12.743	0.072	0.000	0.000	0.000	0.000	0.000	0.029	my8031_rel_native_lto.cy10a_gcp_c2s60
q500.1
- q500.1: range queries with 500 insert/s per client
- Legend for results is here.
- Each entry lists the percentage of responses that fit in that bucket (slower than max time for previous bucket, faster than min time for next bucket).
Query response time histogram
256us	1ms	4ms	16ms	64ms	256ms	1s	4s	16s	gt	max	tag
95.531	4.431	0.036	0.002	nonzero	0.000	0.000	0.000	0.000	0.000	0.025	my8031_rel_withdbg.cy10a_gcp_c2s60
95.180	4.782	0.035	0.002	nonzero	0.000	0.000	0.000	0.000	0.000	0.027	my8031_rel_o2.cy10a_gcp_c2s60
96.236	3.728	0.034	0.002	nonzero	0.000	0.000	0.000	0.000	0.000	0.028	my8031_rel.cy10a_gcp_c2s60
95.124	4.840	0.034	0.002	nonzero	0.000	0.000	0.000	0.000	0.000	0.024	my8031_rel_native.cy10a_gcp_c2s60
95.362	4.603	0.034	0.002	nonzero	0.000	0.000	0.000	0.000	0.000	0.024	my8031_rel_o2_lto.cy10a_gcp_c2s60
96.215	3.750	0.033	0.002	nonzero	0.000	0.000	0.000	0.000	0.000	0.028	my8031_rel_lto.cy10a_gcp_c2s60
94.983	4.980	0.036	0.002	nonzero	0.000	0.000	0.000	0.000	0.000	0.026	my8031_rel_native_lto.cy10a_gcp_c2s60
Insert response time histogram
256us	1ms	4ms	16ms	64ms	256ms	1s	4s	16s	gt	max	tag
0.000	0.000	25.338	68.954	5.708	0.000	0.000	0.000	0.000	0.000	0.050	my8031_rel_withdbg.cy10a_gcp_c2s60
0.000	0.000	24.703	69.314	5.983	nonzero	0.000	0.000	0.000	0.000	0.070	my8031_rel_o2.cy10a_gcp_c2s60
0.000	0.000	26.906	67.861	5.233	0.000	0.000	0.000	0.000	0.000	0.050	my8031_rel.cy10a_gcp_c2s60
0.000	0.000	26.924	67.825	5.251	0.000	0.000	0.000	0.000	0.000	0.054	my8031_rel_native.cy10a_gcp_c2s60
0.000	0.000	26.384	68.334	5.282	0.000	0.000	0.000	0.000	0.000	0.062	my8031_rel_o2_lto.cy10a_gcp_c2s60
0.000	0.000	27.689	67.398	4.914	0.000	0.000	0.000	0.000	0.000	0.049	my8031_rel_lto.cy10a_gcp_c2s60
0.000	0.000	26.712	68.032	5.256	0.000	0.000	0.000	0.000	0.000	0.047	my8031_rel_native_lto.cy10a_gcp_c2s60
q1000.1
- q1000.1: range queries with 1000 insert/s per client
- Legend for results is here.
- Each entry lists the percentage of responses that fit in that bucket (slower than max time for previous bucket, faster than min time for next bucket).
Query response time histogram
256us	1ms	4ms	16ms	64ms	256ms	1s	4s	16s	gt	max	tag
95.452	4.500	0.043	0.005	nonzero	0.000	0.000	0.000	0.000	0.000	0.027	my8031_rel_withdbg.cy10a_gcp_c2s60
95.009	4.939	0.046	0.006	nonzero	0.000	0.000	0.000	0.000	0.000	0.028	my8031_rel_o2.cy10a_gcp_c2s60
95.992	3.962	0.041	0.005	nonzero	0.000	0.000	0.000	0.000	0.000	0.034	my8031_rel.cy10a_gcp_c2s60
94.835	5.117	0.043	0.005	nonzero	0.000	0.000	0.000	0.000	0.000	0.030	my8031_rel_native.cy10a_gcp_c2s60
95.307	4.641	0.046	0.005	nonzero	0.000	0.000	0.000	0.000	0.000	0.028	my8031_rel_o2_lto.cy10a_gcp_c2s60
96.010	3.943	0.042	0.005	nonzero	0.000	0.000	0.000	0.000	0.000	0.024	my8031_rel_lto.cy10a_gcp_c2s60
94.778	5.175	0.042	0.005	nonzero	0.000	0.000	0.000	0.000	0.000	0.027	my8031_rel_native_lto.cy10a_gcp_c2s60
Insert response time histogram
256us	1ms	4ms	16ms	64ms	256ms	1s	4s	16s	gt	max	tag
0.000	0.000	36.606	60.274	3.120	0.000	0.000	0.000	0.000	0.000	0.056	my8031_rel_withdbg.cy10a_gcp_c2s60
0.000	0.000	34.147	62.137	3.717	0.000	0.000	0.000	0.000	0.000	0.056	my8031_rel_o2.cy10a_gcp_c2s60
0.000	0.000	40.044	57.108	2.847	nonzero	0.000	0.000	0.000	0.000	0.069	my8031_rel.cy10a_gcp_c2s60
0.000	0.000	36.877	60.064	3.059	0.000	0.000	0.000	0.000	0.000	0.052	my8031_rel_native.cy10a_gcp_c2s60
0.000	0.000	34.715	61.610	3.675	0.000	0.000	0.000	0.000	0.000	0.060	my8031_rel_o2_lto.cy10a_gcp_c2s60
0.000	0.000	37.850	59.159	2.991	0.000	0.000	0.000	0.000	0.000	0.050	my8031_rel_lto.cy10a_gcp_c2s60
0.000	0.000	38.705	58.456	2.839	0.000	0.000	0.000	0.000	0.000	0.060	my8031_rel_native_lto.cy10a_gcp_c2s60