Introduction
This is a report for the insert benchmark with 400M docs and 20 client(s). It is generated by scripts (bash, awk, sed) and Tufte might not be impressed. An overview of the insert benchmark is here and a short update is here. Below, by DBMS, I mean DBMS+version.config. An example is my8020.c10b40 where my means MySQL, 8020 is version 8.0.20 and c10b40 is the name for the configuration file.
This is a report for the insert benchmark with 400M docs and 20 client(s). It is generated by scripts (bash, awk, sed) and Tufte might not be impressed. An overview of the insert benchmark is here and a short update is here. Below, by DBMS, I mean DBMS+version.config. An example is my8020.c10b40 where my means MySQL, 8020 is version 8.0.20 and c10b40 is the name for the configuration file.The test server is c2-standard-60 from GCP with 30 cores, hyperthreads disabled, 240G RAM and 3T of NVMe (XFS with RAID0 over 8 devices). The benchmark was run with 20 clients and there were 1 or 2 connections per client (1 for queries, 1 for inserts). It uses 20 tables with a client per table. It loads 20M rows per table without secondary indexes, creates secondary indexes, loads another 20M rows per table then does 3 read+write tests for one hour each that do queries as fast as possible with 100, 500 and then 1000 writes/second/client concurrent with the queries. The database is cached by the storage engine and the only IO is for writes. Clients and the DBMS share one server. The per-database configs are in the per-database subdirectories here.
The tested DBMS are:
- my8031_rel_withdbg.cy10a_gcp_c2s60 - MySQL 8.0.31, the cy10a_gcp_c2s60 config and the build used CMAKE_BUILD_TYPE=RelWithDebInfo
- my8031_rel_o2.cy10a_gcp_c2s60 - MySQL 8.0.31, the cy10a_gcp_c2s60 config and the build used CMAKE_BUILD_TYPE=Release -O2
- my8031_rel.cy10a_gcp_c2s60 - MySQL 8.0.31, the cy10a_gcp_c2s60 config and the build used CMAKE_BUILD_TYPE=Release
- my8031_rel_native.cy10a_gcp_c2s60 - MySQL 8.0.31, the cy10a_gcp_c2s60 config and the build used CMAKE_BUILD_TYPE=Release -march=native -mtune=native
- my8031_rel_o2_lto.cy10a_gcp_c2s60 - MySQL 8.0.31, the cy10a_gcp_c2s60 config and the build used CMAKE_BUILD_TYPE=Release -flto -O2
- my8031_rel_lto.cy10a_gcp_c2s60 - MySQL 8.0.31, the cy10a_gcp_c2s60 config and the build used CMAKE_BUILD_TYPE=Release -flto
- my8031_rel_native_lto.cy10a_gcp_c2s60 - MySQL 8.0.31, the cy10a_gcp_c2s60 config and the build used CMAKE_BUILD_TYPE=Release -flto -march=native -mtune=native
Contents
- Summary
- l.i0: load without secondary indexes
- l.x: create secondary indexes
- l.i1: continue load after secondary indexes created
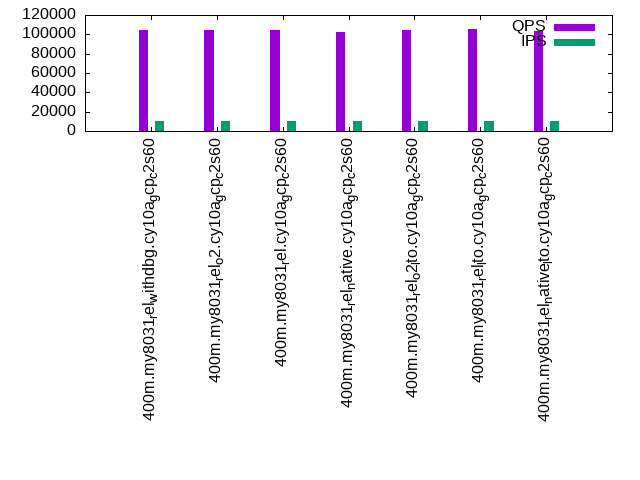
- q100.1: range queries with 100 insert/s per client
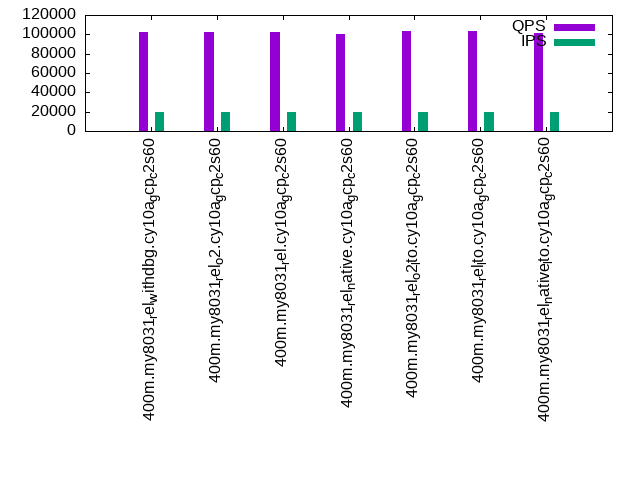
- q500.1: range queries with 500 insert/s per client
- q1000.1: range queries with 1000 insert/s per client
Summary
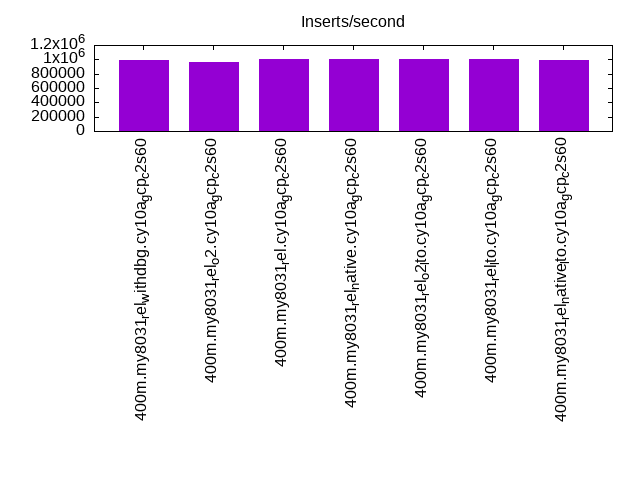
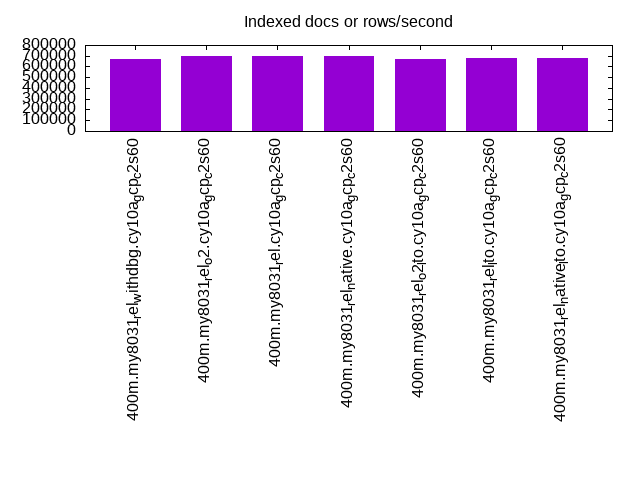
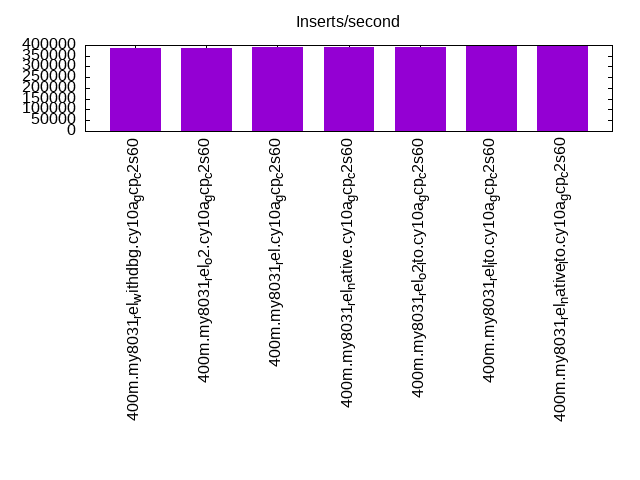
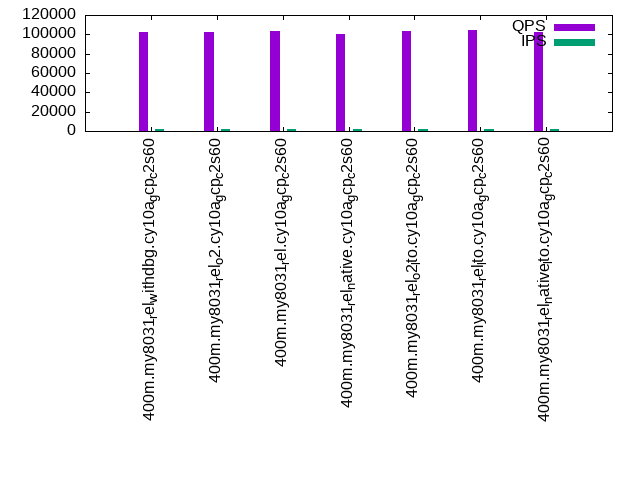
The numbers are inserts/s for l.i0 and l.i1, indexed docs (or rows) /s for l.x and queries/s for q*.2. The values are the average rate over the entire test for inserts (IPS) and queries (QPS). The range of values for IPS and QPS is split into 3 parts: bottom 25%, middle 50%, top 25%. Values in the bottom 25% have a red background, values in the top 25% have a green background and values in the middle have no color. A gray background is used for values that can be ignored because the DBMS did not sustain the target insert rate. Red backgrounds are not used when the minimum value is within 80% of the max value.
| dbms | l.i0 | l.x | l.i1 | q100.1 | q500.1 | q1000.1 |
|---|---|---|---|---|---|---|
| 400m.my8031_rel_withdbg.cy10a_gcp_c2s60 | 987654 | 666833 | 386100 | 102794 | 104222 | 101957 |
| 400m.my8031_rel_o2.cy10a_gcp_c2s60 | 961538 | 701930 | 383877 | 102768 | 104103 | 102037 |
| 400m.my8031_rel.cy10a_gcp_c2s60 | 1007557 | 694618 | 391389 | 103357 | 104810 | 102498 |
| 400m.my8031_rel_native.cy10a_gcp_c2s60 | 1005025 | 693414 | 392927 | 100811 | 102190 | 100501 |
| 400m.my8031_rel_o2_lto.cy10a_gcp_c2s60 | 1005025 | 672437 | 391007 | 103613 | 104853 | 103018 |
| 400m.my8031_rel_lto.cy10a_gcp_c2s60 | 1002506 | 674705 | 398010 | 104056 | 105513 | 103646 |
| 400m.my8031_rel_native_lto.cy10a_gcp_c2s60 | 997506 | 679287 | 396040 | 102812 | 103751 | 101874 |
This table has relative throughput, throughput for the DBMS relative to the DBMS in the first line, using the absolute throughput from the previous table.
| dbms | l.i0 | l.x | l.i1 | q100.1 | q500.1 | q1000.1 |
|---|---|---|---|---|---|---|
| 400m.my8031_rel_withdbg.cy10a_gcp_c2s60 | 1.00 | 1.00 | 1.00 | 1.00 | 1.00 | 1.00 |
| 400m.my8031_rel_o2.cy10a_gcp_c2s60 | 0.97 | 1.05 | 0.99 | 1.00 | 1.00 | 1.00 |
| 400m.my8031_rel.cy10a_gcp_c2s60 | 1.02 | 1.04 | 1.01 | 1.01 | 1.01 | 1.01 |
| 400m.my8031_rel_native.cy10a_gcp_c2s60 | 1.02 | 1.04 | 1.02 | 0.98 | 0.98 | 0.99 |
| 400m.my8031_rel_o2_lto.cy10a_gcp_c2s60 | 1.02 | 1.01 | 1.01 | 1.01 | 1.01 | 1.01 |
| 400m.my8031_rel_lto.cy10a_gcp_c2s60 | 1.02 | 1.01 | 1.03 | 1.01 | 1.01 | 1.02 |
| 400m.my8031_rel_native_lto.cy10a_gcp_c2s60 | 1.01 | 1.02 | 1.03 | 1.00 | 1.00 | 1.00 |
This lists the average rate of inserts/s for the tests that do inserts concurrent with queries. For such tests the query rate is listed in the table above. The read+write tests are setup so that the insert rate should match the target rate every second. Cells that are not at least 95% of the target have a red background to indicate a failure to satisfy the target.
| dbms | q100.1 | q500.1 | q1000.1 |
|---|---|---|---|
| my8031_rel_withdbg.cy10a_gcp_c2s60 | 1977 | 9879 | 19769 |
| my8031_rel_o2.cy10a_gcp_c2s60 | 1976 | 9885 | 19769 |
| my8031_rel.cy10a_gcp_c2s60 | 1976 | 9885 | 19769 |
| my8031_rel_native.cy10a_gcp_c2s60 | 1977 | 9879 | 19769 |
| my8031_rel_o2_lto.cy10a_gcp_c2s60 | 1977 | 9879 | 19769 |
| my8031_rel_lto.cy10a_gcp_c2s60 | 1976 | 9879 | 19769 |
| my8031_rel_native_lto.cy10a_gcp_c2s60 | 1977 | 9879 | 19769 |
| target | 2000 | 10000 | 20000 |
l.i0
l.i0: load without secondary indexes. Graphs for performance per 1-second interval are here.
Average throughput:
Insert response time histogram: each cell has the percentage of responses that take <= the time in the header and max is the max response time in seconds. For the max column values in the top 25% of the range have a red background and in the bottom 25% of the range have a green background. The red background is not used when the min value is within 80% of the max value.
| dbms | 256us | 1ms | 4ms | 16ms | 64ms | 256ms | 1s | 4s | 16s | gt | max |
|---|---|---|---|---|---|---|---|---|---|---|---|
| my8031_rel_withdbg.cy10a_gcp_c2s60 | 0.400 | 99.008 | 0.486 | 0.068 | 0.035 | 0.002 | 0.287 | ||||
| my8031_rel_o2.cy10a_gcp_c2s60 | 0.493 | 98.894 | 0.515 | 0.062 | 0.035 | 0.002 | 0.306 | ||||
| my8031_rel.cy10a_gcp_c2s60 | 0.728 | 98.685 | 0.483 | 0.067 | 0.034 | 0.002 | 0.301 | ||||
| my8031_rel_native.cy10a_gcp_c2s60 | 0.647 | 98.778 | 0.477 | 0.061 | 0.035 | 0.002 | 0.272 | ||||
| my8031_rel_o2_lto.cy10a_gcp_c2s60 | 0.775 | 98.644 | 0.486 | 0.058 | 0.034 | 0.003 | 0.281 | ||||
| my8031_rel_lto.cy10a_gcp_c2s60 | 0.831 | 98.577 | 0.486 | 0.071 | 0.033 | 0.003 | 0.298 | ||||
| my8031_rel_native_lto.cy10a_gcp_c2s60 | 0.590 | 98.833 | 0.479 | 0.062 | 0.034 | 0.002 | 0.266 |
Performance metrics for the DBMS listed above. Some are normalized by throughput, others are not. Legend for results is here.
ips	qps	rps	rmbps	wps	wmbps	rpq	rkbpq	wpi	wkbpi	csps	cpups	cspq	cpupq	dbgb1	dbgb2	rss	maxop	p50	p99	tag
987654	0	0	0.0	1622.7	214.5	0.000	0.000	0.002	0.222	189086	66.1	0.191	20	26.4	155.0	9.3	0.287	53642	38958	400m.my8031_rel_withdbg.cy10a_gcp_c2s60
961538	0	0	0.0	1596.4	214.9	0.000	0.000	0.002	0.229	186803	65.5	0.194	20	26.4	155.0	9.3	0.306	52343	37874	400m.my8031_rel_o2.cy10a_gcp_c2s60
1007557	0	0	0.0	1639.9	221.9	0.000	0.000	0.002	0.226	193726	66.1	0.192	20	26.4	155.0	9.3	0.301	53741	39970	400m.my8031_rel.cy10a_gcp_c2s60
1005025	0	0	0.0	1643.4	220.2	0.000	0.000	0.002	0.224	199715	66.2	0.199	20	26.4	155.0	9.3	0.272	52743	38780	400m.my8031_rel_native.cy10a_gcp_c2s60
1005025	0	0	0.0	1646.7	219.4	0.000	0.000	0.002	0.224	194636	66.1	0.194	20	26.4	155.0	9.3	0.281	53841	40256	400m.my8031_rel_o2_lto.cy10a_gcp_c2s60
1002506	0	0	0.0	1650.4	220.9	0.000	0.000	0.002	0.226	199267	65.3	0.199	20	26.4	155.0	9.3	0.298	52643	37858	400m.my8031_rel_lto.cy10a_gcp_c2s60
997506	0	0	0.0	1646.7	221.0	0.000	0.000	0.002	0.227	197380	65.9	0.198	20	26.4	155.0	9.3	0.266	53341	39656	400m.my8031_rel_native_lto.cy10a_gcp_c2s60
l.x
l.x: create secondary indexes.
Average throughput:
Performance metrics for the DBMS listed above. Some are normalized by throughput, others are not. Legend for results is here.
ips	qps	rps	rmbps	wps	wmbps	rpq	rkbpq	wpi	wkbpi	csps	cpups	cspq	cpupq	dbgb1	dbgb2	rss	maxop	p50	p99	tag
666833	0	3358	231.0	14257.7	638.2	0.005	0.355	0.021	0.980	489994	51.8	0.735	23	58.8	187.4	9.3	0.054	NA	NA	400m.my8031_rel_withdbg.cy10a_gcp_c2s60
701930	0	3538	243.1	14842.0	670.5	0.005	0.355	0.021	0.978	450656	54.3	0.642	23	58.8	187.4	9.3	0.016	NA	NA	400m.my8031_rel_o2.cy10a_gcp_c2s60
694618	0	3493	240.9	14729.3	664.6	0.005	0.355	0.021	0.980	465565	53.7	0.670	23	58.8	187.4	9.3	0.013	NA	NA	400m.my8031_rel.cy10a_gcp_c2s60
693414	0	3496	241.0	14726.4	663.5	0.005	0.356	0.021	0.980	477765	53.2	0.689	23	58.8	187.4	9.3	0.017	NA	NA	400m.my8031_rel_native.cy10a_gcp_c2s60
672437	0	3390	232.9	14352.9	640.7	0.005	0.355	0.021	0.976	485944	52.0	0.723	23	58.8	187.4	9.3	0.052	NA	NA	400m.my8031_rel_o2_lto.cy10a_gcp_c2s60
674705	0	3416	234.9	14416.3	646.9	0.005	0.357	0.021	0.982	485218	51.2	0.719	23	58.8	187.4	9.3	0.039	NA	NA	400m.my8031_rel_lto.cy10a_gcp_c2s60
679287	0	3432	236.8	14485.5	652.0	0.005	0.357	0.021	0.983	480223	49.8	0.707	22	58.8	187.4	9.3	0.047	NA	NA	400m.my8031_rel_native_lto.cy10a_gcp_c2s60
l.i1
l.i1: continue load after secondary indexes created. Graphs for performance per 1-second interval are here.
Average throughput:
Insert response time histogram: each cell has the percentage of responses that take <= the time in the header and max is the max response time in seconds. For the max column values in the top 25% of the range have a red background and in the bottom 25% of the range have a green background. The red background is not used when the min value is within 80% of the max value.
| dbms | 256us | 1ms | 4ms | 16ms | 64ms | 256ms | 1s | 4s | 16s | gt | max |
|---|---|---|---|---|---|---|---|---|---|---|---|
| my8031_rel_withdbg.cy10a_gcp_c2s60 | 98.340 | 1.534 | 0.095 | 0.028 | 0.002 | 0.777 | |||||
| my8031_rel_o2.cy10a_gcp_c2s60 | 98.419 | 1.463 | 0.084 | 0.032 | 0.002 | 0.977 | |||||
| my8031_rel.cy10a_gcp_c2s60 | 98.426 | 1.456 | 0.084 | 0.032 | 0.002 | 0.819 | |||||
| my8031_rel_native.cy10a_gcp_c2s60 | 98.300 | 1.575 | 0.096 | 0.025 | 0.003 | nonzero | 1.009 | ||||
| my8031_rel_o2_lto.cy10a_gcp_c2s60 | 98.469 | 1.413 | 0.088 | 0.027 | 0.003 | nonzero | 1.178 | ||||
| my8031_rel_lto.cy10a_gcp_c2s60 | 98.569 | 1.310 | 0.087 | 0.031 | 0.002 | nonzero | 1.286 | ||||
| my8031_rel_native_lto.cy10a_gcp_c2s60 | 98.664 | 1.216 | 0.084 | 0.034 | 0.002 | nonzero | 1.379 |
Performance metrics for the DBMS listed above. Some are normalized by throughput, others are not. Legend for results is here.
ips	qps	rps	rmbps	wps	wmbps	rpq	rkbpq	wpi	wkbpi	csps	cpups	cspq	cpupq	dbgb1	dbgb2	rss	maxop	p50	p99	tag
386100	0	382	8.3	8645.5	428.7	0.001	0.022	0.022	1.137	250807	68.4	0.650	53	157.8	286.4	9.3	0.777	20128	4147	400m.my8031_rel_withdbg.cy10a_gcp_c2s60
383877	0	349	10.6	8561.9	426.5	0.001	0.028	0.022	1.138	237599	68.7	0.619	54	157.8	286.4	9.3	0.977	20478	6247	400m.my8031_rel_o2.cy10a_gcp_c2s60
391389	0	411	10.8	8417.1	425.6	0.001	0.028	0.022	1.114	254878	67.7	0.651	52	157.8	286.4	9.3	0.819	21477	5594	400m.my8031_rel.cy10a_gcp_c2s60
392927	0	468	10.5	8496.5	427.8	0.001	0.027	0.022	1.115	273320	68.5	0.696	52	157.8	286.4	9.3	1.009	20828	6343	400m.my8031_rel_native.cy10a_gcp_c2s60
391007	0	369	9.7	8531.2	428.0	0.001	0.025	0.022	1.121	242094	68.5	0.619	53	157.8	286.4	9.3	1.178	20628	6043	400m.my8031_rel_o2_lto.cy10a_gcp_c2s60
398010	0	493	13.8	8438.5	429.0	0.001	0.035	0.021	1.104	242979	67.8	0.610	51	157.8	286.4	9.3	1.286	21127	5694	400m.my8031_rel_lto.cy10a_gcp_c2s60
396040	0	483	14.9	8307.5	424.5	0.001	0.038	0.021	1.098	232516	67.9	0.587	51	157.8	286.4	9.3	1.379	21030	8041	400m.my8031_rel_native_lto.cy10a_gcp_c2s60
q100.1
q100.1: range queries with 100 insert/s per client. Graphs for performance per 1-second interval are here.
Average throughput:
Query response time histogram: each cell has the percentage of responses that take <= the time in the header and max is the max response time in seconds. For max values in the top 25% of the range have a red background and in the bottom 25% of the range have a green background. The red background is not used when the min value is within 80% of the max value.
| dbms | 256us | 1ms | 4ms | 16ms | 64ms | 256ms | 1s | 4s | 16s | gt | max |
|---|---|---|---|---|---|---|---|---|---|---|---|
| my8031_rel_withdbg.cy10a_gcp_c2s60 | 96.480 | 3.516 | 0.004 | nonzero | nonzero | 0.023 | |||||
| my8031_rel_o2.cy10a_gcp_c2s60 | 96.806 | 3.190 | 0.004 | nonzero | nonzero | 0.023 | |||||
| my8031_rel.cy10a_gcp_c2s60 | 96.986 | 3.010 | 0.004 | nonzero | nonzero | 0.028 | |||||
| my8031_rel_native.cy10a_gcp_c2s60 | 96.005 | 3.991 | 0.004 | nonzero | nonzero | 0.024 | |||||
| my8031_rel_o2_lto.cy10a_gcp_c2s60 | 96.916 | 3.080 | 0.004 | nonzero | nonzero | 0.024 | |||||
| my8031_rel_lto.cy10a_gcp_c2s60 | 96.819 | 3.177 | 0.004 | nonzero | nonzero | 0.027 | |||||
| my8031_rel_native_lto.cy10a_gcp_c2s60 | 96.542 | 3.453 | 0.004 | nonzero | nonzero | 0.024 |
Insert response time histogram: each cell has the percentage of responses that take <= the time in the header and max is the max response time in seconds. For max values in the top 25% of the range have a red background and in the bottom 25% of the range have a green background. The red background is not used when the min value is within 80% of the max value.
| dbms | 256us | 1ms | 4ms | 16ms | 64ms | 256ms | 1s | 4s | 16s | gt | max |
|---|---|---|---|---|---|---|---|---|---|---|---|
| my8031_rel_withdbg.cy10a_gcp_c2s60 | 95.690 | 4.300 | 0.010 | 0.022 | |||||||
| my8031_rel_o2.cy10a_gcp_c2s60 | 95.492 | 4.489 | 0.019 | 0.042 | |||||||
| my8031_rel.cy10a_gcp_c2s60 | 93.867 | 6.110 | 0.024 | 0.024 | |||||||
| my8031_rel_native.cy10a_gcp_c2s60 | 95.121 | 4.854 | 0.025 | 0.026 | |||||||
| my8031_rel_o2_lto.cy10a_gcp_c2s60 | 94.769 | 5.194 | 0.036 | 0.025 | |||||||
| my8031_rel_lto.cy10a_gcp_c2s60 | 95.417 | 4.578 | 0.006 | 0.019 | |||||||
| my8031_rel_native_lto.cy10a_gcp_c2s60 | 95.271 | 4.725 | 0.004 | 0.022 |
Performance metrics for the DBMS listed above. Some are normalized by throughput, others are not. Legend for results is here.
ips	qps	rps	rmbps	wps	wmbps	rpq	rkbpq	wpi	wkbpi	csps	cpups	cspq	cpupq	dbgb1	dbgb2	rss	maxop	p50	p99	tag
1977	102794	0	0.0	3530.6	101.6	0.000	0.000	1.786	52.650	400275	65.9	3.894	192	159.7	288.3	9.3	0.023	5242	4779	400m.my8031_rel_withdbg.cy10a_gcp_c2s60
1976	102768	0	0.0	3555.8	102.3	0.000	0.000	1.800	52.994	399557	66.1	3.888	193	159.7	288.3	9.3	0.023	5210	4763	400m.my8031_rel_o2.cy10a_gcp_c2s60
1976	103357	0	0.0	3506.4	101.4	0.000	0.000	1.775	52.530	400303	66.0	3.873	192	159.7	288.3	9.3	0.028	5178	4767	400m.my8031_rel.cy10a_gcp_c2s60
1977	100811	0	0.0	3569.2	102.8	0.000	0.000	1.805	53.226	393019	66.1	3.899	197	159.7	288.3	9.3	0.024	5050	4763	400m.my8031_rel_native.cy10a_gcp_c2s60
1977	103613	0	0.0	3553.1	102.4	0.000	0.000	1.797	53.050	402063	65.9	3.880	191	159.7	288.3	9.3	0.024	5242	4795	400m.my8031_rel_o2_lto.cy10a_gcp_c2s60
1976	104056	0	0.0	3568.9	102.8	0.000	0.000	1.806	53.296	404004	65.9	3.883	190	159.7	288.3	9.3	0.027	5324	4890	400m.my8031_rel_lto.cy10a_gcp_c2s60
1977	102812	0	0.0	3569.0	103.0	0.000	0.000	1.805	53.365	400246	65.8	3.893	192	159.7	288.3	9.3	0.024	5132	4731	400m.my8031_rel_native_lto.cy10a_gcp_c2s60
q500.1
q500.1: range queries with 500 insert/s per client. Graphs for performance per 1-second interval are here.
Average throughput:
Query response time histogram: each cell has the percentage of responses that take <= the time in the header and max is the max response time in seconds. For max values in the top 25% of the range have a red background and in the bottom 25% of the range have a green background. The red background is not used when the min value is within 80% of the max value.
| dbms | 256us | 1ms | 4ms | 16ms | 64ms | 256ms | 1s | 4s | 16s | gt | max |
|---|---|---|---|---|---|---|---|---|---|---|---|
| my8031_rel_withdbg.cy10a_gcp_c2s60 | 97.231 | 2.746 | 0.021 | 0.002 | nonzero | 0.023 | |||||
| my8031_rel_o2.cy10a_gcp_c2s60 | 97.459 | 2.519 | 0.020 | 0.002 | nonzero | 0.028 | |||||
| my8031_rel.cy10a_gcp_c2s60 | 97.606 | 2.371 | 0.021 | 0.002 | nonzero | 0.020 | |||||
| my8031_rel_native.cy10a_gcp_c2s60 | 96.853 | 3.123 | 0.021 | 0.002 | nonzero | 0.023 | |||||
| my8031_rel_o2_lto.cy10a_gcp_c2s60 | 97.519 | 2.457 | 0.021 | 0.002 | nonzero | 0.027 | |||||
| my8031_rel_lto.cy10a_gcp_c2s60 | 97.440 | 2.537 | 0.021 | 0.002 | nonzero | 0.027 | |||||
| my8031_rel_native_lto.cy10a_gcp_c2s60 | 97.140 | 2.838 | 0.020 | 0.002 | nonzero | 0.024 |
Insert response time histogram: each cell has the percentage of responses that take <= the time in the header and max is the max response time in seconds. For max values in the top 25% of the range have a red background and in the bottom 25% of the range have a green background. The red background is not used when the min value is within 80% of the max value.
| dbms | 256us | 1ms | 4ms | 16ms | 64ms | 256ms | 1s | 4s | 16s | gt | max |
|---|---|---|---|---|---|---|---|---|---|---|---|
| my8031_rel_withdbg.cy10a_gcp_c2s60 | 53.681 | 45.512 | 0.807 | 0.043 | |||||||
| my8031_rel_o2.cy10a_gcp_c2s60 | 59.064 | 40.235 | 0.701 | 0.053 | |||||||
| my8031_rel.cy10a_gcp_c2s60 | 52.796 | 46.470 | 0.734 | 0.045 | |||||||
| my8031_rel_native.cy10a_gcp_c2s60 | 52.999 | 46.037 | 0.963 | 0.043 | |||||||
| my8031_rel_o2_lto.cy10a_gcp_c2s60 | 53.202 | 45.981 | 0.817 | 0.048 | |||||||
| my8031_rel_lto.cy10a_gcp_c2s60 | 59.745 | 39.596 | 0.659 | 0.054 | |||||||
| my8031_rel_native_lto.cy10a_gcp_c2s60 | 62.870 | 36.519 | 0.611 | 0.046 |
Performance metrics for the DBMS listed above. Some are normalized by throughput, others are not. Legend for results is here.
ips	qps	rps	rmbps	wps	wmbps	rpq	rkbpq	wpi	wkbpi	csps	cpups	cspq	cpupq	dbgb1	dbgb2	rss	maxop	p50	p99	tag
9879	104222	0	0.0	507.9	21.4	0.000	0.000	0.051	2.216	378326	66.3	3.630	191	167.8	296.3	9.3	0.023	5210	4891	400m.my8031_rel_withdbg.cy10a_gcp_c2s60
9885	104103	0	0.0	533.2	22.4	0.000	0.000	0.054	2.321	378489	66.8	3.636	193	167.7	296.3	9.3	0.028	5258	4955	400m.my8031_rel_o2.cy10a_gcp_c2s60
9885	104810	0	0.0	474.7	21.1	0.000	0.000	0.048	2.185	379441	66.2	3.620	189	167.7	296.3	9.3	0.020	5194	4923	400m.my8031_rel.cy10a_gcp_c2s60
9879	102190	0	0.0	512.8	21.4	0.000	0.000	0.052	2.217	372393	66.7	3.644	196	167.7	296.3	9.3	0.023	5081	4812	400m.my8031_rel_native.cy10a_gcp_c2s60
9879	104853	0	0.0	529.6	22.2	0.000	0.000	0.054	2.303	381938	66.2	3.643	189	167.8	296.3	9.3	0.027	5226	4959	400m.my8031_rel_o2_lto.cy10a_gcp_c2s60
9879	105513	0	0.0	501.7	21.6	0.000	0.000	0.051	2.241	383209	66.2	3.632	188	167.8	296.3	9.3	0.027	5338	5019	400m.my8031_rel_lto.cy10a_gcp_c2s60
9879	103751	0	0.0	515.2	21.7	0.000	0.000	0.052	2.252	377742	66.2	3.641	191	167.8	296.3	9.3	0.024	5130	4875	400m.my8031_rel_native_lto.cy10a_gcp_c2s60
q1000.1
q1000.1: range queries with 1000 insert/s per client. Graphs for performance per 1-second interval are here.
Average throughput:
Query response time histogram: each cell has the percentage of responses that take <= the time in the header and max is the max response time in seconds. For max values in the top 25% of the range have a red background and in the bottom 25% of the range have a green background. The red background is not used when the min value is within 80% of the max value.
| dbms | 256us | 1ms | 4ms | 16ms | 64ms | 256ms | 1s | 4s | 16s | gt | max |
|---|---|---|---|---|---|---|---|---|---|---|---|
| my8031_rel_withdbg.cy10a_gcp_c2s60 | 96.784 | 3.179 | 0.032 | 0.005 | nonzero | 0.028 | |||||
| my8031_rel_o2.cy10a_gcp_c2s60 | 97.072 | 2.893 | 0.031 | 0.004 | nonzero | 0.029 | |||||
| my8031_rel.cy10a_gcp_c2s60 | 97.178 | 2.786 | 0.032 | 0.004 | nonzero | 0.031 | |||||
| my8031_rel_native.cy10a_gcp_c2s60 | 96.453 | 3.513 | 0.029 | 0.004 | nonzero | 0.025 | |||||
| my8031_rel_o2_lto.cy10a_gcp_c2s60 | 97.176 | 2.787 | 0.032 | 0.005 | nonzero | 0.027 | |||||
| my8031_rel_lto.cy10a_gcp_c2s60 | 97.098 | 2.869 | 0.030 | 0.004 | nonzero | 0.026 | |||||
| my8031_rel_native_lto.cy10a_gcp_c2s60 | 96.740 | 3.225 | 0.031 | 0.004 | nonzero | 0.036 |
Insert response time histogram: each cell has the percentage of responses that take <= the time in the header and max is the max response time in seconds. For max values in the top 25% of the range have a red background and in the bottom 25% of the range have a green background. The red background is not used when the min value is within 80% of the max value.
| dbms | 256us | 1ms | 4ms | 16ms | 64ms | 256ms | 1s | 4s | 16s | gt | max |
|---|---|---|---|---|---|---|---|---|---|---|---|
| my8031_rel_withdbg.cy10a_gcp_c2s60 | 55.740 | 42.987 | 1.272 | nonzero | 0.074 | ||||||
| my8031_rel_o2.cy10a_gcp_c2s60 | 54.639 | 44.137 | 1.223 | 0.054 | |||||||
| my8031_rel.cy10a_gcp_c2s60 | 54.138 | 44.696 | 1.166 | nonzero | 0.066 | ||||||
| my8031_rel_native.cy10a_gcp_c2s60 | 59.217 | 39.947 | 0.837 | 0.052 | |||||||
| my8031_rel_o2_lto.cy10a_gcp_c2s60 | 55.850 | 42.835 | 1.315 | nonzero | 0.065 | ||||||
| my8031_rel_lto.cy10a_gcp_c2s60 | 58.280 | 40.807 | 0.913 | 0.052 | |||||||
| my8031_rel_native_lto.cy10a_gcp_c2s60 | 60.412 | 38.434 | 1.155 | 0.063 |
Performance metrics for the DBMS listed above. Some are normalized by throughput, others are not. Legend for results is here.
ips	qps	rps	rmbps	wps	wmbps	rpq	rkbpq	wpi	wkbpi	csps	cpups	cspq	cpupq	dbgb1	dbgb2	rss	maxop	p50	p99	tag
19769	101957	11	0.2	3104.3	90.1	0.000	0.002	0.157	4.669	375440	68.2	3.682	201	176.1	304.7	9.3	0.028	5164	4875	400m.my8031_rel_withdbg.cy10a_gcp_c2s60
19769	102037	10	0.2	3001.3	87.5	0.000	0.002	0.152	4.532	374497	68.2	3.670	201	176.1	304.7	9.3	0.029	5085	4827	400m.my8031_rel_o2.cy10a_gcp_c2s60
19769	102498	10	0.2	2722.5	79.8	0.000	0.002	0.138	4.135	376344	68.1	3.672	199	176.1	304.7	9.3	0.031	5159	4859	400m.my8031_rel.cy10a_gcp_c2s60
19769	100501	9	0.1	2948.1	85.9	0.000	0.001	0.149	4.450	369828	68.2	3.680	204	176.2	304.7	9.3	0.025	5114	4811	400m.my8031_rel_native.cy10a_gcp_c2s60
19769	103018	10	0.2	2782.6	81.4	0.000	0.002	0.141	4.217	378256	68.1	3.672	198	176.2	304.7	9.3	0.027	5164	4891	400m.my8031_rel_o2_lto.cy10a_gcp_c2s60
19769	103646	10	0.2	2908.4	84.7	0.000	0.002	0.147	4.385	380960	68.1	3.676	197	176.1	304.7	9.3	0.026	5210	4939	400m.my8031_rel_lto.cy10a_gcp_c2s60
19769	101874	9	0.1	3004.2	87.3	0.000	0.001	0.152	4.523	375901	68.0	3.690	200	176.1	304.7	9.3	0.036	5178	4876	400m.my8031_rel_native_lto.cy10a_gcp_c2s60
l.i0
l.i0: load without secondary indexes
Performance metrics for all DBMS, not just the ones listed above. Some are normalized by throughput, others are not. Legend for results is here.
ips	qps	rps	rmbps	wps	wmbps	rpq	rkbpq	wpi	wkbpi	csps	cpups	cspq	cpupq	dbgb1	dbgb2	rss	maxop	p50	p99	tag
987654	0	0	0.0	1622.7	214.5	0.000	0.000	0.002	0.222	189086	66.1	0.191	20	26.4	155.0	9.3	0.287	53642	38958	400m.my8031_rel_withdbg.cy10a_gcp_c2s60
961538	0	0	0.0	1596.4	214.9	0.000	0.000	0.002	0.229	186803	65.5	0.194	20	26.4	155.0	9.3	0.306	52343	37874	400m.my8031_rel_o2.cy10a_gcp_c2s60
1007557	0	0	0.0	1639.9	221.9	0.000	0.000	0.002	0.226	193726	66.1	0.192	20	26.4	155.0	9.3	0.301	53741	39970	400m.my8031_rel.cy10a_gcp_c2s60
1005025	0	0	0.0	1643.4	220.2	0.000	0.000	0.002	0.224	199715	66.2	0.199	20	26.4	155.0	9.3	0.272	52743	38780	400m.my8031_rel_native.cy10a_gcp_c2s60
1005025	0	0	0.0	1646.7	219.4	0.000	0.000	0.002	0.224	194636	66.1	0.194	20	26.4	155.0	9.3	0.281	53841	40256	400m.my8031_rel_o2_lto.cy10a_gcp_c2s60
1002506	0	0	0.0	1650.4	220.9	0.000	0.000	0.002	0.226	199267	65.3	0.199	20	26.4	155.0	9.3	0.298	52643	37858	400m.my8031_rel_lto.cy10a_gcp_c2s60
997506	0	0	0.0	1646.7	221.0	0.000	0.000	0.002	0.227	197380	65.9	0.198	20	26.4	155.0	9.3	0.266	53341	39656	400m.my8031_rel_native_lto.cy10a_gcp_c2s60
l.x
l.x: create secondary indexes
Performance metrics for all DBMS, not just the ones listed above. Some are normalized by throughput, others are not. Legend for results is here.
ips	qps	rps	rmbps	wps	wmbps	rpq	rkbpq	wpi	wkbpi	csps	cpups	cspq	cpupq	dbgb1	dbgb2	rss	maxop	p50	p99	tag
666833	0	3358	231.0	14257.7	638.2	0.005	0.355	0.021	0.980	489994	51.8	0.735	23	58.8	187.4	9.3	0.054	NA	NA	400m.my8031_rel_withdbg.cy10a_gcp_c2s60
701930	0	3538	243.1	14842.0	670.5	0.005	0.355	0.021	0.978	450656	54.3	0.642	23	58.8	187.4	9.3	0.016	NA	NA	400m.my8031_rel_o2.cy10a_gcp_c2s60
694618	0	3493	240.9	14729.3	664.6	0.005	0.355	0.021	0.980	465565	53.7	0.670	23	58.8	187.4	9.3	0.013	NA	NA	400m.my8031_rel.cy10a_gcp_c2s60
693414	0	3496	241.0	14726.4	663.5	0.005	0.356	0.021	0.980	477765	53.2	0.689	23	58.8	187.4	9.3	0.017	NA	NA	400m.my8031_rel_native.cy10a_gcp_c2s60
672437	0	3390	232.9	14352.9	640.7	0.005	0.355	0.021	0.976	485944	52.0	0.723	23	58.8	187.4	9.3	0.052	NA	NA	400m.my8031_rel_o2_lto.cy10a_gcp_c2s60
674705	0	3416	234.9	14416.3	646.9	0.005	0.357	0.021	0.982	485218	51.2	0.719	23	58.8	187.4	9.3	0.039	NA	NA	400m.my8031_rel_lto.cy10a_gcp_c2s60
679287	0	3432	236.8	14485.5	652.0	0.005	0.357	0.021	0.983	480223	49.8	0.707	22	58.8	187.4	9.3	0.047	NA	NA	400m.my8031_rel_native_lto.cy10a_gcp_c2s60
l.i1
l.i1: continue load after secondary indexes created
Performance metrics for all DBMS, not just the ones listed above. Some are normalized by throughput, others are not. Legend for results is here.
ips	qps	rps	rmbps	wps	wmbps	rpq	rkbpq	wpi	wkbpi	csps	cpups	cspq	cpupq	dbgb1	dbgb2	rss	maxop	p50	p99	tag
386100	0	382	8.3	8645.5	428.7	0.001	0.022	0.022	1.137	250807	68.4	0.650	53	157.8	286.4	9.3	0.777	20128	4147	400m.my8031_rel_withdbg.cy10a_gcp_c2s60
383877	0	349	10.6	8561.9	426.5	0.001	0.028	0.022	1.138	237599	68.7	0.619	54	157.8	286.4	9.3	0.977	20478	6247	400m.my8031_rel_o2.cy10a_gcp_c2s60
391389	0	411	10.8	8417.1	425.6	0.001	0.028	0.022	1.114	254878	67.7	0.651	52	157.8	286.4	9.3	0.819	21477	5594	400m.my8031_rel.cy10a_gcp_c2s60
392927	0	468	10.5	8496.5	427.8	0.001	0.027	0.022	1.115	273320	68.5	0.696	52	157.8	286.4	9.3	1.009	20828	6343	400m.my8031_rel_native.cy10a_gcp_c2s60
391007	0	369	9.7	8531.2	428.0	0.001	0.025	0.022	1.121	242094	68.5	0.619	53	157.8	286.4	9.3	1.178	20628	6043	400m.my8031_rel_o2_lto.cy10a_gcp_c2s60
398010	0	493	13.8	8438.5	429.0	0.001	0.035	0.021	1.104	242979	67.8	0.610	51	157.8	286.4	9.3	1.286	21127	5694	400m.my8031_rel_lto.cy10a_gcp_c2s60
396040	0	483	14.9	8307.5	424.5	0.001	0.038	0.021	1.098	232516	67.9	0.587	51	157.8	286.4	9.3	1.379	21030	8041	400m.my8031_rel_native_lto.cy10a_gcp_c2s60
q100.1
q100.1: range queries with 100 insert/s per client
Performance metrics for all DBMS, not just the ones listed above. Some are normalized by throughput, others are not. Legend for results is here.
ips	qps	rps	rmbps	wps	wmbps	rpq	rkbpq	wpi	wkbpi	csps	cpups	cspq	cpupq	dbgb1	dbgb2	rss	maxop	p50	p99	tag
1977	102794	0	0.0	3530.6	101.6	0.000	0.000	1.786	52.650	400275	65.9	3.894	192	159.7	288.3	9.3	0.023	5242	4779	400m.my8031_rel_withdbg.cy10a_gcp_c2s60
1976	102768	0	0.0	3555.8	102.3	0.000	0.000	1.800	52.994	399557	66.1	3.888	193	159.7	288.3	9.3	0.023	5210	4763	400m.my8031_rel_o2.cy10a_gcp_c2s60
1976	103357	0	0.0	3506.4	101.4	0.000	0.000	1.775	52.530	400303	66.0	3.873	192	159.7	288.3	9.3	0.028	5178	4767	400m.my8031_rel.cy10a_gcp_c2s60
1977	100811	0	0.0	3569.2	102.8	0.000	0.000	1.805	53.226	393019	66.1	3.899	197	159.7	288.3	9.3	0.024	5050	4763	400m.my8031_rel_native.cy10a_gcp_c2s60
1977	103613	0	0.0	3553.1	102.4	0.000	0.000	1.797	53.050	402063	65.9	3.880	191	159.7	288.3	9.3	0.024	5242	4795	400m.my8031_rel_o2_lto.cy10a_gcp_c2s60
1976	104056	0	0.0	3568.9	102.8	0.000	0.000	1.806	53.296	404004	65.9	3.883	190	159.7	288.3	9.3	0.027	5324	4890	400m.my8031_rel_lto.cy10a_gcp_c2s60
1977	102812	0	0.0	3569.0	103.0	0.000	0.000	1.805	53.365	400246	65.8	3.893	192	159.7	288.3	9.3	0.024	5132	4731	400m.my8031_rel_native_lto.cy10a_gcp_c2s60
q500.1
q500.1: range queries with 500 insert/s per client
Performance metrics for all DBMS, not just the ones listed above. Some are normalized by throughput, others are not. Legend for results is here.
ips	qps	rps	rmbps	wps	wmbps	rpq	rkbpq	wpi	wkbpi	csps	cpups	cspq	cpupq	dbgb1	dbgb2	rss	maxop	p50	p99	tag
9879	104222	0	0.0	507.9	21.4	0.000	0.000	0.051	2.216	378326	66.3	3.630	191	167.8	296.3	9.3	0.023	5210	4891	400m.my8031_rel_withdbg.cy10a_gcp_c2s60
9885	104103	0	0.0	533.2	22.4	0.000	0.000	0.054	2.321	378489	66.8	3.636	193	167.7	296.3	9.3	0.028	5258	4955	400m.my8031_rel_o2.cy10a_gcp_c2s60
9885	104810	0	0.0	474.7	21.1	0.000	0.000	0.048	2.185	379441	66.2	3.620	189	167.7	296.3	9.3	0.020	5194	4923	400m.my8031_rel.cy10a_gcp_c2s60
9879	102190	0	0.0	512.8	21.4	0.000	0.000	0.052	2.217	372393	66.7	3.644	196	167.7	296.3	9.3	0.023	5081	4812	400m.my8031_rel_native.cy10a_gcp_c2s60
9879	104853	0	0.0	529.6	22.2	0.000	0.000	0.054	2.303	381938	66.2	3.643	189	167.8	296.3	9.3	0.027	5226	4959	400m.my8031_rel_o2_lto.cy10a_gcp_c2s60
9879	105513	0	0.0	501.7	21.6	0.000	0.000	0.051	2.241	383209	66.2	3.632	188	167.8	296.3	9.3	0.027	5338	5019	400m.my8031_rel_lto.cy10a_gcp_c2s60
9879	103751	0	0.0	515.2	21.7	0.000	0.000	0.052	2.252	377742	66.2	3.641	191	167.8	296.3	9.3	0.024	5130	4875	400m.my8031_rel_native_lto.cy10a_gcp_c2s60
q1000.1
q1000.1: range queries with 1000 insert/s per client
Performance metrics for all DBMS, not just the ones listed above. Some are normalized by throughput, others are not. Legend for results is here.
ips	qps	rps	rmbps	wps	wmbps	rpq	rkbpq	wpi	wkbpi	csps	cpups	cspq	cpupq	dbgb1	dbgb2	rss	maxop	p50	p99	tag
19769	101957	11	0.2	3104.3	90.1	0.000	0.002	0.157	4.669	375440	68.2	3.682	201	176.1	304.7	9.3	0.028	5164	4875	400m.my8031_rel_withdbg.cy10a_gcp_c2s60
19769	102037	10	0.2	3001.3	87.5	0.000	0.002	0.152	4.532	374497	68.2	3.670	201	176.1	304.7	9.3	0.029	5085	4827	400m.my8031_rel_o2.cy10a_gcp_c2s60
19769	102498	10	0.2	2722.5	79.8	0.000	0.002	0.138	4.135	376344	68.1	3.672	199	176.1	304.7	9.3	0.031	5159	4859	400m.my8031_rel.cy10a_gcp_c2s60
19769	100501	9	0.1	2948.1	85.9	0.000	0.001	0.149	4.450	369828	68.2	3.680	204	176.2	304.7	9.3	0.025	5114	4811	400m.my8031_rel_native.cy10a_gcp_c2s60
19769	103018	10	0.2	2782.6	81.4	0.000	0.002	0.141	4.217	378256	68.1	3.672	198	176.2	304.7	9.3	0.027	5164	4891	400m.my8031_rel_o2_lto.cy10a_gcp_c2s60
19769	103646	10	0.2	2908.4	84.7	0.000	0.002	0.147	4.385	380960	68.1	3.676	197	176.1	304.7	9.3	0.026	5210	4939	400m.my8031_rel_lto.cy10a_gcp_c2s60
19769	101874	9	0.1	3004.2	87.3	0.000	0.001	0.152	4.523	375901	68.0	3.690	200	176.1	304.7	9.3	0.036	5178	4876	400m.my8031_rel_native_lto.cy10a_gcp_c2s60
l.i0
- l.i0: load without secondary indexes
- Legend for results is here.
- Each entry lists the percentage of responses that fit in that bucket (slower than max time for previous bucket, faster than min time for next bucket).
Insert response time histogram
256us	1ms	4ms	16ms	64ms	256ms	1s	4s	16s	gt	max	tag
0.000	0.400	99.008	0.486	0.068	0.035	0.002	0.000	0.000	0.000	0.287	my8031_rel_withdbg.cy10a_gcp_c2s60
0.000	0.493	98.894	0.515	0.062	0.035	0.002	0.000	0.000	0.000	0.306	my8031_rel_o2.cy10a_gcp_c2s60
0.000	0.728	98.685	0.483	0.067	0.034	0.002	0.000	0.000	0.000	0.301	my8031_rel.cy10a_gcp_c2s60
0.000	0.647	98.778	0.477	0.061	0.035	0.002	0.000	0.000	0.000	0.272	my8031_rel_native.cy10a_gcp_c2s60
0.000	0.775	98.644	0.486	0.058	0.034	0.003	0.000	0.000	0.000	0.281	my8031_rel_o2_lto.cy10a_gcp_c2s60
0.000	0.831	98.577	0.486	0.071	0.033	0.003	0.000	0.000	0.000	0.298	my8031_rel_lto.cy10a_gcp_c2s60
0.000	0.590	98.833	0.479	0.062	0.034	0.002	0.000	0.000	0.000	0.266	my8031_rel_native_lto.cy10a_gcp_c2s60
l.x
- l.x: create secondary indexes
- Legend for results is here.
- Each entry lists the percentage of responses that fit in that bucket (slower than max time for previous bucket, faster than min time for next bucket).
TODO - determine whether there is data for create index response time
l.i1
- l.i1: continue load after secondary indexes created
- Legend for results is here.
- Each entry lists the percentage of responses that fit in that bucket (slower than max time for previous bucket, faster than min time for next bucket).
Insert response time histogram
256us	1ms	4ms	16ms	64ms	256ms	1s	4s	16s	gt	max	tag
0.000	0.000	98.340	1.534	0.095	0.028	0.002	0.000	0.000	0.000	0.777	my8031_rel_withdbg.cy10a_gcp_c2s60
0.000	0.000	98.419	1.463	0.084	0.032	0.002	0.000	0.000	0.000	0.977	my8031_rel_o2.cy10a_gcp_c2s60
0.000	0.000	98.426	1.456	0.084	0.032	0.002	0.000	0.000	0.000	0.819	my8031_rel.cy10a_gcp_c2s60
0.000	0.000	98.300	1.575	0.096	0.025	0.003	nonzero	0.000	0.000	1.009	my8031_rel_native.cy10a_gcp_c2s60
0.000	0.000	98.469	1.413	0.088	0.027	0.003	nonzero	0.000	0.000	1.178	my8031_rel_o2_lto.cy10a_gcp_c2s60
0.000	0.000	98.569	1.310	0.087	0.031	0.002	nonzero	0.000	0.000	1.286	my8031_rel_lto.cy10a_gcp_c2s60
0.000	0.000	98.664	1.216	0.084	0.034	0.002	nonzero	0.000	0.000	1.379	my8031_rel_native_lto.cy10a_gcp_c2s60
q100.1
- q100.1: range queries with 100 insert/s per client
- Legend for results is here.
- Each entry lists the percentage of responses that fit in that bucket (slower than max time for previous bucket, faster than min time for next bucket).
Query response time histogram
256us	1ms	4ms	16ms	64ms	256ms	1s	4s	16s	gt	max	tag
96.480	3.516	0.004	nonzero	nonzero	0.000	0.000	0.000	0.000	0.000	0.023	my8031_rel_withdbg.cy10a_gcp_c2s60
96.806	3.190	0.004	nonzero	nonzero	0.000	0.000	0.000	0.000	0.000	0.023	my8031_rel_o2.cy10a_gcp_c2s60
96.986	3.010	0.004	nonzero	nonzero	0.000	0.000	0.000	0.000	0.000	0.028	my8031_rel.cy10a_gcp_c2s60
96.005	3.991	0.004	nonzero	nonzero	0.000	0.000	0.000	0.000	0.000	0.024	my8031_rel_native.cy10a_gcp_c2s60
96.916	3.080	0.004	nonzero	nonzero	0.000	0.000	0.000	0.000	0.000	0.024	my8031_rel_o2_lto.cy10a_gcp_c2s60
96.819	3.177	0.004	nonzero	nonzero	0.000	0.000	0.000	0.000	0.000	0.027	my8031_rel_lto.cy10a_gcp_c2s60
96.542	3.453	0.004	nonzero	nonzero	0.000	0.000	0.000	0.000	0.000	0.024	my8031_rel_native_lto.cy10a_gcp_c2s60
Insert response time histogram
256us	1ms	4ms	16ms	64ms	256ms	1s	4s	16s	gt	max	tag
0.000	0.000	95.690	4.300	0.010	0.000	0.000	0.000	0.000	0.000	0.022	my8031_rel_withdbg.cy10a_gcp_c2s60
0.000	0.000	95.492	4.489	0.019	0.000	0.000	0.000	0.000	0.000	0.042	my8031_rel_o2.cy10a_gcp_c2s60
0.000	0.000	93.867	6.110	0.024	0.000	0.000	0.000	0.000	0.000	0.024	my8031_rel.cy10a_gcp_c2s60
0.000	0.000	95.121	4.854	0.025	0.000	0.000	0.000	0.000	0.000	0.026	my8031_rel_native.cy10a_gcp_c2s60
0.000	0.000	94.769	5.194	0.036	0.000	0.000	0.000	0.000	0.000	0.025	my8031_rel_o2_lto.cy10a_gcp_c2s60
0.000	0.000	95.417	4.578	0.006	0.000	0.000	0.000	0.000	0.000	0.019	my8031_rel_lto.cy10a_gcp_c2s60
0.000	0.000	95.271	4.725	0.004	0.000	0.000	0.000	0.000	0.000	0.022	my8031_rel_native_lto.cy10a_gcp_c2s60
q500.1
- q500.1: range queries with 500 insert/s per client
- Legend for results is here.
- Each entry lists the percentage of responses that fit in that bucket (slower than max time for previous bucket, faster than min time for next bucket).
Query response time histogram
256us	1ms	4ms	16ms	64ms	256ms	1s	4s	16s	gt	max	tag
97.231	2.746	0.021	0.002	nonzero	0.000	0.000	0.000	0.000	0.000	0.023	my8031_rel_withdbg.cy10a_gcp_c2s60
97.459	2.519	0.020	0.002	nonzero	0.000	0.000	0.000	0.000	0.000	0.028	my8031_rel_o2.cy10a_gcp_c2s60
97.606	2.371	0.021	0.002	nonzero	0.000	0.000	0.000	0.000	0.000	0.020	my8031_rel.cy10a_gcp_c2s60
96.853	3.123	0.021	0.002	nonzero	0.000	0.000	0.000	0.000	0.000	0.023	my8031_rel_native.cy10a_gcp_c2s60
97.519	2.457	0.021	0.002	nonzero	0.000	0.000	0.000	0.000	0.000	0.027	my8031_rel_o2_lto.cy10a_gcp_c2s60
97.440	2.537	0.021	0.002	nonzero	0.000	0.000	0.000	0.000	0.000	0.027	my8031_rel_lto.cy10a_gcp_c2s60
97.140	2.838	0.020	0.002	nonzero	0.000	0.000	0.000	0.000	0.000	0.024	my8031_rel_native_lto.cy10a_gcp_c2s60
Insert response time histogram
256us	1ms	4ms	16ms	64ms	256ms	1s	4s	16s	gt	max	tag
0.000	0.000	53.681	45.512	0.807	0.000	0.000	0.000	0.000	0.000	0.043	my8031_rel_withdbg.cy10a_gcp_c2s60
0.000	0.000	59.064	40.235	0.701	0.000	0.000	0.000	0.000	0.000	0.053	my8031_rel_o2.cy10a_gcp_c2s60
0.000	0.000	52.796	46.470	0.734	0.000	0.000	0.000	0.000	0.000	0.045	my8031_rel.cy10a_gcp_c2s60
0.000	0.000	52.999	46.037	0.963	0.000	0.000	0.000	0.000	0.000	0.043	my8031_rel_native.cy10a_gcp_c2s60
0.000	0.000	53.202	45.981	0.817	0.000	0.000	0.000	0.000	0.000	0.048	my8031_rel_o2_lto.cy10a_gcp_c2s60
0.000	0.000	59.745	39.596	0.659	0.000	0.000	0.000	0.000	0.000	0.054	my8031_rel_lto.cy10a_gcp_c2s60
0.000	0.000	62.870	36.519	0.611	0.000	0.000	0.000	0.000	0.000	0.046	my8031_rel_native_lto.cy10a_gcp_c2s60
q1000.1
- q1000.1: range queries with 1000 insert/s per client
- Legend for results is here.
- Each entry lists the percentage of responses that fit in that bucket (slower than max time for previous bucket, faster than min time for next bucket).
Query response time histogram
256us	1ms	4ms	16ms	64ms	256ms	1s	4s	16s	gt	max	tag
96.784	3.179	0.032	0.005	nonzero	0.000	0.000	0.000	0.000	0.000	0.028	my8031_rel_withdbg.cy10a_gcp_c2s60
97.072	2.893	0.031	0.004	nonzero	0.000	0.000	0.000	0.000	0.000	0.029	my8031_rel_o2.cy10a_gcp_c2s60
97.178	2.786	0.032	0.004	nonzero	0.000	0.000	0.000	0.000	0.000	0.031	my8031_rel.cy10a_gcp_c2s60
96.453	3.513	0.029	0.004	nonzero	0.000	0.000	0.000	0.000	0.000	0.025	my8031_rel_native.cy10a_gcp_c2s60
97.176	2.787	0.032	0.005	nonzero	0.000	0.000	0.000	0.000	0.000	0.027	my8031_rel_o2_lto.cy10a_gcp_c2s60
97.098	2.869	0.030	0.004	nonzero	0.000	0.000	0.000	0.000	0.000	0.026	my8031_rel_lto.cy10a_gcp_c2s60
96.740	3.225	0.031	0.004	nonzero	0.000	0.000	0.000	0.000	0.000	0.036	my8031_rel_native_lto.cy10a_gcp_c2s60
Insert response time histogram
256us	1ms	4ms	16ms	64ms	256ms	1s	4s	16s	gt	max	tag
0.000	0.000	55.740	42.987	1.272	nonzero	0.000	0.000	0.000	0.000	0.074	my8031_rel_withdbg.cy10a_gcp_c2s60
0.000	0.000	54.639	44.137	1.223	0.000	0.000	0.000	0.000	0.000	0.054	my8031_rel_o2.cy10a_gcp_c2s60
0.000	0.000	54.138	44.696	1.166	nonzero	0.000	0.000	0.000	0.000	0.066	my8031_rel.cy10a_gcp_c2s60
0.000	0.000	59.217	39.947	0.837	0.000	0.000	0.000	0.000	0.000	0.052	my8031_rel_native.cy10a_gcp_c2s60
0.000	0.000	55.850	42.835	1.315	nonzero	0.000	0.000	0.000	0.000	0.065	my8031_rel_o2_lto.cy10a_gcp_c2s60
0.000	0.000	58.280	40.807	0.913	0.000	0.000	0.000	0.000	0.000	0.052	my8031_rel_lto.cy10a_gcp_c2s60
0.000	0.000	60.412	38.434	1.155	0.000	0.000	0.000	0.000	0.000	0.063	my8031_rel_native_lto.cy10a_gcp_c2s60