Introduction
This is a report for the insert benchmark with 400M docs and 20 client(s). It is generated by scripts (bash, awk, sed) and Tufte might not be impressed. An overview of the insert benchmark is here and a short update is here. Below, by DBMS, I mean DBMS+version.config. An example is my8020.c10b40 where my means MySQL, 8020 is version 8.0.20 and c10b40 is the name for the configuration file.
This is a report for the insert benchmark with 400M docs and 20 client(s). It is generated by scripts (bash, awk, sed) and Tufte might not be impressed. An overview of the insert benchmark is here and a short update is here. Below, by DBMS, I mean DBMS+version.config. An example is my8020.c10b40 where my means MySQL, 8020 is version 8.0.20 and c10b40 is the name for the configuration file.The test server is c2-standard-60 from GCP with 30 cores, hyperthreads disabled, 240G RAM and 3T of NVMe (XFS with RAID0 over 8 devices). The benchmark was run with 20 clients and there were 1 or 2 connections per client (1 for queries, 1 for inserts). It uses 20 tables with a client per table. It loads 20M rows per table without secondary indexes, creates secondary indexes, loads another 20M rows per table then does 3 read+write tests for one hour each that do queries as fast as possible with 100, 500 and then 1000 writes/second/client concurrent with the queries. The database is cached by the OS but not by InnoDB. Clients and the DBMS share one server. The per-database configs are in the per-database subdirectories here.
The tested DBMS are:
- my8031_rel_withdbg.cy10a_gcp_c2s60 - MySQL 8.0.31, the cy10a_gcp_c2s60 config and the build used CMAKE_BUILD_TYPE=RelWithDebInfo
- my8031_rel_o2.cy10a_gcp_c2s60 - MySQL 8.0.31, the cy10a_gcp_c2s60 config and the build used CMAKE_BUILD_TYPE=Release -O2
- my8031_rel.cy10a_gcp_c2s60 - MySQL 8.0.31, the cy10a_gcp_c2s60 config and the build used CMAKE_BUILD_TYPE=Release
- my8031_rel_native.cy10a_gcp_c2s60 - MySQL 8.0.31, the cy10a_gcp_c2s60 config and the build used CMAKE_BUILD_TYPE=Release -march=native -mtune=native
- my8031_rel_o2_lto.cy10a_gcp_c2s60 - MySQL 8.0.31, the cy10a_gcp_c2s60 config and the build used CMAKE_BUILD_TYPE=Release -flto -O2
- my8031_rel_lto.cy10a_gcp_c2s60 - MySQL 8.0.31, the cy10a_gcp_c2s60 config and the build used CMAKE_BUILD_TYPE=Release -flto
- my8031_rel_native_lto.cy10a_gcp_c2s60 - MySQL 8.0.31, the cy10a_gcp_c2s60 config and the build used CMAKE_BUILD_TYPE=Release -flto -march=native -mtune=native
Contents
- Summary
- l.i0: load without secondary indexes
- l.x: create secondary indexes
- l.i1: continue load after secondary indexes created
- q100.1: range queries with 100 insert/s per client
- q500.1: range queries with 500 insert/s per client
- q1000.1: range queries with 1000 insert/s per client
Summary
The numbers are inserts/s for l.i0 and l.i1, indexed docs (or rows) /s for l.x and queries/s for q*.2. The values are the average rate over the entire test for inserts (IPS) and queries (QPS). The range of values for IPS and QPS is split into 3 parts: bottom 25%, middle 50%, top 25%. Values in the bottom 25% have a red background, values in the top 25% have a green background and values in the middle have no color. A gray background is used for values that can be ignored because the DBMS did not sustain the target insert rate. Red backgrounds are not used when the minimum value is within 80% of the max value.
| dbms | l.i0 | l.x | l.i1 | q100.1 | q500.1 | q1000.1 |
|---|---|---|---|---|---|---|
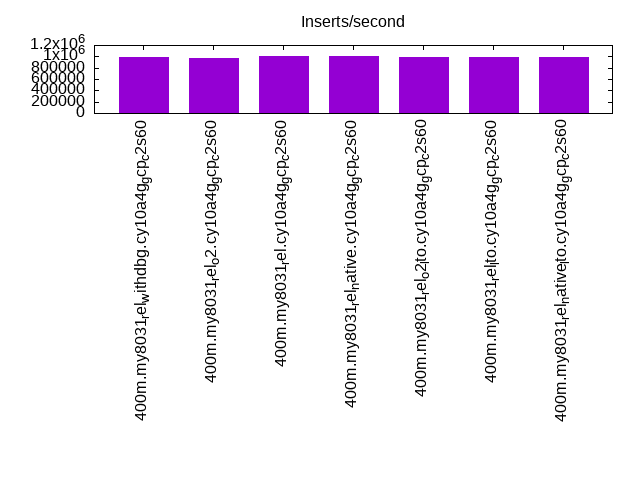
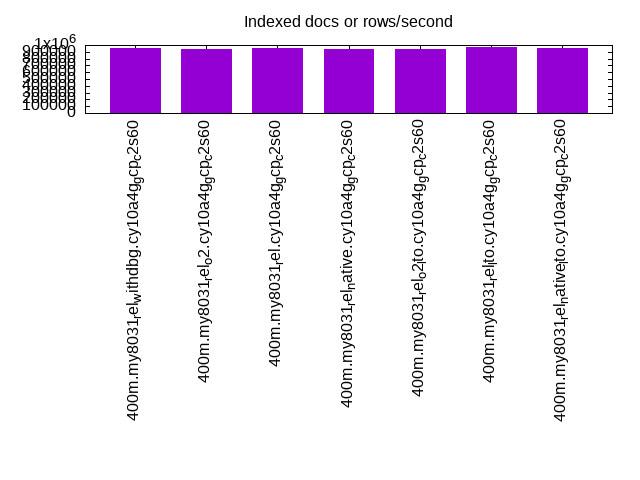
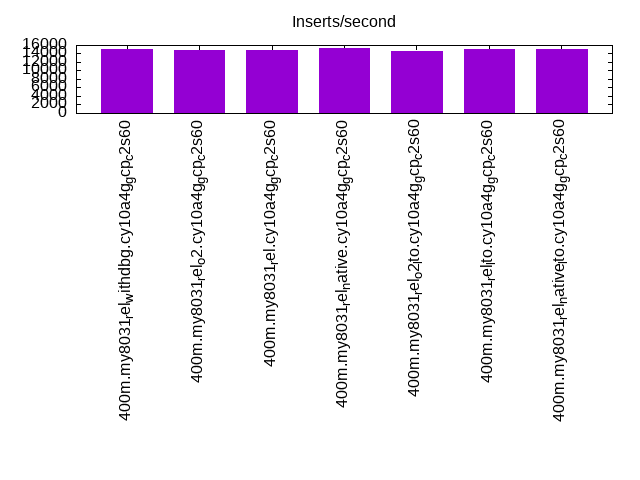
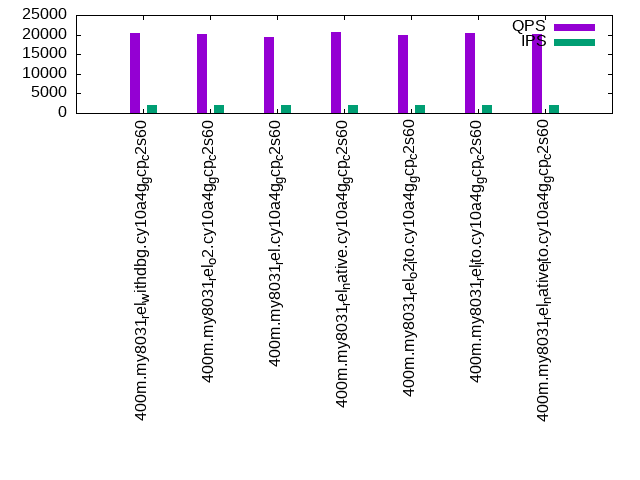
| 400m.my8031_rel_withdbg.cy10a4g_gcp_c2s60 | 992556 | 950356 | 14992 | 20377 | 1704 | 1382 |
| 400m.my8031_rel_o2.cy10a4g_gcp_c2s60 | 970874 | 943632 | 14938 | 20038 | 1710 | 1312 |
| 400m.my8031_rel.cy10a4g_gcp_c2s60 | 1000000 | 954893 | 14738 | 19476 | 1630 | 1275 |
| 400m.my8031_rel_native.cy10a4g_gcp_c2s60 | 1005025 | 948104 | 15206 | 20538 | 1701 | 1306 |
| 400m.my8031_rel_o2_lto.cy10a4g_gcp_c2s60 | 995025 | 943632 | 14705 | 19915 | 1647 | 1263 |
| 400m.my8031_rel_lto.cy10a4g_gcp_c2s60 | 985222 | 966425 | 15093 | 20454 | 1707 | 1319 |
| 400m.my8031_rel_native_lto.cy10a4g_gcp_c2s60 | 990099 | 957177 | 14979 | 20170 | 1674 | 1346 |
This table has relative throughput, throughput for the DBMS relative to the DBMS in the first line, using the absolute throughput from the previous table.
| dbms | l.i0 | l.x | l.i1 | q100.1 | q500.1 | q1000.1 |
|---|---|---|---|---|---|---|
| 400m.my8031_rel_withdbg.cy10a4g_gcp_c2s60 | 1.00 | 1.00 | 1.00 | 1.00 | 1.00 | 1.00 |
| 400m.my8031_rel_o2.cy10a4g_gcp_c2s60 | 0.98 | 0.99 | 1.00 | 0.98 | 1.00 | 0.95 |
| 400m.my8031_rel.cy10a4g_gcp_c2s60 | 1.01 | 1.00 | 0.98 | 0.96 | 0.96 | 0.92 |
| 400m.my8031_rel_native.cy10a4g_gcp_c2s60 | 1.01 | 1.00 | 1.01 | 1.01 | 1.00 | 0.95 |
| 400m.my8031_rel_o2_lto.cy10a4g_gcp_c2s60 | 1.00 | 0.99 | 0.98 | 0.98 | 0.97 | 0.91 |
| 400m.my8031_rel_lto.cy10a4g_gcp_c2s60 | 0.99 | 1.02 | 1.01 | 1.00 | 1.00 | 0.95 |
| 400m.my8031_rel_native_lto.cy10a4g_gcp_c2s60 | 1.00 | 1.01 | 1.00 | 0.99 | 0.98 | 0.97 |
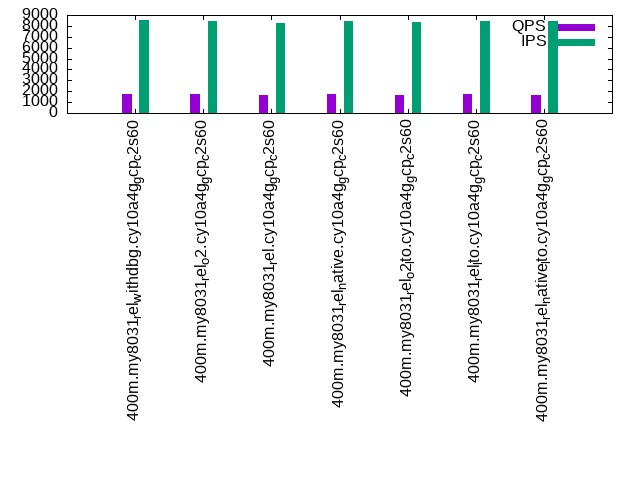
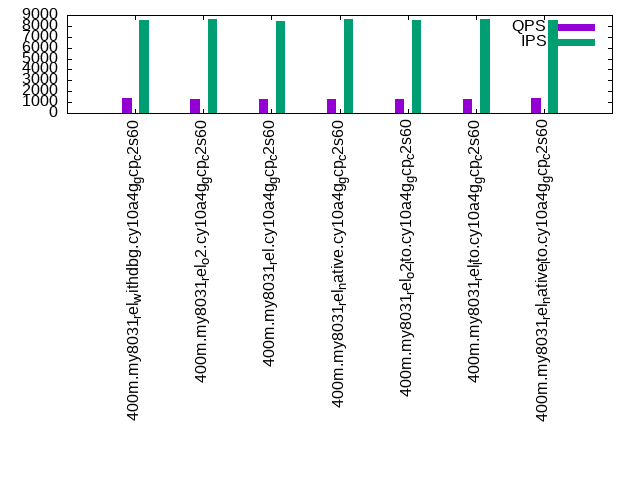
This lists the average rate of inserts/s for the tests that do inserts concurrent with queries. For such tests the query rate is listed in the table above. The read+write tests are setup so that the insert rate should match the target rate every second. Cells that are not at least 95% of the target have a red background to indicate a failure to satisfy the target.
| dbms | q100.1 | q500.1 | q1000.1 |
|---|---|---|---|
| my8031_rel_withdbg.cy10a4g_gcp_c2s60 | 1977 | 8535 | 8515 |
| my8031_rel_o2.cy10a4g_gcp_c2s60 | 1977 | 8411 | 8602 |
| my8031_rel.cy10a4g_gcp_c2s60 | 1977 | 8276 | 8409 |
| my8031_rel_native.cy10a4g_gcp_c2s60 | 1977 | 8463 | 8610 |
| my8031_rel_o2_lto.cy10a4g_gcp_c2s60 | 1977 | 8396 | 8529 |
| my8031_rel_lto.cy10a4g_gcp_c2s60 | 1977 | 8439 | 8662 |
| my8031_rel_native_lto.cy10a4g_gcp_c2s60 | 1977 | 8431 | 8515 |
| target | 2000 | 10000 | 20000 |
l.i0
l.i0: load without secondary indexes. Graphs for performance per 1-second interval are here.
Average throughput:
Insert response time histogram: each cell has the percentage of responses that take <= the time in the header and max is the max response time in seconds. For the max column values in the top 25% of the range have a red background and in the bottom 25% of the range have a green background. The red background is not used when the min value is within 80% of the max value.
| dbms | 256us | 1ms | 4ms | 16ms | 64ms | 256ms | 1s | 4s | 16s | gt | max |
|---|---|---|---|---|---|---|---|---|---|---|---|
| my8031_rel_withdbg.cy10a4g_gcp_c2s60 | 0.458 | 98.917 | 0.545 | 0.042 | 0.035 | 0.002 | 0.301 | ||||
| my8031_rel_o2.cy10a4g_gcp_c2s60 | 0.472 | 98.840 | 0.610 | 0.041 | 0.034 | 0.002 | 0.273 | ||||
| my8031_rel.cy10a4g_gcp_c2s60 | 0.645 | 98.723 | 0.552 | 0.044 | 0.033 | 0.003 | 0.288 | ||||
| my8031_rel_native.cy10a4g_gcp_c2s60 | 0.652 | 98.755 | 0.515 | 0.041 | 0.036 | 0.001 | 0.278 | ||||
| my8031_rel_o2_lto.cy10a4g_gcp_c2s60 | 0.555 | 98.832 | 0.532 | 0.044 | 0.035 | 0.002 | 0.282 | ||||
| my8031_rel_lto.cy10a4g_gcp_c2s60 | 0.639 | 98.738 | 0.541 | 0.047 | 0.034 | 0.003 | 0.288 | ||||
| my8031_rel_native_lto.cy10a4g_gcp_c2s60 | 0.611 | 98.770 | 0.535 | 0.046 | 0.036 | 0.001 | 0.285 |
Performance metrics for the DBMS listed above. Some are normalized by throughput, others are not. Legend for results is here.
ips	qps	rps	rmbps	wps	wmbps	rpq	rkbpq	wpi	wkbpi	csps	cpups	cspq	cpupq	dbgb1	dbgb2	rss	maxop	p50	p99	tag
992556	0	0	0.0	2530.7	270.9	0.000	0.000	0.003	0.279	222089	66.2	0.224	20	26.4	155.0	0.7	0.301	53741	38152	400m.my8031_rel_withdbg.cy10a4g_gcp_c2s60
970874	0	0	0.0	2486.1	263.6	0.000	0.000	0.003	0.278	226956	65.4	0.234	20	26.4	155.0	0.7	0.273	50844	37959	400m.my8031_rel_o2.cy10a4g_gcp_c2s60
1000000	0	0	0.0	2543.2	268.9	0.000	0.000	0.003	0.275	218851	66.0	0.219	20	26.4	155.0	0.7	0.288	53162	38657	400m.my8031_rel.cy10a4g_gcp_c2s60
1005025	0	0	0.0	2564.5	275.7	0.000	0.000	0.003	0.281	220926	66.1	0.220	20	26.4	155.0	0.7	0.278	55141	39271	400m.my8031_rel_native.cy10a4g_gcp_c2s60
995025	0	0	0.0	2543.0	271.9	0.000	0.000	0.003	0.280	221994	66.0	0.223	20	26.4	155.0	0.7	0.282	52641	37658	400m.my8031_rel_o2_lto.cy10a4g_gcp_c2s60
985222	0	0	0.0	2525.5	269.3	0.000	0.000	0.003	0.280	219555	65.7	0.223	20	26.4	155.0	0.7	0.288	53861	37559	400m.my8031_rel_lto.cy10a4g_gcp_c2s60
990099	0	0	0.0	2540.2	270.7	0.000	0.000	0.003	0.280	225109	66.2	0.227	20	26.4	155.0	0.7	0.285	54229	38058	400m.my8031_rel_native_lto.cy10a4g_gcp_c2s60
l.x
l.x: create secondary indexes.
Average throughput:
Performance metrics for the DBMS listed above. Some are normalized by throughput, others are not. Legend for results is here.
ips	qps	rps	rmbps	wps	wmbps	rpq	rkbpq	wpi	wkbpi	csps	cpups	cspq	cpupq	dbgb1	dbgb2	rss	maxop	p50	p99	tag
950356	0	4764	329.6	17910.6	909.8	0.005	0.355	0.019	0.980	141624	35.8	0.149	11	58.8	187.4	0.7	0.020	NA	NA	400m.my8031_rel_withdbg.cy10a4g_gcp_c2s60
943632	0	4765	329.5	17805.0	907.3	0.005	0.358	0.019	0.985	140548	40.8	0.149	13	58.8	187.4	0.7	0.013	NA	NA	400m.my8031_rel_o2.cy10a4g_gcp_c2s60
954893	0	4764	329.6	17832.2	909.9	0.005	0.353	0.019	0.976	139131	37.2	0.146	12	58.8	187.4	0.7	0.014	NA	NA	400m.my8031_rel.cy10a4g_gcp_c2s60
948104	0	4764	329.5	17855.5	910.4	0.005	0.356	0.019	0.983	141239	38.4	0.149	12	58.8	187.4	0.7	0.011	NA	NA	400m.my8031_rel_native.cy10a4g_gcp_c2s60
943632	0	4765	329.6	17754.8	909.2	0.005	0.358	0.019	0.987	142996	35.7	0.152	11	58.8	187.4	0.7	0.009	NA	NA	400m.my8031_rel_o2_lto.cy10a4g_gcp_c2s60
966425	0	4823	333.5	18018.0	921.4	0.005	0.353	0.019	0.976	139103	35.3	0.144	11	58.8	187.4	0.7	0.016	NA	NA	400m.my8031_rel_lto.cy10a4g_gcp_c2s60
957177	0	4822	333.7	18003.3	918.8	0.005	0.357	0.019	0.983	142013	35.7	0.148	11	58.8	187.4	0.7	0.025	NA	NA	400m.my8031_rel_native_lto.cy10a4g_gcp_c2s60
l.i1
l.i1: continue load after secondary indexes created. Graphs for performance per 1-second interval are here.
Average throughput:
Insert response time histogram: each cell has the percentage of responses that take <= the time in the header and max is the max response time in seconds. For the max column values in the top 25% of the range have a red background and in the bottom 25% of the range have a green background. The red background is not used when the min value is within 80% of the max value.
| dbms | 256us | 1ms | 4ms | 16ms | 64ms | 256ms | 1s | 4s | 16s | gt | max |
|---|---|---|---|---|---|---|---|---|---|---|---|
| my8031_rel_withdbg.cy10a4g_gcp_c2s60 | 0.551 | 10.437 | 55.250 | 31.016 | 2.746 | nonzero | 1.341 | ||||
| my8031_rel_o2.cy10a4g_gcp_c2s60 | 0.556 | 10.489 | 54.951 | 31.250 | 2.753 | nonzero | 1.166 | ||||
| my8031_rel.cy10a4g_gcp_c2s60 | 0.694 | 10.792 | 53.706 | 31.922 | 2.886 | nonzero | 1.416 | ||||
| my8031_rel_native.cy10a4g_gcp_c2s60 | 0.709 | 11.633 | 54.517 | 30.451 | 2.690 | nonzero | 1.218 | ||||
| my8031_rel_o2_lto.cy10a4g_gcp_c2s60 | 0.731 | 11.001 | 53.522 | 31.782 | 2.965 | nonzero | 1.270 | ||||
| my8031_rel_lto.cy10a4g_gcp_c2s60 | 0.696 | 10.464 | 54.933 | 31.289 | 2.617 | nonzero | 1.209 | ||||
| my8031_rel_native_lto.cy10a4g_gcp_c2s60 | 0.702 | 10.634 | 54.510 | 31.416 | 2.738 | nonzero | 1.233 |
Performance metrics for the DBMS listed above. Some are normalized by throughput, others are not. Legend for results is here.
ips	qps	rps	rmbps	wps	wmbps	rpq	rkbpq	wpi	wkbpi	csps	cpups	cspq	cpupq	dbgb1	dbgb2	rss	maxop	p50	p99	tag
14992	0	0	0.0	17069.3	399.2	0.000	0.001	1.139	27.265	271072	15.8	18.080	316	155.4	285.2	0.7	1.341	749	200	400m.my8031_rel_withdbg.cy10a4g_gcp_c2s60
14938	0	1	0.1	17023.1	397.8	0.000	0.005	1.140	27.271	273021	15.8	18.277	317	155.4	285.2	0.7	1.166	700	200	400m.my8031_rel_o2.cy10a4g_gcp_c2s60
14738	0	1	0.0	16584.5	392.3	0.000	0.001	1.125	27.258	273810	15.4	18.579	313	155.4	285.2	0.7	1.416	699	200	400m.my8031_rel.cy10a4g_gcp_c2s60
15206	0	1	0.1	17199.5	404.3	0.000	0.004	1.131	27.223	274855	15.6	18.075	308	155.3	285.2	0.7	1.218	749	200	400m.my8031_rel_native.cy10a4g_gcp_c2s60
14705	0	1	0.1	16839.6	392.7	0.000	0.004	1.145	27.349	272633	15.4	18.540	314	155.4	285.2	0.7	1.270	699	200	400m.my8031_rel_o2_lto.cy10a4g_gcp_c2s60
15093	0	2	0.1	17199.1	405.2	0.000	0.007	1.140	27.492	275486	15.7	18.253	312	155.4	285.2	0.7	1.209	749	200	400m.my8031_rel_lto.cy10a4g_gcp_c2s60
14979	0	1	0.1	17015.1	399.6	0.000	0.004	1.136	27.321	272764	15.5	18.210	310	155.4	285.2	0.7	1.233	700	200	400m.my8031_rel_native_lto.cy10a4g_gcp_c2s60
q100.1
q100.1: range queries with 100 insert/s per client. Graphs for performance per 1-second interval are here.
Average throughput:
Query response time histogram: each cell has the percentage of responses that take <= the time in the header and max is the max response time in seconds. For max values in the top 25% of the range have a red background and in the bottom 25% of the range have a green background. The red background is not used when the min value is within 80% of the max value.
| dbms | 256us | 1ms | 4ms | 16ms | 64ms | 256ms | 1s | 4s | 16s | gt | max |
|---|---|---|---|---|---|---|---|---|---|---|---|
| my8031_rel_withdbg.cy10a4g_gcp_c2s60 | 10.269 | 73.052 | 12.000 | 4.454 | 0.217 | 0.008 | nonzero | nonzero | 1.282 | ||
| my8031_rel_o2.cy10a4g_gcp_c2s60 | 9.742 | 73.297 | 12.207 | 4.527 | 0.218 | 0.008 | nonzero | 0.708 | |||
| my8031_rel.cy10a4g_gcp_c2s60 | 10.070 | 72.616 | 12.180 | 4.866 | 0.258 | 0.010 | nonzero | 0.809 | |||
| my8031_rel_native.cy10a4g_gcp_c2s60 | 9.720 | 73.907 | 11.709 | 4.451 | 0.205 | 0.008 | nonzero | 0.659 | |||
| my8031_rel_o2_lto.cy10a4g_gcp_c2s60 | 10.183 | 72.916 | 11.989 | 4.660 | 0.242 | 0.010 | nonzero | 0.641 | |||
| my8031_rel_lto.cy10a4g_gcp_c2s60 | 10.780 | 72.642 | 11.835 | 4.514 | 0.220 | 0.009 | nonzero | 0.748 | |||
| my8031_rel_native_lto.cy10a4g_gcp_c2s60 | 10.361 | 72.915 | 11.893 | 4.589 | 0.232 | 0.009 | nonzero | 0.623 |
Insert response time histogram: each cell has the percentage of responses that take <= the time in the header and max is the max response time in seconds. For max values in the top 25% of the range have a red background and in the bottom 25% of the range have a green background. The red background is not used when the min value is within 80% of the max value.
| dbms | 256us | 1ms | 4ms | 16ms | 64ms | 256ms | 1s | 4s | 16s | gt | max |
|---|---|---|---|---|---|---|---|---|---|---|---|
| my8031_rel_withdbg.cy10a4g_gcp_c2s60 | 0.281 | 31.279 | 52.183 | 14.707 | 1.501 | 0.049 | 2.481 | ||||
| my8031_rel_o2.cy10a4g_gcp_c2s60 | 0.065 | 24.826 | 55.761 | 17.953 | 1.358 | 0.036 | 1.693 | ||||
| my8031_rel.cy10a4g_gcp_c2s60 | 0.182 | 26.175 | 54.529 | 17.394 | 1.688 | 0.032 | 2.223 | ||||
| my8031_rel_native.cy10a4g_gcp_c2s60 | 0.146 | 30.625 | 52.782 | 14.996 | 1.426 | 0.025 | 1.654 | ||||
| my8031_rel_o2_lto.cy10a4g_gcp_c2s60 | 0.107 | 28.728 | 52.792 | 16.650 | 1.686 | 0.037 | 1.562 | ||||
| my8031_rel_lto.cy10a4g_gcp_c2s60 | 0.224 | 27.593 | 54.632 | 15.950 | 1.561 | 0.040 | 1.743 | ||||
| my8031_rel_native_lto.cy10a4g_gcp_c2s60 | 0.171 | 30.090 | 52.681 | 15.549 | 1.469 | 0.040 | 1.853 |
Performance metrics for the DBMS listed above. Some are normalized by throughput, others are not. Legend for results is here.
ips	qps	rps	rmbps	wps	wmbps	rpq	rkbpq	wpi	wkbpi	csps	cpups	cspq	cpupq	dbgb1	dbgb2	rss	maxop	p50	p99	tag
1977	20377	68	1.3	11007.6	233.4	0.003	0.064	5.568	120.886	247768	32.1	12.159	473	157.9	287.7	0.7	1.282	1215	96	400m.my8031_rel_withdbg.cy10a4g_gcp_c2s60
1977	20038	80	1.5	10860.2	231.0	0.004	0.078	5.494	119.634	247008	32.3	12.327	484	157.9	287.7	0.7	0.708	1183	96	400m.my8031_rel_o2.cy10a4g_gcp_c2s60
1977	19476	90	1.7	10896.7	231.1	0.005	0.088	5.512	119.720	250013	31.0	12.837	478	157.9	287.7	0.7	0.809	1167	80	400m.my8031_rel.cy10a4g_gcp_c2s60
1977	20538	72	1.4	10855.2	230.5	0.004	0.069	5.491	119.399	245967	32.4	11.976	473	157.9	287.7	0.7	0.659	1213	80	400m.my8031_rel_native.cy10a4g_gcp_c2s60
1977	19915	67	1.3	10926.2	230.9	0.003	0.067	5.527	119.604	250761	31.6	12.592	476	157.9	287.7	0.7	0.641	1183	80	400m.my8031_rel_o2_lto.cy10a4g_gcp_c2s60
1977	20454	62	1.2	11063.7	234.2	0.003	0.062	5.596	121.319	251401	31.8	12.291	466	157.9	287.7	0.7	0.748	1215	96	400m.my8031_rel_lto.cy10a4g_gcp_c2s60
1977	20170	70	1.3	11019.7	233.2	0.003	0.068	5.574	120.772	249095	31.6	12.350	470	157.9	287.7	0.7	0.623	1215	96	400m.my8031_rel_native_lto.cy10a4g_gcp_c2s60
q500.1
q500.1: range queries with 500 insert/s per client. Graphs for performance per 1-second interval are here.
Average throughput:
Query response time histogram: each cell has the percentage of responses that take <= the time in the header and max is the max response time in seconds. For max values in the top 25% of the range have a red background and in the bottom 25% of the range have a green background. The red background is not used when the min value is within 80% of the max value.
| dbms | 256us | 1ms | 4ms | 16ms | 64ms | 256ms | 1s | 4s | 16s | gt | max |
|---|---|---|---|---|---|---|---|---|---|---|---|
| my8031_rel_withdbg.cy10a4g_gcp_c2s60 | 4.917 | 15.372 | 11.947 | 45.103 | 21.308 | 1.326 | 0.027 | 0.967 | |||
| my8031_rel_o2.cy10a4g_gcp_c2s60 | 6.307 | 15.243 | 11.892 | 44.423 | 20.779 | 1.331 | 0.025 | 0.964 | |||
| my8031_rel.cy10a4g_gcp_c2s60 | 5.321 | 14.782 | 11.271 | 44.951 | 22.190 | 1.460 | 0.027 | 0.790 | |||
| my8031_rel_native.cy10a4g_gcp_c2s60 | 5.068 | 15.622 | 11.938 | 44.787 | 21.271 | 1.290 | 0.025 | 0.752 | |||
| my8031_rel_o2_lto.cy10a4g_gcp_c2s60 | 4.992 | 15.012 | 11.317 | 45.232 | 21.963 | 1.455 | 0.030 | 0.893 | |||
| my8031_rel_lto.cy10a4g_gcp_c2s60 | 5.903 | 14.954 | 11.847 | 44.949 | 21.038 | 1.284 | 0.025 | nonzero | 1.096 | ||
| my8031_rel_native_lto.cy10a4g_gcp_c2s60 | 5.197 | 15.080 | 11.610 | 45.167 | 21.549 | 1.370 | 0.026 | 0.917 |
Insert response time histogram: each cell has the percentage of responses that take <= the time in the header and max is the max response time in seconds. For max values in the top 25% of the range have a red background and in the bottom 25% of the range have a green background. The red background is not used when the min value is within 80% of the max value.
| dbms | 256us | 1ms | 4ms | 16ms | 64ms | 256ms | 1s | 4s | 16s | gt | max |
|---|---|---|---|---|---|---|---|---|---|---|---|
| my8031_rel_withdbg.cy10a4g_gcp_c2s60 | 0.074 | 1.931 | 36.473 | 53.803 | 7.692 | 0.027 | 2.029 | ||||
| my8031_rel_o2.cy10a4g_gcp_c2s60 | 0.112 | 1.993 | 36.635 | 53.433 | 7.801 | 0.027 | 1.446 | ||||
| my8031_rel.cy10a4g_gcp_c2s60 | 0.111 | 2.178 | 35.134 | 54.546 | 8.007 | 0.024 | 1.655 | ||||
| my8031_rel_native.cy10a4g_gcp_c2s60 | 0.111 | 2.007 | 36.251 | 53.998 | 7.614 | 0.018 | 1.759 | ||||
| my8031_rel_o2_lto.cy10a4g_gcp_c2s60 | 0.104 | 2.209 | 36.177 | 53.457 | 8.029 | 0.024 | 1.686 | ||||
| my8031_rel_lto.cy10a4g_gcp_c2s60 | 0.129 | 2.139 | 36.653 | 53.373 | 7.685 | 0.020 | 1.759 | ||||
| my8031_rel_native_lto.cy10a4g_gcp_c2s60 | 0.120 | 2.177 | 36.341 | 53.552 | 7.783 | 0.027 | 1.705 |
Performance metrics for the DBMS listed above. Some are normalized by throughput, others are not. Legend for results is here.
ips	qps	rps	rmbps	wps	wmbps	rpq	rkbpq	wpi	wkbpi	csps	cpups	cspq	cpupq	dbgb1	dbgb2	rss	maxop	p50	p99	tag
8535	1704	208	3.7	17623.6	344.2	0.122	2.227	2.065	41.301	359650	18.6	211.025	3274	165.7	295.5	0.7	0.967	64	48	400m.my8031_rel_withdbg.cy10a4g_gcp_c2s60
8411	1710	228	4.0	17536.0	342.9	0.134	2.382	2.085	41.747	359029	18.4	209.971	3228	165.7	295.5	0.7	0.964	64	48	400m.my8031_rel_o2.cy10a4g_gcp_c2s60
8276	1630	210	3.6	17094.4	335.3	0.129	2.250	2.066	41.484	363918	18.1	223.290	3332	165.7	295.5	0.7	0.790	64	48	400m.my8031_rel.cy10a4g_gcp_c2s60
8463	1701	231	4.1	17445.2	344.2	0.136	2.448	2.061	41.645	352169	18.5	207.000	3262	165.7	295.5	0.7	0.752	64	48	400m.my8031_rel_native.cy10a4g_gcp_c2s60
8396	1647	206	3.6	17375.3	337.8	0.125	2.268	2.070	41.205	365220	18.3	221.695	3333	165.6	295.5	0.7	0.893	64	48	400m.my8031_rel_o2_lto.cy10a4g_gcp_c2s60
8439	1707	190	3.4	17519.2	344.0	0.111	2.061	2.076	41.744	359983	18.3	210.923	3217	165.7	295.5	0.7	1.096	64	48	400m.my8031_rel_lto.cy10a4g_gcp_c2s60
8431	1674	200	3.5	17459.9	341.5	0.120	2.152	2.071	41.480	356998	18.3	213.248	3279	165.7	295.5	0.7	0.917	64	48	400m.my8031_rel_native_lto.cy10a4g_gcp_c2s60
q1000.1
q1000.1: range queries with 1000 insert/s per client. Graphs for performance per 1-second interval are here.
Average throughput:
Query response time histogram: each cell has the percentage of responses that take <= the time in the header and max is the max response time in seconds. For max values in the top 25% of the range have a red background and in the bottom 25% of the range have a green background. The red background is not used when the min value is within 80% of the max value.
| dbms | 256us | 1ms | 4ms | 16ms | 64ms | 256ms | 1s | 4s | 16s | gt | max |
|---|---|---|---|---|---|---|---|---|---|---|---|
| my8031_rel_withdbg.cy10a4g_gcp_c2s60 | 12.992 | 9.995 | 11.549 | 42.259 | 20.504 | 2.317 | 0.384 | nonzero | 1.318 | ||
| my8031_rel_o2.cy10a4g_gcp_c2s60 | 6.624 | 11.000 | 12.347 | 45.183 | 21.929 | 2.510 | 0.408 | nonzero | 1.401 | ||
| my8031_rel.cy10a4g_gcp_c2s60 | 7.359 | 10.505 | 11.348 | 44.898 | 22.849 | 2.606 | 0.435 | nonzero | 1.415 | ||
| my8031_rel_native.cy10a4g_gcp_c2s60 | 4.882 | 11.322 | 12.531 | 45.842 | 22.574 | 2.460 | 0.389 | nonzero | 1.141 | ||
| my8031_rel_o2_lto.cy10a4g_gcp_c2s60 | 6.423 | 10.392 | 11.554 | 45.982 | 22.571 | 2.616 | 0.463 | nonzero | 1.345 | ||
| my8031_rel_lto.cy10a4g_gcp_c2s60 | 8.428 | 10.230 | 11.912 | 44.826 | 21.746 | 2.443 | 0.414 | nonzero | 1.275 | ||
| my8031_rel_native_lto.cy10a4g_gcp_c2s60 | 11.998 | 9.998 | 11.417 | 42.799 | 20.990 | 2.391 | 0.407 | nonzero | 1.283 |
Insert response time histogram: each cell has the percentage of responses that take <= the time in the header and max is the max response time in seconds. For max values in the top 25% of the range have a red background and in the bottom 25% of the range have a green background. The red background is not used when the min value is within 80% of the max value.
| dbms | 256us | 1ms | 4ms | 16ms | 64ms | 256ms | 1s | 4s | 16s | gt | max |
|---|---|---|---|---|---|---|---|---|---|---|---|
| my8031_rel_withdbg.cy10a4g_gcp_c2s60 | 0.574 | 6.090 | 43.994 | 37.184 | 12.103 | 0.055 | 1.668 | ||||
| my8031_rel_o2.cy10a4g_gcp_c2s60 | 0.376 | 5.494 | 44.252 | 37.713 | 12.108 | 0.056 | 1.873 | ||||
| my8031_rel.cy10a4g_gcp_c2s60 | 0.465 | 5.576 | 43.132 | 38.182 | 12.574 | 0.071 | 2.281 | ||||
| my8031_rel_native.cy10a4g_gcp_c2s60 | 0.347 | 5.028 | 43.703 | 38.946 | 11.927 | 0.050 | 1.955 | ||||
| my8031_rel_o2_lto.cy10a4g_gcp_c2s60 | 0.487 | 7.024 | 43.831 | 35.830 | 12.763 | 0.064 | 1.798 | ||||
| my8031_rel_lto.cy10a4g_gcp_c2s60 | 0.549 | 6.723 | 43.697 | 36.970 | 12.005 | 0.057 | 1.935 | ||||
| my8031_rel_native_lto.cy10a4g_gcp_c2s60 | 0.665 | 6.904 | 43.452 | 36.790 | 12.130 | 0.060 | 2.128 |
Performance metrics for the DBMS listed above. Some are normalized by throughput, others are not. Legend for results is here.
ips	qps	rps	rmbps	wps	wmbps	rpq	rkbpq	wpi	wkbpi	csps	cpups	cspq	cpupq	dbgb1	dbgb2	rss	maxop	p50	p99	tag
8515	1382	293	6.3	15770.4	332.2	0.212	4.695	1.852	39.957	324076	17.2	234.413	3732	174.4	304.2	0.7	1.318	64	16	400m.my8031_rel_withdbg.cy10a4g_gcp_c2s60
8602	1312	303	6.5	15802.0	332.9	0.231	5.035	1.837	39.623	331264	17.6	252.469	4024	174.4	304.2	0.7	1.401	64	16	400m.my8031_rel_o2.cy10a4g_gcp_c2s60
8409	1275	288	6.3	15429.2	325.2	0.226	5.060	1.835	39.595	333225	17.1	261.374	4024	174.4	304.2	0.7	1.415	64	16	400m.my8031_rel.cy10a4g_gcp_c2s60
8610	1306	300	6.3	15701.3	333.6	0.230	4.945	1.824	39.677	328498	17.6	251.588	4044	174.4	304.2	0.7	1.141	64	16	400m.my8031_rel_native.cy10a4g_gcp_c2s60
8529	1263	292	6.4	15798.9	330.0	0.232	5.185	1.852	39.624	332287	16.9	263.177	4016	174.4	304.2	0.7	1.345	64	16	400m.my8031_rel_o2_lto.cy10a4g_gcp_c2s60
8662	1319	286	6.1	15882.7	334.9	0.217	4.769	1.834	39.594	329607	17.1	249.854	3889	174.4	304.2	0.7	1.275	64	16	400m.my8031_rel_lto.cy10a4g_gcp_c2s60
8515	1346	287	6.3	15703.3	330.9	0.213	4.808	1.844	39.791	323009	16.8	239.942	3744	174.4	304.2	0.7	1.283	64	16	400m.my8031_rel_native_lto.cy10a4g_gcp_c2s60
l.i0
l.i0: load without secondary indexes
Performance metrics for all DBMS, not just the ones listed above. Some are normalized by throughput, others are not. Legend for results is here.
ips	qps	rps	rmbps	wps	wmbps	rpq	rkbpq	wpi	wkbpi	csps	cpups	cspq	cpupq	dbgb1	dbgb2	rss	maxop	p50	p99	tag
992556	0	0	0.0	2530.7	270.9	0.000	0.000	0.003	0.279	222089	66.2	0.224	20	26.4	155.0	0.7	0.301	53741	38152	400m.my8031_rel_withdbg.cy10a4g_gcp_c2s60
970874	0	0	0.0	2486.1	263.6	0.000	0.000	0.003	0.278	226956	65.4	0.234	20	26.4	155.0	0.7	0.273	50844	37959	400m.my8031_rel_o2.cy10a4g_gcp_c2s60
1000000	0	0	0.0	2543.2	268.9	0.000	0.000	0.003	0.275	218851	66.0	0.219	20	26.4	155.0	0.7	0.288	53162	38657	400m.my8031_rel.cy10a4g_gcp_c2s60
1005025	0	0	0.0	2564.5	275.7	0.000	0.000	0.003	0.281	220926	66.1	0.220	20	26.4	155.0	0.7	0.278	55141	39271	400m.my8031_rel_native.cy10a4g_gcp_c2s60
995025	0	0	0.0	2543.0	271.9	0.000	0.000	0.003	0.280	221994	66.0	0.223	20	26.4	155.0	0.7	0.282	52641	37658	400m.my8031_rel_o2_lto.cy10a4g_gcp_c2s60
985222	0	0	0.0	2525.5	269.3	0.000	0.000	0.003	0.280	219555	65.7	0.223	20	26.4	155.0	0.7	0.288	53861	37559	400m.my8031_rel_lto.cy10a4g_gcp_c2s60
990099	0	0	0.0	2540.2	270.7	0.000	0.000	0.003	0.280	225109	66.2	0.227	20	26.4	155.0	0.7	0.285	54229	38058	400m.my8031_rel_native_lto.cy10a4g_gcp_c2s60
l.x
l.x: create secondary indexes
Performance metrics for all DBMS, not just the ones listed above. Some are normalized by throughput, others are not. Legend for results is here.
ips	qps	rps	rmbps	wps	wmbps	rpq	rkbpq	wpi	wkbpi	csps	cpups	cspq	cpupq	dbgb1	dbgb2	rss	maxop	p50	p99	tag
950356	0	4764	329.6	17910.6	909.8	0.005	0.355	0.019	0.980	141624	35.8	0.149	11	58.8	187.4	0.7	0.020	NA	NA	400m.my8031_rel_withdbg.cy10a4g_gcp_c2s60
943632	0	4765	329.5	17805.0	907.3	0.005	0.358	0.019	0.985	140548	40.8	0.149	13	58.8	187.4	0.7	0.013	NA	NA	400m.my8031_rel_o2.cy10a4g_gcp_c2s60
954893	0	4764	329.6	17832.2	909.9	0.005	0.353	0.019	0.976	139131	37.2	0.146	12	58.8	187.4	0.7	0.014	NA	NA	400m.my8031_rel.cy10a4g_gcp_c2s60
948104	0	4764	329.5	17855.5	910.4	0.005	0.356	0.019	0.983	141239	38.4	0.149	12	58.8	187.4	0.7	0.011	NA	NA	400m.my8031_rel_native.cy10a4g_gcp_c2s60
943632	0	4765	329.6	17754.8	909.2	0.005	0.358	0.019	0.987	142996	35.7	0.152	11	58.8	187.4	0.7	0.009	NA	NA	400m.my8031_rel_o2_lto.cy10a4g_gcp_c2s60
966425	0	4823	333.5	18018.0	921.4	0.005	0.353	0.019	0.976	139103	35.3	0.144	11	58.8	187.4	0.7	0.016	NA	NA	400m.my8031_rel_lto.cy10a4g_gcp_c2s60
957177	0	4822	333.7	18003.3	918.8	0.005	0.357	0.019	0.983	142013	35.7	0.148	11	58.8	187.4	0.7	0.025	NA	NA	400m.my8031_rel_native_lto.cy10a4g_gcp_c2s60
l.i1
l.i1: continue load after secondary indexes created
Performance metrics for all DBMS, not just the ones listed above. Some are normalized by throughput, others are not. Legend for results is here.
ips	qps	rps	rmbps	wps	wmbps	rpq	rkbpq	wpi	wkbpi	csps	cpups	cspq	cpupq	dbgb1	dbgb2	rss	maxop	p50	p99	tag
14992	0	0	0.0	17069.3	399.2	0.000	0.001	1.139	27.265	271072	15.8	18.080	316	155.4	285.2	0.7	1.341	749	200	400m.my8031_rel_withdbg.cy10a4g_gcp_c2s60
14938	0	1	0.1	17023.1	397.8	0.000	0.005	1.140	27.271	273021	15.8	18.277	317	155.4	285.2	0.7	1.166	700	200	400m.my8031_rel_o2.cy10a4g_gcp_c2s60
14738	0	1	0.0	16584.5	392.3	0.000	0.001	1.125	27.258	273810	15.4	18.579	313	155.4	285.2	0.7	1.416	699	200	400m.my8031_rel.cy10a4g_gcp_c2s60
15206	0	1	0.1	17199.5	404.3	0.000	0.004	1.131	27.223	274855	15.6	18.075	308	155.3	285.2	0.7	1.218	749	200	400m.my8031_rel_native.cy10a4g_gcp_c2s60
14705	0	1	0.1	16839.6	392.7	0.000	0.004	1.145	27.349	272633	15.4	18.540	314	155.4	285.2	0.7	1.270	699	200	400m.my8031_rel_o2_lto.cy10a4g_gcp_c2s60
15093	0	2	0.1	17199.1	405.2	0.000	0.007	1.140	27.492	275486	15.7	18.253	312	155.4	285.2	0.7	1.209	749	200	400m.my8031_rel_lto.cy10a4g_gcp_c2s60
14979	0	1	0.1	17015.1	399.6	0.000	0.004	1.136	27.321	272764	15.5	18.210	310	155.4	285.2	0.7	1.233	700	200	400m.my8031_rel_native_lto.cy10a4g_gcp_c2s60
q100.1
q100.1: range queries with 100 insert/s per client
Performance metrics for all DBMS, not just the ones listed above. Some are normalized by throughput, others are not. Legend for results is here.
ips	qps	rps	rmbps	wps	wmbps	rpq	rkbpq	wpi	wkbpi	csps	cpups	cspq	cpupq	dbgb1	dbgb2	rss	maxop	p50	p99	tag
1977	20377	68	1.3	11007.6	233.4	0.003	0.064	5.568	120.886	247768	32.1	12.159	473	157.9	287.7	0.7	1.282	1215	96	400m.my8031_rel_withdbg.cy10a4g_gcp_c2s60
1977	20038	80	1.5	10860.2	231.0	0.004	0.078	5.494	119.634	247008	32.3	12.327	484	157.9	287.7	0.7	0.708	1183	96	400m.my8031_rel_o2.cy10a4g_gcp_c2s60
1977	19476	90	1.7	10896.7	231.1	0.005	0.088	5.512	119.720	250013	31.0	12.837	478	157.9	287.7	0.7	0.809	1167	80	400m.my8031_rel.cy10a4g_gcp_c2s60
1977	20538	72	1.4	10855.2	230.5	0.004	0.069	5.491	119.399	245967	32.4	11.976	473	157.9	287.7	0.7	0.659	1213	80	400m.my8031_rel_native.cy10a4g_gcp_c2s60
1977	19915	67	1.3	10926.2	230.9	0.003	0.067	5.527	119.604	250761	31.6	12.592	476	157.9	287.7	0.7	0.641	1183	80	400m.my8031_rel_o2_lto.cy10a4g_gcp_c2s60
1977	20454	62	1.2	11063.7	234.2	0.003	0.062	5.596	121.319	251401	31.8	12.291	466	157.9	287.7	0.7	0.748	1215	96	400m.my8031_rel_lto.cy10a4g_gcp_c2s60
1977	20170	70	1.3	11019.7	233.2	0.003	0.068	5.574	120.772	249095	31.6	12.350	470	157.9	287.7	0.7	0.623	1215	96	400m.my8031_rel_native_lto.cy10a4g_gcp_c2s60
q500.1
q500.1: range queries with 500 insert/s per client
Performance metrics for all DBMS, not just the ones listed above. Some are normalized by throughput, others are not. Legend for results is here.
ips	qps	rps	rmbps	wps	wmbps	rpq	rkbpq	wpi	wkbpi	csps	cpups	cspq	cpupq	dbgb1	dbgb2	rss	maxop	p50	p99	tag
8535	1704	208	3.7	17623.6	344.2	0.122	2.227	2.065	41.301	359650	18.6	211.025	3274	165.7	295.5	0.7	0.967	64	48	400m.my8031_rel_withdbg.cy10a4g_gcp_c2s60
8411	1710	228	4.0	17536.0	342.9	0.134	2.382	2.085	41.747	359029	18.4	209.971	3228	165.7	295.5	0.7	0.964	64	48	400m.my8031_rel_o2.cy10a4g_gcp_c2s60
8276	1630	210	3.6	17094.4	335.3	0.129	2.250	2.066	41.484	363918	18.1	223.290	3332	165.7	295.5	0.7	0.790	64	48	400m.my8031_rel.cy10a4g_gcp_c2s60
8463	1701	231	4.1	17445.2	344.2	0.136	2.448	2.061	41.645	352169	18.5	207.000	3262	165.7	295.5	0.7	0.752	64	48	400m.my8031_rel_native.cy10a4g_gcp_c2s60
8396	1647	206	3.6	17375.3	337.8	0.125	2.268	2.070	41.205	365220	18.3	221.695	3333	165.6	295.5	0.7	0.893	64	48	400m.my8031_rel_o2_lto.cy10a4g_gcp_c2s60
8439	1707	190	3.4	17519.2	344.0	0.111	2.061	2.076	41.744	359983	18.3	210.923	3217	165.7	295.5	0.7	1.096	64	48	400m.my8031_rel_lto.cy10a4g_gcp_c2s60
8431	1674	200	3.5	17459.9	341.5	0.120	2.152	2.071	41.480	356998	18.3	213.248	3279	165.7	295.5	0.7	0.917	64	48	400m.my8031_rel_native_lto.cy10a4g_gcp_c2s60
q1000.1
q1000.1: range queries with 1000 insert/s per client
Performance metrics for all DBMS, not just the ones listed above. Some are normalized by throughput, others are not. Legend for results is here.
ips	qps	rps	rmbps	wps	wmbps	rpq	rkbpq	wpi	wkbpi	csps	cpups	cspq	cpupq	dbgb1	dbgb2	rss	maxop	p50	p99	tag
8515	1382	293	6.3	15770.4	332.2	0.212	4.695	1.852	39.957	324076	17.2	234.413	3732	174.4	304.2	0.7	1.318	64	16	400m.my8031_rel_withdbg.cy10a4g_gcp_c2s60
8602	1312	303	6.5	15802.0	332.9	0.231	5.035	1.837	39.623	331264	17.6	252.469	4024	174.4	304.2	0.7	1.401	64	16	400m.my8031_rel_o2.cy10a4g_gcp_c2s60
8409	1275	288	6.3	15429.2	325.2	0.226	5.060	1.835	39.595	333225	17.1	261.374	4024	174.4	304.2	0.7	1.415	64	16	400m.my8031_rel.cy10a4g_gcp_c2s60
8610	1306	300	6.3	15701.3	333.6	0.230	4.945	1.824	39.677	328498	17.6	251.588	4044	174.4	304.2	0.7	1.141	64	16	400m.my8031_rel_native.cy10a4g_gcp_c2s60
8529	1263	292	6.4	15798.9	330.0	0.232	5.185	1.852	39.624	332287	16.9	263.177	4016	174.4	304.2	0.7	1.345	64	16	400m.my8031_rel_o2_lto.cy10a4g_gcp_c2s60
8662	1319	286	6.1	15882.7	334.9	0.217	4.769	1.834	39.594	329607	17.1	249.854	3889	174.4	304.2	0.7	1.275	64	16	400m.my8031_rel_lto.cy10a4g_gcp_c2s60
8515	1346	287	6.3	15703.3	330.9	0.213	4.808	1.844	39.791	323009	16.8	239.942	3744	174.4	304.2	0.7	1.283	64	16	400m.my8031_rel_native_lto.cy10a4g_gcp_c2s60
l.i0
- l.i0: load without secondary indexes
- Legend for results is here.
- Each entry lists the percentage of responses that fit in that bucket (slower than max time for previous bucket, faster than min time for next bucket).
Insert response time histogram
256us	1ms	4ms	16ms	64ms	256ms	1s	4s	16s	gt	max	tag
0.000	0.458	98.917	0.545	0.042	0.035	0.002	0.000	0.000	0.000	0.301	my8031_rel_withdbg.cy10a4g_gcp_c2s60
0.000	0.472	98.840	0.610	0.041	0.034	0.002	0.000	0.000	0.000	0.273	my8031_rel_o2.cy10a4g_gcp_c2s60
0.000	0.645	98.723	0.552	0.044	0.033	0.003	0.000	0.000	0.000	0.288	my8031_rel.cy10a4g_gcp_c2s60
0.000	0.652	98.755	0.515	0.041	0.036	0.001	0.000	0.000	0.000	0.278	my8031_rel_native.cy10a4g_gcp_c2s60
0.000	0.555	98.832	0.532	0.044	0.035	0.002	0.000	0.000	0.000	0.282	my8031_rel_o2_lto.cy10a4g_gcp_c2s60
0.000	0.639	98.738	0.541	0.047	0.034	0.003	0.000	0.000	0.000	0.288	my8031_rel_lto.cy10a4g_gcp_c2s60
0.000	0.611	98.770	0.535	0.046	0.036	0.001	0.000	0.000	0.000	0.285	my8031_rel_native_lto.cy10a4g_gcp_c2s60
l.x
- l.x: create secondary indexes
- Legend for results is here.
- Each entry lists the percentage of responses that fit in that bucket (slower than max time for previous bucket, faster than min time for next bucket).
TODO - determine whether there is data for create index response time
l.i1
- l.i1: continue load after secondary indexes created
- Legend for results is here.
- Each entry lists the percentage of responses that fit in that bucket (slower than max time for previous bucket, faster than min time for next bucket).
Insert response time histogram
256us	1ms	4ms	16ms	64ms	256ms	1s	4s	16s	gt	max	tag
0.000	0.000	0.551	10.437	55.250	31.016	2.746	nonzero	0.000	0.000	1.341	my8031_rel_withdbg.cy10a4g_gcp_c2s60
0.000	0.000	0.556	10.489	54.951	31.250	2.753	nonzero	0.000	0.000	1.166	my8031_rel_o2.cy10a4g_gcp_c2s60
0.000	0.000	0.694	10.792	53.706	31.922	2.886	nonzero	0.000	0.000	1.416	my8031_rel.cy10a4g_gcp_c2s60
0.000	0.000	0.709	11.633	54.517	30.451	2.690	nonzero	0.000	0.000	1.218	my8031_rel_native.cy10a4g_gcp_c2s60
0.000	0.000	0.731	11.001	53.522	31.782	2.965	nonzero	0.000	0.000	1.270	my8031_rel_o2_lto.cy10a4g_gcp_c2s60
0.000	0.000	0.696	10.464	54.933	31.289	2.617	nonzero	0.000	0.000	1.209	my8031_rel_lto.cy10a4g_gcp_c2s60
0.000	0.000	0.702	10.634	54.510	31.416	2.738	nonzero	0.000	0.000	1.233	my8031_rel_native_lto.cy10a4g_gcp_c2s60
q100.1
- q100.1: range queries with 100 insert/s per client
- Legend for results is here.
- Each entry lists the percentage of responses that fit in that bucket (slower than max time for previous bucket, faster than min time for next bucket).
Query response time histogram
256us	1ms	4ms	16ms	64ms	256ms	1s	4s	16s	gt	max	tag
10.269	73.052	12.000	4.454	0.217	0.008	nonzero	nonzero	0.000	0.000	1.282	my8031_rel_withdbg.cy10a4g_gcp_c2s60
9.742	73.297	12.207	4.527	0.218	0.008	nonzero	0.000	0.000	0.000	0.708	my8031_rel_o2.cy10a4g_gcp_c2s60
10.070	72.616	12.180	4.866	0.258	0.010	nonzero	0.000	0.000	0.000	0.809	my8031_rel.cy10a4g_gcp_c2s60
9.720	73.907	11.709	4.451	0.205	0.008	nonzero	0.000	0.000	0.000	0.659	my8031_rel_native.cy10a4g_gcp_c2s60
10.183	72.916	11.989	4.660	0.242	0.010	nonzero	0.000	0.000	0.000	0.641	my8031_rel_o2_lto.cy10a4g_gcp_c2s60
10.780	72.642	11.835	4.514	0.220	0.009	nonzero	0.000	0.000	0.000	0.748	my8031_rel_lto.cy10a4g_gcp_c2s60
10.361	72.915	11.893	4.589	0.232	0.009	nonzero	0.000	0.000	0.000	0.623	my8031_rel_native_lto.cy10a4g_gcp_c2s60
Insert response time histogram
256us	1ms	4ms	16ms	64ms	256ms	1s	4s	16s	gt	max	tag
0.000	0.000	0.281	31.279	52.183	14.707	1.501	0.049	0.000	0.000	2.481	my8031_rel_withdbg.cy10a4g_gcp_c2s60
0.000	0.000	0.065	24.826	55.761	17.953	1.358	0.036	0.000	0.000	1.693	my8031_rel_o2.cy10a4g_gcp_c2s60
0.000	0.000	0.182	26.175	54.529	17.394	1.688	0.032	0.000	0.000	2.223	my8031_rel.cy10a4g_gcp_c2s60
0.000	0.000	0.146	30.625	52.782	14.996	1.426	0.025	0.000	0.000	1.654	my8031_rel_native.cy10a4g_gcp_c2s60
0.000	0.000	0.107	28.728	52.792	16.650	1.686	0.037	0.000	0.000	1.562	my8031_rel_o2_lto.cy10a4g_gcp_c2s60
0.000	0.000	0.224	27.593	54.632	15.950	1.561	0.040	0.000	0.000	1.743	my8031_rel_lto.cy10a4g_gcp_c2s60
0.000	0.000	0.171	30.090	52.681	15.549	1.469	0.040	0.000	0.000	1.853	my8031_rel_native_lto.cy10a4g_gcp_c2s60
q500.1
- q500.1: range queries with 500 insert/s per client
- Legend for results is here.
- Each entry lists the percentage of responses that fit in that bucket (slower than max time for previous bucket, faster than min time for next bucket).
Query response time histogram
256us	1ms	4ms	16ms	64ms	256ms	1s	4s	16s	gt	max	tag
4.917	15.372	11.947	45.103	21.308	1.326	0.027	0.000	0.000	0.000	0.967	my8031_rel_withdbg.cy10a4g_gcp_c2s60
6.307	15.243	11.892	44.423	20.779	1.331	0.025	0.000	0.000	0.000	0.964	my8031_rel_o2.cy10a4g_gcp_c2s60
5.321	14.782	11.271	44.951	22.190	1.460	0.027	0.000	0.000	0.000	0.790	my8031_rel.cy10a4g_gcp_c2s60
5.068	15.622	11.938	44.787	21.271	1.290	0.025	0.000	0.000	0.000	0.752	my8031_rel_native.cy10a4g_gcp_c2s60
4.992	15.012	11.317	45.232	21.963	1.455	0.030	0.000	0.000	0.000	0.893	my8031_rel_o2_lto.cy10a4g_gcp_c2s60
5.903	14.954	11.847	44.949	21.038	1.284	0.025	nonzero	0.000	0.000	1.096	my8031_rel_lto.cy10a4g_gcp_c2s60
5.197	15.080	11.610	45.167	21.549	1.370	0.026	0.000	0.000	0.000	0.917	my8031_rel_native_lto.cy10a4g_gcp_c2s60
Insert response time histogram
256us	1ms	4ms	16ms	64ms	256ms	1s	4s	16s	gt	max	tag
0.000	0.000	0.074	1.931	36.473	53.803	7.692	0.027	0.000	0.000	2.029	my8031_rel_withdbg.cy10a4g_gcp_c2s60
0.000	0.000	0.112	1.993	36.635	53.433	7.801	0.027	0.000	0.000	1.446	my8031_rel_o2.cy10a4g_gcp_c2s60
0.000	0.000	0.111	2.178	35.134	54.546	8.007	0.024	0.000	0.000	1.655	my8031_rel.cy10a4g_gcp_c2s60
0.000	0.000	0.111	2.007	36.251	53.998	7.614	0.018	0.000	0.000	1.759	my8031_rel_native.cy10a4g_gcp_c2s60
0.000	0.000	0.104	2.209	36.177	53.457	8.029	0.024	0.000	0.000	1.686	my8031_rel_o2_lto.cy10a4g_gcp_c2s60
0.000	0.000	0.129	2.139	36.653	53.373	7.685	0.020	0.000	0.000	1.759	my8031_rel_lto.cy10a4g_gcp_c2s60
0.000	0.000	0.120	2.177	36.341	53.552	7.783	0.027	0.000	0.000	1.705	my8031_rel_native_lto.cy10a4g_gcp_c2s60
q1000.1
- q1000.1: range queries with 1000 insert/s per client
- Legend for results is here.
- Each entry lists the percentage of responses that fit in that bucket (slower than max time for previous bucket, faster than min time for next bucket).
Query response time histogram
256us	1ms	4ms	16ms	64ms	256ms	1s	4s	16s	gt	max	tag
12.992	9.995	11.549	42.259	20.504	2.317	0.384	nonzero	0.000	0.000	1.318	my8031_rel_withdbg.cy10a4g_gcp_c2s60
6.624	11.000	12.347	45.183	21.929	2.510	0.408	nonzero	0.000	0.000	1.401	my8031_rel_o2.cy10a4g_gcp_c2s60
7.359	10.505	11.348	44.898	22.849	2.606	0.435	nonzero	0.000	0.000	1.415	my8031_rel.cy10a4g_gcp_c2s60
4.882	11.322	12.531	45.842	22.574	2.460	0.389	nonzero	0.000	0.000	1.141	my8031_rel_native.cy10a4g_gcp_c2s60
6.423	10.392	11.554	45.982	22.571	2.616	0.463	nonzero	0.000	0.000	1.345	my8031_rel_o2_lto.cy10a4g_gcp_c2s60
8.428	10.230	11.912	44.826	21.746	2.443	0.414	nonzero	0.000	0.000	1.275	my8031_rel_lto.cy10a4g_gcp_c2s60
11.998	9.998	11.417	42.799	20.990	2.391	0.407	nonzero	0.000	0.000	1.283	my8031_rel_native_lto.cy10a4g_gcp_c2s60
Insert response time histogram
256us	1ms	4ms	16ms	64ms	256ms	1s	4s	16s	gt	max	tag
0.000	0.000	0.574	6.090	43.994	37.184	12.103	0.055	0.000	0.000	1.668	my8031_rel_withdbg.cy10a4g_gcp_c2s60
0.000	0.000	0.376	5.494	44.252	37.713	12.108	0.056	0.000	0.000	1.873	my8031_rel_o2.cy10a4g_gcp_c2s60
0.000	0.000	0.465	5.576	43.132	38.182	12.574	0.071	0.000	0.000	2.281	my8031_rel.cy10a4g_gcp_c2s60
0.000	0.000	0.347	5.028	43.703	38.946	11.927	0.050	0.000	0.000	1.955	my8031_rel_native.cy10a4g_gcp_c2s60
0.000	0.000	0.487	7.024	43.831	35.830	12.763	0.064	0.000	0.000	1.798	my8031_rel_o2_lto.cy10a4g_gcp_c2s60
0.000	0.000	0.549	6.723	43.697	36.970	12.005	0.057	0.000	0.000	1.935	my8031_rel_lto.cy10a4g_gcp_c2s60
0.000	0.000	0.665	6.904	43.452	36.790	12.130	0.060	0.000	0.000	2.128	my8031_rel_native_lto.cy10a4g_gcp_c2s60