Introduction
This is a report for the insert benchmark with 400M docs and 20 client(s). It is generated by scripts (bash, awk, sed) and Tufte might not be impressed. An overview of the insert benchmark is here and a short update is here. Below, by DBMS, I mean DBMS+version.config. An example is my8020.c10b40 where my means MySQL, 8020 is version 8.0.20 and c10b40 is the name for the configuration file.
This is a report for the insert benchmark with 400M docs and 20 client(s). It is generated by scripts (bash, awk, sed) and Tufte might not be impressed. An overview of the insert benchmark is here and a short update is here. Below, by DBMS, I mean DBMS+version.config. An example is my8020.c10b40 where my means MySQL, 8020 is version 8.0.20 and c10b40 is the name for the configuration file.The test server is c2-standard-60 from GCP with 30 cores, hyperthreads disabled, 240G RAM and 3T of NVMe (XFS with RAID0 over 8 devices). The benchmark was run with 20 clients and there were 1 or 2 connections per client (1 for queries, 1 for inserts). It uses 20 tables with a client per table. It loads 20M rows per table without secondary indexes, creates secondary indexes, loads another 20M rows per table then does 3 read+write tests for one hour each that do queries as fast as possible with 100, 500 and then 1000 writes/second/client concurrent with the queries. The database is cached by the storage engine and the only IO is for writes. Clients and the DBMS share one server. The per-database configs are in the per-database subdirectories here.
The tested DBMS are:
- my8022_rel_lto.cy10a_gcp_c2s60 - MySQL 8.0.22, the cy10a_gcp_c2s60 config and the build used CMAKE_BUILD_TYPE=Release -flto
- my8028_rel_lto.cy10a_gcp_c2s60 - MySQL 8.0.28, the cy10a_gcp_c2s60 config and the build used CMAKE_BUILD_TYPE=Release -flto
- my8031_rel_lto.cy10a_gcp_c2s60 - MySQL 8.0.31, the cy10a_gcp_c2s60 config and the build used CMAKE_BUILD_TYPE=Release -flto
- my8032_rel_lto.cy10a_gcp_c2s60 - MySQL 8.0.32, the cy10a_gcp_c2s60 config and the build used CMAKE_BUILD_TYPE=Release -flto
Contents
- Summary
- l.i0: load without secondary indexes
- l.x: create secondary indexes
- l.i1: continue load after secondary indexes created
- q100.1: range queries with 100 insert/s per client
- q500.1: range queries with 500 insert/s per client
- q1000.1: range queries with 1000 insert/s per client
Summary
The numbers are inserts/s for l.i0 and l.i1, indexed docs (or rows) /s for l.x and queries/s for q*.2. The values are the average rate over the entire test for inserts (IPS) and queries (QPS). The range of values for IPS and QPS is split into 3 parts: bottom 25%, middle 50%, top 25%. Values in the bottom 25% have a red background, values in the top 25% have a green background and values in the middle have no color. A gray background is used for values that can be ignored because the DBMS did not sustain the target insert rate. Red backgrounds are not used when the minimum value is within 80% of the max value.
| dbms | l.i0 | l.x | l.i1 | q100.1 | q500.1 | q1000.1 |
|---|---|---|---|---|---|---|
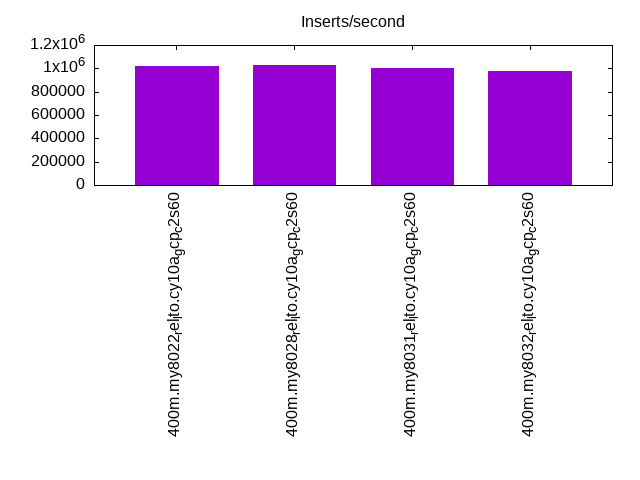
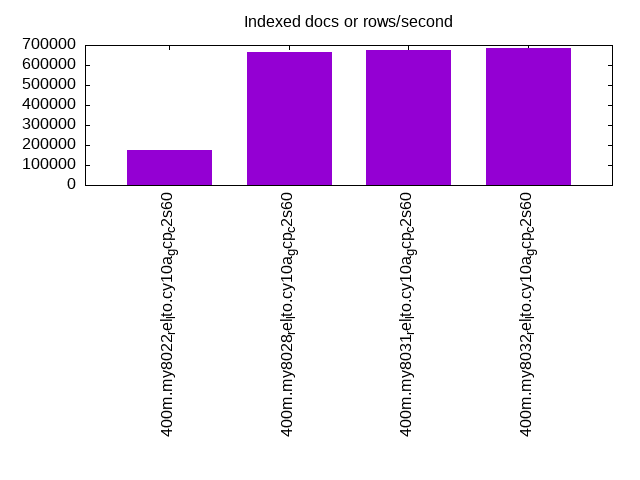
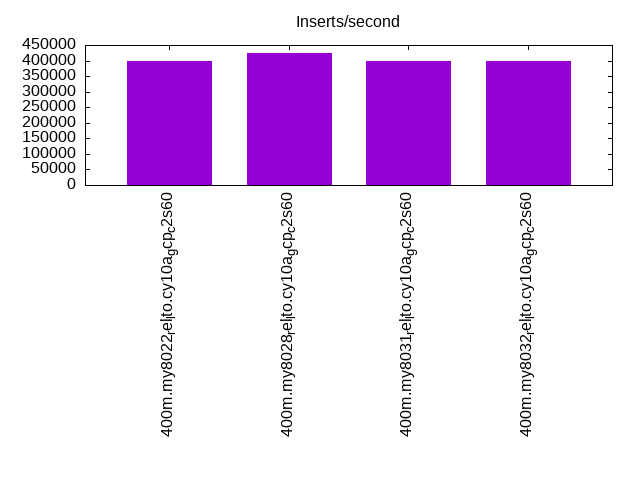
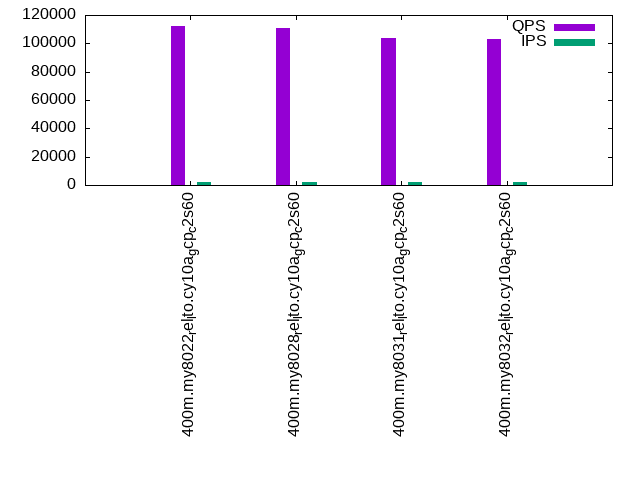
| 400m.my8022_rel_lto.cy10a_gcp_c2s60 | 1020408 | 176100 | 398804 | 112549 | 113438 | 112224 |
| 400m.my8028_rel_lto.cy10a_gcp_c2s60 | 1028278 | 663516 | 423729 | 110918 | 112222 | 110573 |
| 400m.my8031_rel_lto.cy10a_gcp_c2s60 | 1002506 | 674705 | 398010 | 104056 | 105513 | 103646 |
| 400m.my8032_rel_lto.cy10a_gcp_c2s60 | 977995 | 682764 | 397614 | 102958 | 104637 | 103026 |
This table has relative throughput, throughput for the DBMS relative to the DBMS in the first line, using the absolute throughput from the previous table.
| dbms | l.i0 | l.x | l.i1 | q100.1 | q500.1 | q1000.1 |
|---|---|---|---|---|---|---|
| 400m.my8022_rel_lto.cy10a_gcp_c2s60 | 1.00 | 1.00 | 1.00 | 1.00 | 1.00 | 1.00 |
| 400m.my8028_rel_lto.cy10a_gcp_c2s60 | 1.01 | 3.77 | 1.06 | 0.99 | 0.99 | 0.99 |
| 400m.my8031_rel_lto.cy10a_gcp_c2s60 | 0.98 | 3.83 | 1.00 | 0.92 | 0.93 | 0.92 |
| 400m.my8032_rel_lto.cy10a_gcp_c2s60 | 0.96 | 3.88 | 1.00 | 0.91 | 0.92 | 0.92 |
This lists the average rate of inserts/s for the tests that do inserts concurrent with queries. For such tests the query rate is listed in the table above. The read+write tests are setup so that the insert rate should match the target rate every second. Cells that are not at least 95% of the target have a red background to indicate a failure to satisfy the target.
| dbms | q100.1 | q500.1 | q1000.1 |
|---|---|---|---|
| my8022_rel_lto.cy10a_gcp_c2s60 | 1977 | 9879 | 19769 |
| my8028_rel_lto.cy10a_gcp_c2s60 | 1977 | 9879 | 19780 |
| my8031_rel_lto.cy10a_gcp_c2s60 | 1976 | 9879 | 19769 |
| my8032_rel_lto.cy10a_gcp_c2s60 | 1977 | 9885 | 19769 |
| target | 2000 | 10000 | 20000 |
l.i0
l.i0: load without secondary indexes. Graphs for performance per 1-second interval are here.
Average throughput:
Insert response time histogram: each cell has the percentage of responses that take <= the time in the header and max is the max response time in seconds. For the max column values in the top 25% of the range have a red background and in the bottom 25% of the range have a green background. The red background is not used when the min value is within 80% of the max value.
| dbms | 256us | 1ms | 4ms | 16ms | 64ms | 256ms | 1s | 4s | 16s | gt | max |
|---|---|---|---|---|---|---|---|---|---|---|---|
| my8022_rel_lto.cy10a_gcp_c2s60 | 0.914 | 98.618 | 0.421 | 0.011 | 0.036 | 0.218 | |||||
| my8028_rel_lto.cy10a_gcp_c2s60 | 1.287 | 98.116 | 0.498 | 0.063 | 0.035 | 0.002 | 0.310 | ||||
| my8031_rel_lto.cy10a_gcp_c2s60 | 0.831 | 98.577 | 0.486 | 0.071 | 0.033 | 0.003 | 0.298 | ||||
| my8032_rel_lto.cy10a_gcp_c2s60 | 0.458 | 98.931 | 0.509 | 0.064 | 0.037 | 0.002 | 0.300 |
Performance metrics for the DBMS listed above. Some are normalized by throughput, others are not. Legend for results is here.
ips	qps	rps	rmbps	wps	wmbps	rpq	rkbpq	wpi	wkbpi	csps	cpups	cspq	cpupq	dbgb1	dbgb2	rss	maxop	p50	p99	tag
1020408	0	0	0.0	1786.0	230.2	0.000	0.000	0.002	0.231	206953	66.7	0.203	20	26.4	155.0	9.3	0.218	54142	41854	400m.my8022_rel_lto.cy10a_gcp_c2s60
1028278	0	0	0.0	1714.9	231.3	0.000	0.000	0.002	0.230	204459	65.7	0.199	19	26.4	155.0	9.3	0.310	56184	37958	400m.my8028_rel_lto.cy10a_gcp_c2s60
1002506	0	0	0.0	1650.4	220.9	0.000	0.000	0.002	0.226	199267	65.3	0.199	20	26.4	155.0	9.3	0.298	52643	37858	400m.my8031_rel_lto.cy10a_gcp_c2s60
977995	0	0	0.0	1620.5	215.6	0.000	0.000	0.002	0.226	193422	66.1	0.198	20	26.4	155.0	9.3	0.300	52165	38473	400m.my8032_rel_lto.cy10a_gcp_c2s60
l.x
l.x: create secondary indexes.
Average throughput:
Performance metrics for the DBMS listed above. Some are normalized by throughput, others are not. Legend for results is here.
ips	qps	rps	rmbps	wps	wmbps	rpq	rkbpq	wpi	wkbpi	csps	cpups	cspq	cpupq	dbgb1	dbgb2	rss	maxop	p50	p99	tag
176100	0	0	0.0	2853.0	150.5	0.000	0.000	0.016	0.875	559950	44.8	3.180	76	58.8	187.4	9.4	0.003	NA	NA	400m.my8022_rel_lto.cy10a_gcp_c2s60
663516	0	3360	231.0	14184.7	634.9	0.005	0.356	0.021	0.980	530161	50.0	0.799	23	58.8	187.4	9.3	0.091	NA	NA	400m.my8028_rel_lto.cy10a_gcp_c2s60
674705	0	3416	234.9	14416.3	646.9	0.005	0.357	0.021	0.982	485218	51.2	0.719	23	58.8	187.4	9.3	0.039	NA	NA	400m.my8031_rel_lto.cy10a_gcp_c2s60
682764	0	3438	236.8	14501.1	652.4	0.005	0.355	0.021	0.978	479595	52.3	0.702	23	58.8	187.4	9.3	0.013	NA	NA	400m.my8032_rel_lto.cy10a_gcp_c2s60
l.i1
l.i1: continue load after secondary indexes created. Graphs for performance per 1-second interval are here.
Average throughput:
Insert response time histogram: each cell has the percentage of responses that take <= the time in the header and max is the max response time in seconds. For the max column values in the top 25% of the range have a red background and in the bottom 25% of the range have a green background. The red background is not used when the min value is within 80% of the max value.
| dbms | 256us | 1ms | 4ms | 16ms | 64ms | 256ms | 1s | 4s | 16s | gt | max |
|---|---|---|---|---|---|---|---|---|---|---|---|
| my8022_rel_lto.cy10a_gcp_c2s60 | 98.684 | 1.175 | 0.122 | 0.019 | 0.231 | ||||||
| my8028_rel_lto.cy10a_gcp_c2s60 | 98.885 | 1.018 | 0.072 | 0.024 | nonzero | 0.632 | |||||
| my8031_rel_lto.cy10a_gcp_c2s60 | 98.569 | 1.310 | 0.087 | 0.031 | 0.002 | nonzero | 1.286 | ||||
| my8032_rel_lto.cy10a_gcp_c2s60 | 98.442 | 1.439 | 0.085 | 0.032 | 0.002 | nonzero | 1.190 |
Performance metrics for the DBMS listed above. Some are normalized by throughput, others are not. Legend for results is here.
ips	qps	rps	rmbps	wps	wmbps	rpq	rkbpq	wpi	wkbpi	csps	cpups	cspq	cpupq	dbgb1	dbgb2	rss	maxop	p50	p99	tag
398804	0	233	4.3	8077.6	405.0	0.001	0.011	0.020	1.040	224291	68.1	0.562	51	157.8	286.4	9.3	0.231	22226	3949	400m.my8022_rel_lto.cy10a_gcp_c2s60
423729	0	170	3.5	7857.0	413.0	0.000	0.008	0.019	0.998	234103	67.8	0.552	48	157.8	286.3	9.3	0.632	22625	10139	400m.my8028_rel_lto.cy10a_gcp_c2s60
398010	0	493	13.8	8438.5	429.0	0.001	0.035	0.021	1.104	242979	67.8	0.610	51	157.8	286.4	9.3	1.286	21127	5694	400m.my8031_rel_lto.cy10a_gcp_c2s60
397614	0	445	12.4	8302.0	426.7	0.001	0.032	0.021	1.099	268973	68.4	0.676	52	157.8	286.4	9.3	1.190	21093	5694	400m.my8032_rel_lto.cy10a_gcp_c2s60
q100.1
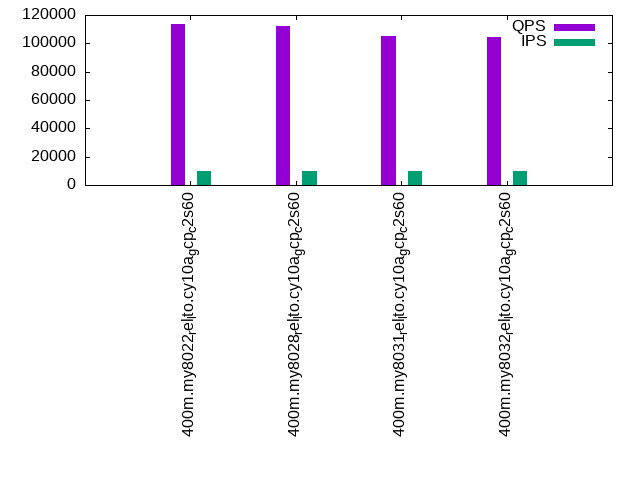
q100.1: range queries with 100 insert/s per client. Graphs for performance per 1-second interval are here.
Average throughput:
Query response time histogram: each cell has the percentage of responses that take <= the time in the header and max is the max response time in seconds. For max values in the top 25% of the range have a red background and in the bottom 25% of the range have a green background. The red background is not used when the min value is within 80% of the max value.
| dbms | 256us | 1ms | 4ms | 16ms | 64ms | 256ms | 1s | 4s | 16s | gt | max |
|---|---|---|---|---|---|---|---|---|---|---|---|
| my8022_rel_lto.cy10a_gcp_c2s60 | 97.820 | 2.177 | 0.003 | nonzero | nonzero | 0.027 | |||||
| my8028_rel_lto.cy10a_gcp_c2s60 | 97.764 | 2.232 | 0.004 | nonzero | nonzero | 0.028 | |||||
| my8031_rel_lto.cy10a_gcp_c2s60 | 96.819 | 3.177 | 0.004 | nonzero | nonzero | 0.027 | |||||
| my8032_rel_lto.cy10a_gcp_c2s60 | 96.584 | 3.412 | 0.004 | nonzero | nonzero | 0.027 |
Insert response time histogram: each cell has the percentage of responses that take <= the time in the header and max is the max response time in seconds. For max values in the top 25% of the range have a red background and in the bottom 25% of the range have a green background. The red background is not used when the min value is within 80% of the max value.
| dbms | 256us | 1ms | 4ms | 16ms | 64ms | 256ms | 1s | 4s | 16s | gt | max |
|---|---|---|---|---|---|---|---|---|---|---|---|
| my8022_rel_lto.cy10a_gcp_c2s60 | 95.282 | 4.681 | 0.037 | 0.035 | |||||||
| my8028_rel_lto.cy10a_gcp_c2s60 | 93.808 | 6.176 | 0.015 | 0.030 | |||||||
| my8031_rel_lto.cy10a_gcp_c2s60 | 95.417 | 4.578 | 0.006 | 0.019 | |||||||
| my8032_rel_lto.cy10a_gcp_c2s60 | 94.679 | 5.312 | 0.008 | 0.029 |
Performance metrics for the DBMS listed above. Some are normalized by throughput, others are not. Legend for results is here.
ips	qps	rps	rmbps	wps	wmbps	rpq	rkbpq	wpi	wkbpi	csps	cpups	cspq	cpupq	dbgb1	dbgb2	rss	maxop	p50	p99	tag
1977	112549	0	0.0	3124.8	89.6	0.000	0.000	1.581	46.404	427059	66.3	3.794	177	159.7	288.3	9.3	0.027	5690	5306	400m.my8022_rel_lto.cy10a_gcp_c2s60
1977	110918	0	0.0	3118.3	89.8	0.000	0.000	1.577	46.520	421540	66.1	3.800	179	159.7	288.3	9.3	0.028	5514	5114	400m.my8028_rel_lto.cy10a_gcp_c2s60
1976	104056	0	0.0	3568.9	102.8	0.000	0.000	1.806	53.296	404004	65.9	3.883	190	159.7	288.3	9.3	0.027	5324	4890	400m.my8031_rel_lto.cy10a_gcp_c2s60
1977	102958	0	0.0	3602.8	103.8	0.000	0.000	1.822	53.766	400694	66.0	3.892	192	159.7	288.3	9.3	0.027	5274	4811	400m.my8032_rel_lto.cy10a_gcp_c2s60
q500.1
q500.1: range queries with 500 insert/s per client. Graphs for performance per 1-second interval are here.
Average throughput:
Query response time histogram: each cell has the percentage of responses that take <= the time in the header and max is the max response time in seconds. For max values in the top 25% of the range have a red background and in the bottom 25% of the range have a green background. The red background is not used when the min value is within 80% of the max value.
| dbms | 256us | 1ms | 4ms | 16ms | 64ms | 256ms | 1s | 4s | 16s | gt | max |
|---|---|---|---|---|---|---|---|---|---|---|---|
| my8022_rel_lto.cy10a_gcp_c2s60 | 98.098 | 1.879 | 0.020 | 0.002 | nonzero | 0.024 | |||||
| my8028_rel_lto.cy10a_gcp_c2s60 | 98.041 | 1.938 | 0.019 | 0.002 | nonzero | 0.030 | |||||
| my8031_rel_lto.cy10a_gcp_c2s60 | 97.440 | 2.537 | 0.021 | 0.002 | nonzero | 0.027 | |||||
| my8032_rel_lto.cy10a_gcp_c2s60 | 97.323 | 2.654 | 0.021 | 0.002 | nonzero | 0.027 |
Insert response time histogram: each cell has the percentage of responses that take <= the time in the header and max is the max response time in seconds. For max values in the top 25% of the range have a red background and in the bottom 25% of the range have a green background. The red background is not used when the min value is within 80% of the max value.
| dbms | 256us | 1ms | 4ms | 16ms | 64ms | 256ms | 1s | 4s | 16s | gt | max |
|---|---|---|---|---|---|---|---|---|---|---|---|
| my8022_rel_lto.cy10a_gcp_c2s60 | 56.747 | 42.558 | 0.694 | 0.042 | |||||||
| my8028_rel_lto.cy10a_gcp_c2s60 | 69.503 | 29.979 | 0.518 | 0.041 | |||||||
| my8031_rel_lto.cy10a_gcp_c2s60 | 59.745 | 39.596 | 0.659 | 0.054 | |||||||
| my8032_rel_lto.cy10a_gcp_c2s60 | 57.553 | 41.646 | 0.801 | 0.046 |
Performance metrics for the DBMS listed above. Some are normalized by throughput, others are not. Legend for results is here.
ips	qps	rps	rmbps	wps	wmbps	rpq	rkbpq	wpi	wkbpi	csps	cpups	cspq	cpupq	dbgb1	dbgb2	rss	maxop	p50	p99	tag
9879	113438	0	0.0	583.8	23.8	0.000	0.000	0.059	2.463	408129	66.7	3.598	176	167.7	296.3	9.3	0.024	5677	5452	400m.my8022_rel_lto.cy10a_gcp_c2s60
9879	112222	0	0.0	601.2	24.0	0.000	0.000	0.061	2.486	405258	66.5	3.611	178	167.7	296.3	9.3	0.030	5564	5338	400m.my8028_rel_lto.cy10a_gcp_c2s60
9879	105513	0	0.0	501.7	21.6	0.000	0.000	0.051	2.241	383209	66.2	3.632	188	167.8	296.3	9.3	0.027	5338	5019	400m.my8031_rel_lto.cy10a_gcp_c2s60
9885	104637	0	0.0	501.1	21.4	0.000	0.000	0.051	2.214	380294	66.5	3.634	191	167.8	296.3	9.3	0.027	5276	4988	400m.my8032_rel_lto.cy10a_gcp_c2s60
q1000.1
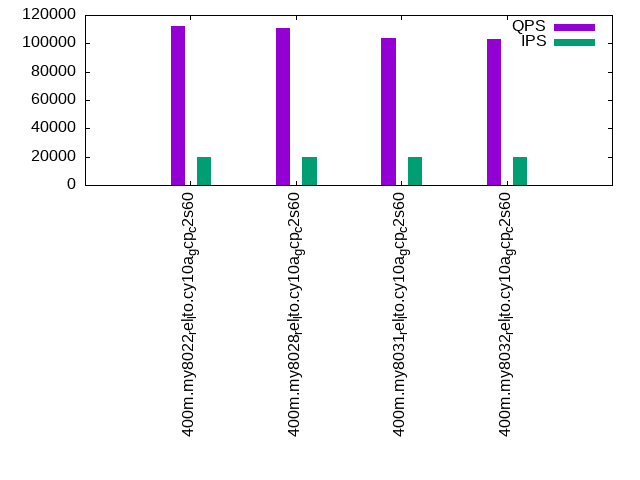
q1000.1: range queries with 1000 insert/s per client. Graphs for performance per 1-second interval are here.
Average throughput:
Query response time histogram: each cell has the percentage of responses that take <= the time in the header and max is the max response time in seconds. For max values in the top 25% of the range have a red background and in the bottom 25% of the range have a green background. The red background is not used when the min value is within 80% of the max value.
| dbms | 256us | 1ms | 4ms | 16ms | 64ms | 256ms | 1s | 4s | 16s | gt | max |
|---|---|---|---|---|---|---|---|---|---|---|---|
| my8022_rel_lto.cy10a_gcp_c2s60 | 98.017 | 1.952 | 0.028 | 0.003 | nonzero | 0.029 | |||||
| my8028_rel_lto.cy10a_gcp_c2s60 | 97.890 | 2.078 | 0.029 | 0.003 | nonzero | 0.028 | |||||
| my8031_rel_lto.cy10a_gcp_c2s60 | 97.098 | 2.869 | 0.030 | 0.004 | nonzero | 0.026 | |||||
| my8032_rel_lto.cy10a_gcp_c2s60 | 97.033 | 2.931 | 0.031 | 0.004 | nonzero | 0.029 |
Insert response time histogram: each cell has the percentage of responses that take <= the time in the header and max is the max response time in seconds. For max values in the top 25% of the range have a red background and in the bottom 25% of the range have a green background. The red background is not used when the min value is within 80% of the max value.
| dbms | 256us | 1ms | 4ms | 16ms | 64ms | 256ms | 1s | 4s | 16s | gt | max |
|---|---|---|---|---|---|---|---|---|---|---|---|
| my8022_rel_lto.cy10a_gcp_c2s60 | 56.850 | 42.400 | 0.750 | 0.055 | |||||||
| my8028_rel_lto.cy10a_gcp_c2s60 | 63.242 | 36.037 | 0.721 | 0.057 | |||||||
| my8031_rel_lto.cy10a_gcp_c2s60 | 58.280 | 40.807 | 0.913 | 0.052 | |||||||
| my8032_rel_lto.cy10a_gcp_c2s60 | 57.591 | 41.346 | 1.063 | 0.057 |
Performance metrics for the DBMS listed above. Some are normalized by throughput, others are not. Legend for results is here.
ips	qps	rps	rmbps	wps	wmbps	rpq	rkbpq	wpi	wkbpi	csps	cpups	cspq	cpupq	dbgb1	dbgb2	rss	maxop	p50	p99	tag
19769	112224	9	0.1	2130.4	66.0	0.000	0.001	0.108	3.416	400848	67.7	3.572	181	176.1	304.7	9.3	0.029	5660	5370	400m.my8022_rel_lto.cy10a_gcp_c2s60
19780	110573	10	0.2	2570.9	77.1	0.000	0.001	0.130	3.992	401096	67.6	3.627	183	176.1	304.7	9.3	0.028	5500	5210	400m.my8028_rel_lto.cy10a_gcp_c2s60
19769	103646	10	0.2	2908.4	84.7	0.000	0.002	0.147	4.385	380960	68.1	3.676	197	176.1	304.7	9.3	0.026	5210	4939	400m.my8031_rel_lto.cy10a_gcp_c2s60
19769	103026	10	0.2	3049.9	88.7	0.000	0.002	0.154	4.593	378396	68.2	3.673	199	176.1	304.7	9.3	0.029	5130	4845	400m.my8032_rel_lto.cy10a_gcp_c2s60
l.i0
l.i0: load without secondary indexes
Performance metrics for all DBMS, not just the ones listed above. Some are normalized by throughput, others are not. Legend for results is here.
ips	qps	rps	rmbps	wps	wmbps	rpq	rkbpq	wpi	wkbpi	csps	cpups	cspq	cpupq	dbgb1	dbgb2	rss	maxop	p50	p99	tag
1020408	0	0	0.0	1786.0	230.2	0.000	0.000	0.002	0.231	206953	66.7	0.203	20	26.4	155.0	9.3	0.218	54142	41854	400m.my8022_rel_lto.cy10a_gcp_c2s60
1028278	0	0	0.0	1714.9	231.3	0.000	0.000	0.002	0.230	204459	65.7	0.199	19	26.4	155.0	9.3	0.310	56184	37958	400m.my8028_rel_lto.cy10a_gcp_c2s60
1002506	0	0	0.0	1650.4	220.9	0.000	0.000	0.002	0.226	199267	65.3	0.199	20	26.4	155.0	9.3	0.298	52643	37858	400m.my8031_rel_lto.cy10a_gcp_c2s60
977995	0	0	0.0	1620.5	215.6	0.000	0.000	0.002	0.226	193422	66.1	0.198	20	26.4	155.0	9.3	0.300	52165	38473	400m.my8032_rel_lto.cy10a_gcp_c2s60
l.x
l.x: create secondary indexes
Performance metrics for all DBMS, not just the ones listed above. Some are normalized by throughput, others are not. Legend for results is here.
ips	qps	rps	rmbps	wps	wmbps	rpq	rkbpq	wpi	wkbpi	csps	cpups	cspq	cpupq	dbgb1	dbgb2	rss	maxop	p50	p99	tag
176100	0	0	0.0	2853.0	150.5	0.000	0.000	0.016	0.875	559950	44.8	3.180	76	58.8	187.4	9.4	0.003	NA	NA	400m.my8022_rel_lto.cy10a_gcp_c2s60
663516	0	3360	231.0	14184.7	634.9	0.005	0.356	0.021	0.980	530161	50.0	0.799	23	58.8	187.4	9.3	0.091	NA	NA	400m.my8028_rel_lto.cy10a_gcp_c2s60
674705	0	3416	234.9	14416.3	646.9	0.005	0.357	0.021	0.982	485218	51.2	0.719	23	58.8	187.4	9.3	0.039	NA	NA	400m.my8031_rel_lto.cy10a_gcp_c2s60
682764	0	3438	236.8	14501.1	652.4	0.005	0.355	0.021	0.978	479595	52.3	0.702	23	58.8	187.4	9.3	0.013	NA	NA	400m.my8032_rel_lto.cy10a_gcp_c2s60
l.i1
l.i1: continue load after secondary indexes created
Performance metrics for all DBMS, not just the ones listed above. Some are normalized by throughput, others are not. Legend for results is here.
ips	qps	rps	rmbps	wps	wmbps	rpq	rkbpq	wpi	wkbpi	csps	cpups	cspq	cpupq	dbgb1	dbgb2	rss	maxop	p50	p99	tag
398804	0	233	4.3	8077.6	405.0	0.001	0.011	0.020	1.040	224291	68.1	0.562	51	157.8	286.4	9.3	0.231	22226	3949	400m.my8022_rel_lto.cy10a_gcp_c2s60
423729	0	170	3.5	7857.0	413.0	0.000	0.008	0.019	0.998	234103	67.8	0.552	48	157.8	286.3	9.3	0.632	22625	10139	400m.my8028_rel_lto.cy10a_gcp_c2s60
398010	0	493	13.8	8438.5	429.0	0.001	0.035	0.021	1.104	242979	67.8	0.610	51	157.8	286.4	9.3	1.286	21127	5694	400m.my8031_rel_lto.cy10a_gcp_c2s60
397614	0	445	12.4	8302.0	426.7	0.001	0.032	0.021	1.099	268973	68.4	0.676	52	157.8	286.4	9.3	1.190	21093	5694	400m.my8032_rel_lto.cy10a_gcp_c2s60
q100.1
q100.1: range queries with 100 insert/s per client
Performance metrics for all DBMS, not just the ones listed above. Some are normalized by throughput, others are not. Legend for results is here.
ips	qps	rps	rmbps	wps	wmbps	rpq	rkbpq	wpi	wkbpi	csps	cpups	cspq	cpupq	dbgb1	dbgb2	rss	maxop	p50	p99	tag
1977	112549	0	0.0	3124.8	89.6	0.000	0.000	1.581	46.404	427059	66.3	3.794	177	159.7	288.3	9.3	0.027	5690	5306	400m.my8022_rel_lto.cy10a_gcp_c2s60
1977	110918	0	0.0	3118.3	89.8	0.000	0.000	1.577	46.520	421540	66.1	3.800	179	159.7	288.3	9.3	0.028	5514	5114	400m.my8028_rel_lto.cy10a_gcp_c2s60
1976	104056	0	0.0	3568.9	102.8	0.000	0.000	1.806	53.296	404004	65.9	3.883	190	159.7	288.3	9.3	0.027	5324	4890	400m.my8031_rel_lto.cy10a_gcp_c2s60
1977	102958	0	0.0	3602.8	103.8	0.000	0.000	1.822	53.766	400694	66.0	3.892	192	159.7	288.3	9.3	0.027	5274	4811	400m.my8032_rel_lto.cy10a_gcp_c2s60
q500.1
q500.1: range queries with 500 insert/s per client
Performance metrics for all DBMS, not just the ones listed above. Some are normalized by throughput, others are not. Legend for results is here.
ips	qps	rps	rmbps	wps	wmbps	rpq	rkbpq	wpi	wkbpi	csps	cpups	cspq	cpupq	dbgb1	dbgb2	rss	maxop	p50	p99	tag
9879	113438	0	0.0	583.8	23.8	0.000	0.000	0.059	2.463	408129	66.7	3.598	176	167.7	296.3	9.3	0.024	5677	5452	400m.my8022_rel_lto.cy10a_gcp_c2s60
9879	112222	0	0.0	601.2	24.0	0.000	0.000	0.061	2.486	405258	66.5	3.611	178	167.7	296.3	9.3	0.030	5564	5338	400m.my8028_rel_lto.cy10a_gcp_c2s60
9879	105513	0	0.0	501.7	21.6	0.000	0.000	0.051	2.241	383209	66.2	3.632	188	167.8	296.3	9.3	0.027	5338	5019	400m.my8031_rel_lto.cy10a_gcp_c2s60
9885	104637	0	0.0	501.1	21.4	0.000	0.000	0.051	2.214	380294	66.5	3.634	191	167.8	296.3	9.3	0.027	5276	4988	400m.my8032_rel_lto.cy10a_gcp_c2s60
q1000.1
q1000.1: range queries with 1000 insert/s per client
Performance metrics for all DBMS, not just the ones listed above. Some are normalized by throughput, others are not. Legend for results is here.
ips	qps	rps	rmbps	wps	wmbps	rpq	rkbpq	wpi	wkbpi	csps	cpups	cspq	cpupq	dbgb1	dbgb2	rss	maxop	p50	p99	tag
19769	112224	9	0.1	2130.4	66.0	0.000	0.001	0.108	3.416	400848	67.7	3.572	181	176.1	304.7	9.3	0.029	5660	5370	400m.my8022_rel_lto.cy10a_gcp_c2s60
19780	110573	10	0.2	2570.9	77.1	0.000	0.001	0.130	3.992	401096	67.6	3.627	183	176.1	304.7	9.3	0.028	5500	5210	400m.my8028_rel_lto.cy10a_gcp_c2s60
19769	103646	10	0.2	2908.4	84.7	0.000	0.002	0.147	4.385	380960	68.1	3.676	197	176.1	304.7	9.3	0.026	5210	4939	400m.my8031_rel_lto.cy10a_gcp_c2s60
19769	103026	10	0.2	3049.9	88.7	0.000	0.002	0.154	4.593	378396	68.2	3.673	199	176.1	304.7	9.3	0.029	5130	4845	400m.my8032_rel_lto.cy10a_gcp_c2s60
l.i0
- l.i0: load without secondary indexes
- Legend for results is here.
- Each entry lists the percentage of responses that fit in that bucket (slower than max time for previous bucket, faster than min time for next bucket).
Insert response time histogram
256us	1ms	4ms	16ms	64ms	256ms	1s	4s	16s	gt	max	tag
0.000	0.914	98.618	0.421	0.011	0.036	0.000	0.000	0.000	0.000	0.218	my8022_rel_lto.cy10a_gcp_c2s60
0.000	1.287	98.116	0.498	0.063	0.035	0.002	0.000	0.000	0.000	0.310	my8028_rel_lto.cy10a_gcp_c2s60
0.000	0.831	98.577	0.486	0.071	0.033	0.003	0.000	0.000	0.000	0.298	my8031_rel_lto.cy10a_gcp_c2s60
0.000	0.458	98.931	0.509	0.064	0.037	0.002	0.000	0.000	0.000	0.300	my8032_rel_lto.cy10a_gcp_c2s60
l.x
- l.x: create secondary indexes
- Legend for results is here.
- Each entry lists the percentage of responses that fit in that bucket (slower than max time for previous bucket, faster than min time for next bucket).
TODO - determine whether there is data for create index response time
l.i1
- l.i1: continue load after secondary indexes created
- Legend for results is here.
- Each entry lists the percentage of responses that fit in that bucket (slower than max time for previous bucket, faster than min time for next bucket).
Insert response time histogram
256us	1ms	4ms	16ms	64ms	256ms	1s	4s	16s	gt	max	tag
0.000	0.000	98.684	1.175	0.122	0.019	0.000	0.000	0.000	0.000	0.231	my8022_rel_lto.cy10a_gcp_c2s60
0.000	0.000	98.885	1.018	0.072	0.024	nonzero	0.000	0.000	0.000	0.632	my8028_rel_lto.cy10a_gcp_c2s60
0.000	0.000	98.569	1.310	0.087	0.031	0.002	nonzero	0.000	0.000	1.286	my8031_rel_lto.cy10a_gcp_c2s60
0.000	0.000	98.442	1.439	0.085	0.032	0.002	nonzero	0.000	0.000	1.190	my8032_rel_lto.cy10a_gcp_c2s60
q100.1
- q100.1: range queries with 100 insert/s per client
- Legend for results is here.
- Each entry lists the percentage of responses that fit in that bucket (slower than max time for previous bucket, faster than min time for next bucket).
Query response time histogram
256us	1ms	4ms	16ms	64ms	256ms	1s	4s	16s	gt	max	tag
97.820	2.177	0.003	nonzero	nonzero	0.000	0.000	0.000	0.000	0.000	0.027	my8022_rel_lto.cy10a_gcp_c2s60
97.764	2.232	0.004	nonzero	nonzero	0.000	0.000	0.000	0.000	0.000	0.028	my8028_rel_lto.cy10a_gcp_c2s60
96.819	3.177	0.004	nonzero	nonzero	0.000	0.000	0.000	0.000	0.000	0.027	my8031_rel_lto.cy10a_gcp_c2s60
96.584	3.412	0.004	nonzero	nonzero	0.000	0.000	0.000	0.000	0.000	0.027	my8032_rel_lto.cy10a_gcp_c2s60
Insert response time histogram
256us	1ms	4ms	16ms	64ms	256ms	1s	4s	16s	gt	max	tag
0.000	0.000	95.282	4.681	0.037	0.000	0.000	0.000	0.000	0.000	0.035	my8022_rel_lto.cy10a_gcp_c2s60
0.000	0.000	93.808	6.176	0.015	0.000	0.000	0.000	0.000	0.000	0.030	my8028_rel_lto.cy10a_gcp_c2s60
0.000	0.000	95.417	4.578	0.006	0.000	0.000	0.000	0.000	0.000	0.019	my8031_rel_lto.cy10a_gcp_c2s60
0.000	0.000	94.679	5.312	0.008	0.000	0.000	0.000	0.000	0.000	0.029	my8032_rel_lto.cy10a_gcp_c2s60
q500.1
- q500.1: range queries with 500 insert/s per client
- Legend for results is here.
- Each entry lists the percentage of responses that fit in that bucket (slower than max time for previous bucket, faster than min time for next bucket).
Query response time histogram
256us	1ms	4ms	16ms	64ms	256ms	1s	4s	16s	gt	max	tag
98.098	1.879	0.020	0.002	nonzero	0.000	0.000	0.000	0.000	0.000	0.024	my8022_rel_lto.cy10a_gcp_c2s60
98.041	1.938	0.019	0.002	nonzero	0.000	0.000	0.000	0.000	0.000	0.030	my8028_rel_lto.cy10a_gcp_c2s60
97.440	2.537	0.021	0.002	nonzero	0.000	0.000	0.000	0.000	0.000	0.027	my8031_rel_lto.cy10a_gcp_c2s60
97.323	2.654	0.021	0.002	nonzero	0.000	0.000	0.000	0.000	0.000	0.027	my8032_rel_lto.cy10a_gcp_c2s60
Insert response time histogram
256us	1ms	4ms	16ms	64ms	256ms	1s	4s	16s	gt	max	tag
0.000	0.000	56.747	42.558	0.694	0.000	0.000	0.000	0.000	0.000	0.042	my8022_rel_lto.cy10a_gcp_c2s60
0.000	0.000	69.503	29.979	0.518	0.000	0.000	0.000	0.000	0.000	0.041	my8028_rel_lto.cy10a_gcp_c2s60
0.000	0.000	59.745	39.596	0.659	0.000	0.000	0.000	0.000	0.000	0.054	my8031_rel_lto.cy10a_gcp_c2s60
0.000	0.000	57.553	41.646	0.801	0.000	0.000	0.000	0.000	0.000	0.046	my8032_rel_lto.cy10a_gcp_c2s60
q1000.1
- q1000.1: range queries with 1000 insert/s per client
- Legend for results is here.
- Each entry lists the percentage of responses that fit in that bucket (slower than max time for previous bucket, faster than min time for next bucket).
Query response time histogram
256us	1ms	4ms	16ms	64ms	256ms	1s	4s	16s	gt	max	tag
98.017	1.952	0.028	0.003	nonzero	0.000	0.000	0.000	0.000	0.000	0.029	my8022_rel_lto.cy10a_gcp_c2s60
97.890	2.078	0.029	0.003	nonzero	0.000	0.000	0.000	0.000	0.000	0.028	my8028_rel_lto.cy10a_gcp_c2s60
97.098	2.869	0.030	0.004	nonzero	0.000	0.000	0.000	0.000	0.000	0.026	my8031_rel_lto.cy10a_gcp_c2s60
97.033	2.931	0.031	0.004	nonzero	0.000	0.000	0.000	0.000	0.000	0.029	my8032_rel_lto.cy10a_gcp_c2s60
Insert response time histogram
256us	1ms	4ms	16ms	64ms	256ms	1s	4s	16s	gt	max	tag
0.000	0.000	56.850	42.400	0.750	0.000	0.000	0.000	0.000	0.000	0.055	my8022_rel_lto.cy10a_gcp_c2s60
0.000	0.000	63.242	36.037	0.721	0.000	0.000	0.000	0.000	0.000	0.057	my8028_rel_lto.cy10a_gcp_c2s60
0.000	0.000	58.280	40.807	0.913	0.000	0.000	0.000	0.000	0.000	0.052	my8031_rel_lto.cy10a_gcp_c2s60
0.000	0.000	57.591	41.346	1.063	0.000	0.000	0.000	0.000	0.000	0.057	my8032_rel_lto.cy10a_gcp_c2s60