Introduction
This is a report for the insert benchmark with 400M docs and 20 client(s). It is generated by scripts (bash, awk, sed) and Tufte might not be impressed. An overview of the insert benchmark is here and a short update is here. Below, by DBMS, I mean DBMS+version.config. An example is my8020.c10b40 where my means MySQL, 8020 is version 8.0.20 and c10b40 is the name for the configuration file.
The test server is c2-standard-60 from GCP with 30 cores, hyperthreads disabled, 240G RAM and 3T of NVMe (XFS with RAID0 over 8 devices). The benchmark was run with 20 clients and there were 1 or 2 connections per client (1 for queries, 1 for inserts). It uses 1 table. It loads 400M rows without secondary indexes, creates secondary indexes, loads another 400M rows per table then does 3 read+write tests for one hour each that do queries as fast as possible with 100, 500 and then 1000 writes/second/client concurrent with the queries. The database is cached by the storage engine and the only IO is for writes. Clients and the DBMS share one server. The per-database configs are in the per-database subdirectories here.
The tested DBMS are:
- pg1119_o3_native_lto.cx7a_gcp_c2s60 - Postgres 11.19, the cx7a_gcp_c2s60 config and the build used: -O3 -march=native -mtune=native and -flto
- pg1214_o3_native_lto.cx7a_gcp_c2s60 - Postgres 12.14, the cx7a_gcp_c2s60 config and the build used: -O3 -march=native -mtune=native and -flto
- pg1310_o3_native_lto.cx7a_gcp_c2s60 - Postgres 13.10, the cx7a_gcp_c2s60 config and the build used: -O3 -march=native -mtune=native and -flto
- pg147_o3_native_lto.cx7a_gcp_c2s60 - Postgres 14.7, the cx7a_gcp_c2s60 config and the build used: -O3 -march=native -mtune=native and -flto
- pg151_o3_native_lto.cx7a_gcp_c2s60 - Postgres 15.1, the cx7a_gcp_c2s60 config and the build used: -O3 -march=native -mtune=native and -flto
- pg152_o3_native_lto.cx7a_gcp_c2s60 - Postgres 15.2, the cx7a_gcp_c2s60 config and the build used: -O3 -march=native -mtune=native and -flto
Contents
- Summary
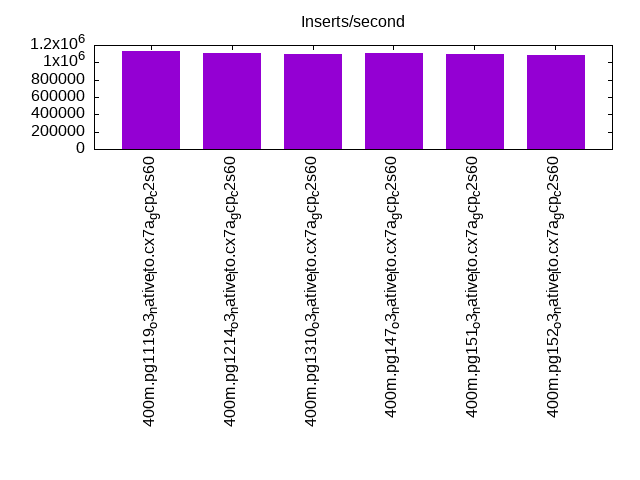
- l.i0: load without secondary indexes
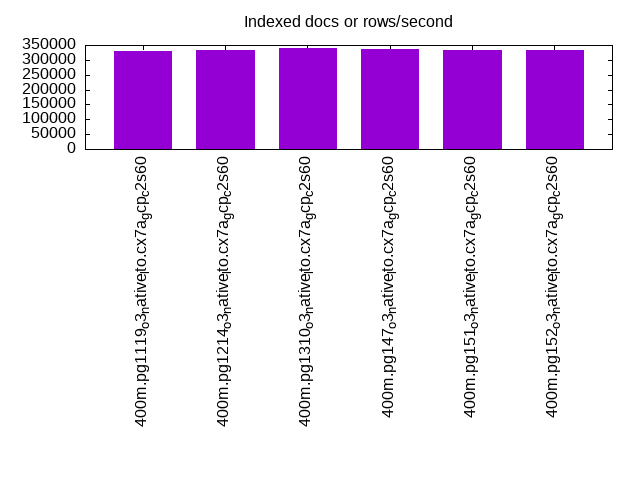
- l.x: create secondary indexes
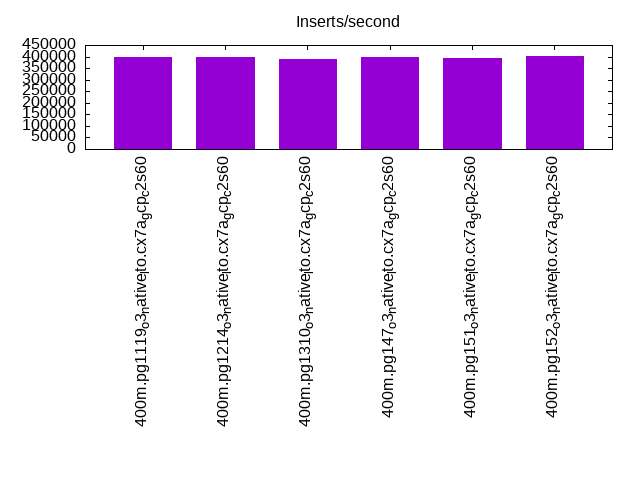
- l.i1: continue load after secondary indexes created
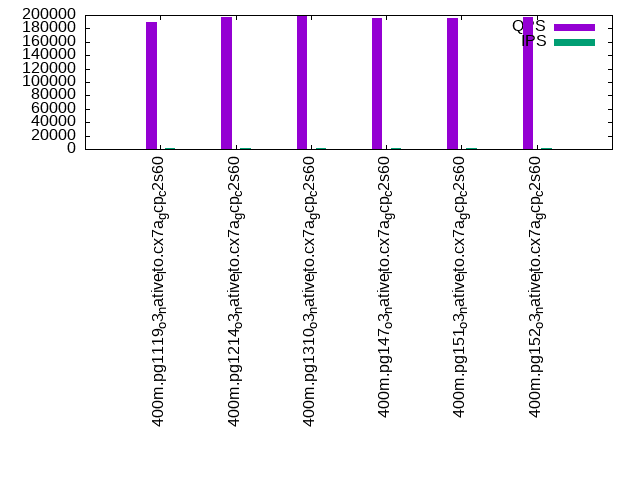
- q100.1: range queries with 100 insert/s per client
- q500.1: range queries with 500 insert/s per client
- q1000.1: range queries with 1000 insert/s per client
Summary
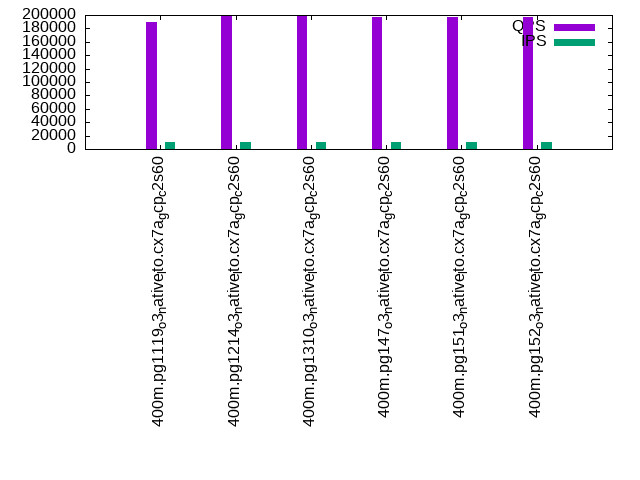
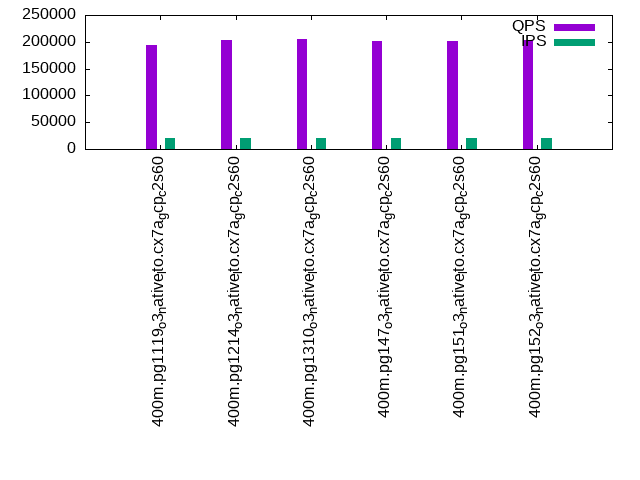
The numbers are inserts/s for l.i0 and l.i1, indexed docs (or rows) /s for l.x and queries/s for q*.2. The values are the average rate over the entire test for inserts (IPS) and queries (QPS). The range of values for IPS and QPS is split into 3 parts: bottom 25%, middle 50%, top 25%. Values in the bottom 25% have a red background, values in the top 25% have a green background and values in the middle have no color. A gray background is used for values that can be ignored because the DBMS did not sustain the target insert rate. Red backgrounds are not used when the minimum value is within 80% of the max value.
| dbms | l.i0 | l.x | l.i1 | q100.1 | q500.1 | q1000.1 |
|---|---|---|---|---|---|---|
| 400m.pg1119_o3_native_lto.cx7a_gcp_c2s60 | 1129944 | 330661 | 399600 | 188921 | 189090 | 194131 |
| 400m.pg1214_o3_native_lto.cx7a_gcp_c2s60 | 1108033 | 334252 | 398804 | 197188 | 198630 | 204002 |
| 400m.pg1310_o3_native_lto.cx7a_gcp_c2s60 | 1095890 | 338781 | 388350 | 197843 | 199177 | 204662 |
| 400m.pg147_o3_native_lto.cx7a_gcp_c2s60 | 1108033 | 337068 | 400000 | 196052 | 197464 | 201219 |
| 400m.pg151_o3_native_lto.cx7a_gcp_c2s60 | 1092896 | 333695 | 394477 | 195775 | 196554 | 201918 |
| 400m.pg152_o3_native_lto.cx7a_gcp_c2s60 | 1084011 | 333139 | 402820 | 197053 | 197432 | 202487 |
This table has relative throughput, throughput for the DBMS relative to the DBMS in the first line, using the absolute throughput from the previous table.
| dbms | l.i0 | l.x | l.i1 | q100.1 | q500.1 | q1000.1 |
|---|---|---|---|---|---|---|
| 400m.pg1119_o3_native_lto.cx7a_gcp_c2s60 | 1.00 | 1.00 | 1.00 | 1.00 | 1.00 | 1.00 |
| 400m.pg1214_o3_native_lto.cx7a_gcp_c2s60 | 0.98 | 1.01 | 1.00 | 1.04 | 1.05 | 1.05 |
| 400m.pg1310_o3_native_lto.cx7a_gcp_c2s60 | 0.97 | 1.02 | 0.97 | 1.05 | 1.05 | 1.05 |
| 400m.pg147_o3_native_lto.cx7a_gcp_c2s60 | 0.98 | 1.02 | 1.00 | 1.04 | 1.04 | 1.04 |
| 400m.pg151_o3_native_lto.cx7a_gcp_c2s60 | 0.97 | 1.01 | 0.99 | 1.04 | 1.04 | 1.04 |
| 400m.pg152_o3_native_lto.cx7a_gcp_c2s60 | 0.96 | 1.01 | 1.01 | 1.04 | 1.04 | 1.04 |
This lists the average rate of inserts/s for the tests that do inserts concurrent with queries. For such tests the query rate is listed in the table above. The read+write tests are setup so that the insert rate should match the target rate every second. Cells that are not at least 95% of the target have a red background to indicate a failure to satisfy the target.
| dbms | q100.1 | q500.1 | q1000.1 |
|---|---|---|---|
| pg1119_o3_native_lto.cx7a_gcp_c2s60 | 1976 | 9885 | 19769 |
| pg1214_o3_native_lto.cx7a_gcp_c2s60 | 1976 | 9885 | 19769 |
| pg1310_o3_native_lto.cx7a_gcp_c2s60 | 1976 | 9885 | 19769 |
| pg147_o3_native_lto.cx7a_gcp_c2s60 | 1976 | 9885 | 19769 |
| pg151_o3_native_lto.cx7a_gcp_c2s60 | 1976 | 9890 | 19769 |
| pg152_o3_native_lto.cx7a_gcp_c2s60 | 1976 | 9885 | 19769 |
| target | 2000 | 10000 | 20000 |
l.i0
l.i0: load without secondary indexes. Graphs for performance per 1-second interval are here.
Average throughput:
Insert response time histogram: each cell has the percentage of responses that take <= the time in the header and max is the max response time in seconds. For the max column values in the top 25% of the range have a red background and in the bottom 25% of the range have a green background. The red background is not used when the min value is within 80% of the max value.
| dbms | 256us | 1ms | 4ms | 16ms | 64ms | 256ms | 1s | 4s | 16s | gt | max |
|---|---|---|---|---|---|---|---|---|---|---|---|
| pg1119_o3_native_lto.cx7a_gcp_c2s60 | 27.058 | 69.873 | 3.012 | 0.015 | 0.031 | 0.011 | 0.612 | ||||
| pg1214_o3_native_lto.cx7a_gcp_c2s60 | 21.451 | 75.212 | 3.285 | 0.013 | 0.028 | 0.010 | 0.001 | 1.221 | |||
| pg1310_o3_native_lto.cx7a_gcp_c2s60 | 25.335 | 70.950 | 3.657 | 0.024 | 0.025 | 0.010 | 0.813 | ||||
| pg147_o3_native_lto.cx7a_gcp_c2s60 | 23.912 | 72.914 | 3.121 | 0.015 | 0.027 | 0.011 | nonzero | 1.883 | |||
| pg151_o3_native_lto.cx7a_gcp_c2s60 | 24.912 | 71.498 | 3.535 | 0.016 | 0.029 | 0.011 | 0.610 | ||||
| pg152_o3_native_lto.cx7a_gcp_c2s60 | 26.640 | 69.507 | 3.761 | 0.053 | 0.024 | 0.015 | 0.692 |
Performance metrics for the DBMS listed above. Some are normalized by throughput, others are not. Legend for results is here.
ips	qps	rps	rmbps	wps	wmbps	rpq	rkbpq	wpi	wkbpi	csps	cpups	cspq	cpupq	dbgb1	dbgb2	rss	maxop	p50	p99	tag
1129944	0	0	0.0	1731.1	432.9	0.000	0.000	0.002	0.392	334665	58.7	0.296	16	44.2	114.1	NA	0.612	62531	23674	400m.pg1119_o3_native_lto.cx7a_gcp_c2s60
1108033	0	0	0.0	1708.6	424.0	0.000	0.000	0.002	0.392	304461	58.5	0.275	16	43.0	112.3	0.0	1.221	61233	19279	400m.pg1214_o3_native_lto.cx7a_gcp_c2s60
1095890	0	0	0.0	1703.1	424.4	0.000	0.000	0.002	0.397	336844	57.1	0.307	16	43.0	114.9	NA	0.813	60833	16681	400m.pg1310_o3_native_lto.cx7a_gcp_c2s60
1108033	0	0	0.0	1619.2	412.1	0.000	0.000	0.001	0.381	305716	57.7	0.276	16	43.0	114.4	NA	1.883	61533	20177	400m.pg147_o3_native_lto.cx7a_gcp_c2s60
1092896	0	0	0.0	1633.2	419.1	0.000	0.000	0.001	0.393	345431	57.0	0.316	16	43.0	115.1	NA	0.610	60333	19078	400m.pg151_o3_native_lto.cx7a_gcp_c2s60
1084011	0	0	0.0	1701.2	450.7	0.000	0.000	0.002	0.426	322150	56.5	0.297	16	43.0	122.5	0.0	0.692	61730	12878	400m.pg152_o3_native_lto.cx7a_gcp_c2s60
l.x
l.x: create secondary indexes.
Average throughput:
Performance metrics for the DBMS listed above. Some are normalized by throughput, others are not. Legend for results is here.
ips	qps	rps	rmbps	wps	wmbps	rpq	rkbpq	wpi	wkbpi	csps	cpups	cspq	cpupq	dbgb1	dbgb2	rss	maxop	p50	p99	tag
330661	0	72	0.4	648.3	138.0	0.000	0.001	0.002	0.427	1953	3.3	0.006	3	79.5	155.8	0.0	0.002	NA	NA	400m.pg1119_o3_native_lto.cx7a_gcp_c2s60
334252	0	108	0.6	642.9	134.7	0.000	0.002	0.002	0.413	1962	3.3	0.006	3	78.3	152.2	0.0	0.002	NA	NA	400m.pg1214_o3_native_lto.cx7a_gcp_c2s60
338781	0	0	0.0	401.6	101.7	0.000	0.000	0.001	0.308	1427	3.3	0.004	3	78.3	150.8	0.0	0.016	NA	NA	400m.pg1310_o3_native_lto.cx7a_gcp_c2s60
337068	0	0	0.0	425.6	105.0	0.000	0.000	0.001	0.319	1073	3.1	0.003	3	78.3	152.8	0.0	0.029	NA	NA	400m.pg147_o3_native_lto.cx7a_gcp_c2s60
333695	0	0	0.0	437.2	108.2	0.000	0.000	0.001	0.332	1078	3.0	0.003	3	78.3	152.4	0.0	0.019	NA	NA	400m.pg151_o3_native_lto.cx7a_gcp_c2s60
333139	0	0	0.0	436.3	105.5	0.000	0.000	0.001	0.324	1033	3.0	0.003	3	78.3	157.8	0.0	0.002	NA	NA	400m.pg152_o3_native_lto.cx7a_gcp_c2s60
l.i1
l.i1: continue load after secondary indexes created. Graphs for performance per 1-second interval are here.
Average throughput:
Insert response time histogram: each cell has the percentage of responses that take <= the time in the header and max is the max response time in seconds. For the max column values in the top 25% of the range have a red background and in the bottom 25% of the range have a green background. The red background is not used when the min value is within 80% of the max value.
| dbms | 256us | 1ms | 4ms | 16ms | 64ms | 256ms | 1s | 4s | 16s | gt | max |
|---|---|---|---|---|---|---|---|---|---|---|---|
| pg1119_o3_native_lto.cx7a_gcp_c2s60 | 94.823 | 4.216 | 0.909 | 0.038 | 0.014 | 0.001 | 1.867 | ||||
| pg1214_o3_native_lto.cx7a_gcp_c2s60 | 94.747 | 4.361 | 0.844 | 0.033 | 0.014 | 0.001 | 2.045 | ||||
| pg1310_o3_native_lto.cx7a_gcp_c2s60 | 94.373 | 4.686 | 0.895 | 0.034 | 0.012 | nonzero | 1.749 | ||||
| pg147_o3_native_lto.cx7a_gcp_c2s60 | 94.687 | 4.372 | 0.894 | 0.031 | 0.016 | 0.001 | 1.888 | ||||
| pg151_o3_native_lto.cx7a_gcp_c2s60 | 94.534 | 4.614 | 0.808 | 0.030 | 0.014 | 0.911 | |||||
| pg152_o3_native_lto.cx7a_gcp_c2s60 | 94.671 | 4.489 | 0.794 | 0.033 | 0.013 | 0.884 |
Performance metrics for the DBMS listed above. Some are normalized by throughput, others are not. Legend for results is here.
ips	qps	rps	rmbps	wps	wmbps	rpq	rkbpq	wpi	wkbpi	csps	cpups	cspq	cpupq	dbgb1	dbgb2	rss	maxop	p50	p99	tag
399600	0	2508	12.8	2529.3	429.1	0.006	0.033	0.006	1.100	263356	53.1	0.659	40	176.5	314.9	0.0	1.867	24722	1398	400m.pg1119_o3_native_lto.cx7a_gcp_c2s60
398804	0	2293	13.4	2499.8	429.2	0.006	0.034	0.006	1.102	268418	53.7	0.673	40	170.2	307.1	0.0	2.045	24473	1798	400m.pg1214_o3_native_lto.cx7a_gcp_c2s60
388350	0	2517	14.1	2550.9	455.3	0.006	0.037	0.007	1.201	301266	52.7	0.776	41	170.2	316.8	NA	1.749	23733	1499	400m.pg1310_o3_native_lto.cx7a_gcp_c2s60
400000	0	2516	11.6	2416.5	460.3	0.006	0.030	0.006	1.178	257699	53.1	0.644	40	170.2	328.0	NA	1.888	24673	1749	400m.pg147_o3_native_lto.cx7a_gcp_c2s60
394477	0	1979	14.8	2424.2	444.5	0.005	0.039	0.006	1.154	301611	52.8	0.765	40	170.2	326.0	NA	0.911	24024	2048	400m.pg151_o3_native_lto.cx7a_gcp_c2s60
402820	0	1937	13.9	2427.0	448.8	0.005	0.035	0.006	1.141	283063	53.5	0.703	40	170.2	330.6	0.0	0.884	24522	2547	400m.pg152_o3_native_lto.cx7a_gcp_c2s60
q100.1
q100.1: range queries with 100 insert/s per client. Graphs for performance per 1-second interval are here.
Average throughput:
Query response time histogram: each cell has the percentage of responses that take <= the time in the header and max is the max response time in seconds. For max values in the top 25% of the range have a red background and in the bottom 25% of the range have a green background. The red background is not used when the min value is within 80% of the max value.
| dbms | 256us | 1ms | 4ms | 16ms | 64ms | 256ms | 1s | 4s | 16s | gt | max |
|---|---|---|---|---|---|---|---|---|---|---|---|
| pg1119_o3_native_lto.cx7a_gcp_c2s60 | 99.966 | 0.027 | 0.006 | 0.001 | nonzero | nonzero | nonzero | 1.654 | |||
| pg1214_o3_native_lto.cx7a_gcp_c2s60 | 99.973 | 0.020 | 0.006 | 0.001 | nonzero | 0.025 | |||||
| pg1310_o3_native_lto.cx7a_gcp_c2s60 | 99.974 | 0.019 | 0.006 | 0.001 | nonzero | 0.025 | |||||
| pg147_o3_native_lto.cx7a_gcp_c2s60 | 99.974 | 0.019 | 0.006 | 0.001 | nonzero | 0.023 | |||||
| pg151_o3_native_lto.cx7a_gcp_c2s60 | 99.974 | 0.019 | 0.006 | 0.001 | nonzero | 0.024 | |||||
| pg152_o3_native_lto.cx7a_gcp_c2s60 | 99.974 | 0.019 | 0.006 | 0.001 | nonzero | 0.024 |
Insert response time histogram: each cell has the percentage of responses that take <= the time in the header and max is the max response time in seconds. For max values in the top 25% of the range have a red background and in the bottom 25% of the range have a green background. The red background is not used when the min value is within 80% of the max value.
| dbms | 256us | 1ms | 4ms | 16ms | 64ms | 256ms | 1s | 4s | 16s | gt | max |
|---|---|---|---|---|---|---|---|---|---|---|---|
| pg1119_o3_native_lto.cx7a_gcp_c2s60 | 98.375 | 1.350 | 0.272 | 0.001 | 0.001 | 1.653 | |||||
| pg1214_o3_native_lto.cx7a_gcp_c2s60 | 98.225 | 1.449 | 0.314 | 0.010 | 0.001 | 0.001 | 1.807 | ||||
| pg1310_o3_native_lto.cx7a_gcp_c2s60 | 98.401 | 1.363 | 0.236 | 0.045 | |||||||
| pg147_o3_native_lto.cx7a_gcp_c2s60 | 98.221 | 1.487 | 0.272 | 0.010 | 0.010 | 0.274 | |||||
| pg151_o3_native_lto.cx7a_gcp_c2s60 | 97.812 | 1.815 | 0.372 | 0.056 | |||||||
| pg152_o3_native_lto.cx7a_gcp_c2s60 | 98.453 | 1.325 | 0.199 | 0.011 | 0.013 | 0.347 |
Performance metrics for the DBMS listed above. Some are normalized by throughput, others are not. Legend for results is here.
ips	qps	rps	rmbps	wps	wmbps	rpq	rkbpq	wpi	wkbpi	csps	cpups	cspq	cpupq	dbgb1	dbgb2	rss	maxop	p50	p99	tag
1976	188921	0	0.0	2907.9	68.0	0.000	0.000	1.472	35.231	670220	63.0	3.548	100	177.6	291.9	0.0	1.654	9350	8966	400m.pg1119_o3_native_lto.cx7a_gcp_c2s60
1976	197188	0	0.0	2782.2	74.0	0.000	0.000	1.408	38.348	698835	62.9	3.544	96	171.1	291.5	0.0	0.025	9861	9366	400m.pg1214_o3_native_lto.cx7a_gcp_c2s60
1976	197843	1	0.0	2558.0	67.6	0.000	0.000	1.295	35.012	701944	62.9	3.548	95	171.1	274.8	0.0	0.025	9877	9430	400m.pg1310_o3_native_lto.cx7a_gcp_c2s60
1976	196052	1	0.0	2581.0	63.8	0.000	0.000	1.306	33.064	698805	63.0	3.564	96	171.1	312.3	0.0	0.023	9765	9429	400m.pg147_o3_native_lto.cx7a_gcp_c2s60
1976	195775	1	0.0	2510.3	63.0	0.000	0.000	1.271	32.641	697644	62.9	3.564	96	171.1	310.9	0.0	0.024	9685	9318	400m.pg151_o3_native_lto.cx7a_gcp_c2s60
1976	197053	0	0.0	2561.3	62.9	0.000	0.000	1.296	32.622	699264	63.0	3.549	96	171.1	307.8	0.0	0.024	9717	9318	400m.pg152_o3_native_lto.cx7a_gcp_c2s60
q500.1
q500.1: range queries with 500 insert/s per client. Graphs for performance per 1-second interval are here.
Average throughput:
Query response time histogram: each cell has the percentage of responses that take <= the time in the header and max is the max response time in seconds. For max values in the top 25% of the range have a red background and in the bottom 25% of the range have a green background. The red background is not used when the min value is within 80% of the max value.
| dbms | 256us | 1ms | 4ms | 16ms | 64ms | 256ms | 1s | 4s | 16s | gt | max |
|---|---|---|---|---|---|---|---|---|---|---|---|
| pg1119_o3_native_lto.cx7a_gcp_c2s60 | 99.904 | 0.066 | 0.027 | 0.003 | nonzero | nonzero | 0.126 | ||||
| pg1214_o3_native_lto.cx7a_gcp_c2s60 | 99.917 | 0.054 | 0.026 | 0.003 | nonzero | 0.035 | |||||
| pg1310_o3_native_lto.cx7a_gcp_c2s60 | 99.916 | 0.055 | 0.026 | 0.002 | nonzero | 0.042 | |||||
| pg147_o3_native_lto.cx7a_gcp_c2s60 | 99.915 | 0.055 | 0.026 | 0.003 | nonzero | nonzero | nonzero | 0.352 | |||
| pg151_o3_native_lto.cx7a_gcp_c2s60 | 99.914 | 0.057 | 0.026 | 0.003 | nonzero | nonzero | 0.120 | ||||
| pg152_o3_native_lto.cx7a_gcp_c2s60 | 99.916 | 0.055 | 0.026 | 0.003 | nonzero | 0.035 |
Insert response time histogram: each cell has the percentage of responses that take <= the time in the header and max is the max response time in seconds. For max values in the top 25% of the range have a red background and in the bottom 25% of the range have a green background. The red background is not used when the min value is within 80% of the max value.
| dbms | 256us | 1ms | 4ms | 16ms | 64ms | 256ms | 1s | 4s | 16s | gt | max |
|---|---|---|---|---|---|---|---|---|---|---|---|
| pg1119_o3_native_lto.cx7a_gcp_c2s60 | 51.664 | 28.431 | 19.621 | 0.284 | 0.188 | ||||||
| pg1214_o3_native_lto.cx7a_gcp_c2s60 | 51.460 | 28.213 | 19.995 | 0.333 | 0.185 | ||||||
| pg1310_o3_native_lto.cx7a_gcp_c2s60 | 52.581 | 27.975 | 19.152 | 0.292 | 0.171 | ||||||
| pg147_o3_native_lto.cx7a_gcp_c2s60 | 52.292 | 27.560 | 19.876 | 0.266 | 0.006 | 0.473 | |||||
| pg151_o3_native_lto.cx7a_gcp_c2s60 | 52.579 | 27.501 | 19.656 | 0.264 | 0.171 | ||||||
| pg152_o3_native_lto.cx7a_gcp_c2s60 | 52.591 | 27.501 | 19.639 | 0.270 | 0.228 |
Performance metrics for the DBMS listed above. Some are normalized by throughput, others are not. Legend for results is here.
ips	qps	rps	rmbps	wps	wmbps	rpq	rkbpq	wpi	wkbpi	csps	cpups	cspq	cpupq	dbgb1	dbgb2	rss	maxop	p50	p99	tag
9885	189090	0	0.0	5259.5	158.1	0.000	0.000	0.532	16.378	659524	64.1	3.488	102	183.7	258.5	0.0	0.126	9366	8934	400m.pg1119_o3_native_lto.cx7a_gcp_c2s60
9885	198630	0	0.0	4782.9	153.6	0.000	0.000	0.484	15.910	691619	64.1	3.482	97	176.0	255.8	0.0	0.035	9829	9318	400m.pg1214_o3_native_lto.cx7a_gcp_c2s60
9885	199177	0	0.0	4670.3	149.7	0.000	0.000	0.472	15.512	692523	64.1	3.477	97	176.0	243.5	0.0	0.042	9865	9365	400m.pg1310_o3_native_lto.cx7a_gcp_c2s60
9885	197464	0	0.0	4744.2	144.9	0.000	0.000	0.480	15.010	689664	64.1	3.493	97	176.0	266.8	0.0	0.352	9781	9306	400m.pg147_o3_native_lto.cx7a_gcp_c2s60
9890	196554	0	0.0	4560.7	141.6	0.000	0.000	0.461	14.659	686810	64.1	3.494	98	176.0	260.3	0.0	0.120	9813	9350	400m.pg151_o3_native_lto.cx7a_gcp_c2s60
9885	197432	2	0.0	4633.5	143.6	0.000	0.000	0.469	14.880	689200	64.1	3.491	97	176.0	259.4	0.0	0.035	9801	9334	400m.pg152_o3_native_lto.cx7a_gcp_c2s60
q1000.1
q1000.1: range queries with 1000 insert/s per client. Graphs for performance per 1-second interval are here.
Average throughput:
Query response time histogram: each cell has the percentage of responses that take <= the time in the header and max is the max response time in seconds. For max values in the top 25% of the range have a red background and in the bottom 25% of the range have a green background. The red background is not used when the min value is within 80% of the max value.
| dbms | 256us | 1ms | 4ms | 16ms | 64ms | 256ms | 1s | 4s | 16s | gt | max |
|---|---|---|---|---|---|---|---|---|---|---|---|
| pg1119_o3_native_lto.cx7a_gcp_c2s60 | 99.857 | 0.102 | 0.038 | 0.004 | nonzero | 0.049 | |||||
| pg1214_o3_native_lto.cx7a_gcp_c2s60 | 99.865 | 0.094 | 0.038 | 0.004 | nonzero | 0.036 | |||||
| pg1310_o3_native_lto.cx7a_gcp_c2s60 | 99.867 | 0.093 | 0.036 | 0.003 | nonzero | 0.037 | |||||
| pg147_o3_native_lto.cx7a_gcp_c2s60 | 99.861 | 0.097 | 0.038 | 0.004 | nonzero | 0.036 | |||||
| pg151_o3_native_lto.cx7a_gcp_c2s60 | 99.861 | 0.098 | 0.037 | 0.004 | nonzero | 0.054 | |||||
| pg152_o3_native_lto.cx7a_gcp_c2s60 | 99.865 | 0.095 | 0.037 | 0.004 | nonzero | 0.033 |
Insert response time histogram: each cell has the percentage of responses that take <= the time in the header and max is the max response time in seconds. For max values in the top 25% of the range have a red background and in the bottom 25% of the range have a green background. The red background is not used when the min value is within 80% of the max value.
| dbms | 256us | 1ms | 4ms | 16ms | 64ms | 256ms | 1s | 4s | 16s | gt | max |
|---|---|---|---|---|---|---|---|---|---|---|---|
| pg1119_o3_native_lto.cx7a_gcp_c2s60 | 63.720 | 24.445 | 11.592 | 0.242 | 0.187 | ||||||
| pg1214_o3_native_lto.cx7a_gcp_c2s60 | 60.853 | 25.980 | 12.861 | 0.307 | 0.204 | ||||||
| pg1310_o3_native_lto.cx7a_gcp_c2s60 | 61.971 | 25.846 | 11.925 | 0.258 | 0.169 | ||||||
| pg147_o3_native_lto.cx7a_gcp_c2s60 | 61.064 | 26.606 | 12.103 | 0.227 | 0.201 | ||||||
| pg151_o3_native_lto.cx7a_gcp_c2s60 | 61.153 | 26.291 | 12.328 | 0.228 | 0.163 | ||||||
| pg152_o3_native_lto.cx7a_gcp_c2s60 | 60.778 | 26.775 | 12.220 | 0.226 | 0.216 |
Performance metrics for the DBMS listed above. Some are normalized by throughput, others are not. Legend for results is here.
ips	qps	rps	rmbps	wps	wmbps	rpq	rkbpq	wpi	wkbpi	csps	cpups	cspq	cpupq	dbgb1	dbgb2	rss	maxop	p50	p99	tag
19769	194131	4	0.0	4947.6	221.0	0.000	0.000	0.250	11.449	653160	65.5	3.365	101	197.2	262.6	0.0	0.049	9594	8954	400m.pg1119_o3_native_lto.cx7a_gcp_c2s60
19769	204002	3	0.0	4426.2	217.5	0.000	0.000	0.224	11.264	684034	65.4	3.353	96	189.4	258.9	0.0	0.036	10165	9446	400m.pg1214_o3_native_lto.cx7a_gcp_c2s60
19769	204662	0	0.0	4359.9	208.6	0.000	0.000	0.221	10.805	686147	65.4	3.353	96	189.4	252.6	0.0	0.037	10149	9446	400m.pg1310_o3_native_lto.cx7a_gcp_c2s60
19769	201219	0	0.0	4705.3	199.2	0.000	0.000	0.238	10.320	679712	65.2	3.378	97	189.4	270.5	0.0	0.036	9957	9286	400m.pg147_o3_native_lto.cx7a_gcp_c2s60
19769	201918	0	0.0	4739.5	203.3	0.000	0.000	0.240	10.532	681698	65.2	3.376	97	189.4	268.9	0.0	0.054	10053	9398	400m.pg151_o3_native_lto.cx7a_gcp_c2s60
19769	202487	0	0.0	4732.2	200.0	0.000	0.000	0.239	10.357	682184	65.3	3.369	97	189.4	268.3	0.0	0.033	10121	9430	400m.pg152_o3_native_lto.cx7a_gcp_c2s60
l.i0
l.i0: load without secondary indexes
Performance metrics for all DBMS, not just the ones listed above. Some are normalized by throughput, others are not. Legend for results is here.
ips	qps	rps	rmbps	wps	wmbps	rpq	rkbpq	wpi	wkbpi	csps	cpups	cspq	cpupq	dbgb1	dbgb2	rss	maxop	p50	p99	tag
1129944	0	0	0.0	1731.1	432.9	0.000	0.000	0.002	0.392	334665	58.7	0.296	16	44.2	114.1	NA	0.612	62531	23674	400m.pg1119_o3_native_lto.cx7a_gcp_c2s60
1108033	0	0	0.0	1708.6	424.0	0.000	0.000	0.002	0.392	304461	58.5	0.275	16	43.0	112.3	0.0	1.221	61233	19279	400m.pg1214_o3_native_lto.cx7a_gcp_c2s60
1095890	0	0	0.0	1703.1	424.4	0.000	0.000	0.002	0.397	336844	57.1	0.307	16	43.0	114.9	NA	0.813	60833	16681	400m.pg1310_o3_native_lto.cx7a_gcp_c2s60
1108033	0	0	0.0	1619.2	412.1	0.000	0.000	0.001	0.381	305716	57.7	0.276	16	43.0	114.4	NA	1.883	61533	20177	400m.pg147_o3_native_lto.cx7a_gcp_c2s60
1092896	0	0	0.0	1633.2	419.1	0.000	0.000	0.001	0.393	345431	57.0	0.316	16	43.0	115.1	NA	0.610	60333	19078	400m.pg151_o3_native_lto.cx7a_gcp_c2s60
1084011	0	0	0.0	1701.2	450.7	0.000	0.000	0.002	0.426	322150	56.5	0.297	16	43.0	122.5	0.0	0.692	61730	12878	400m.pg152_o3_native_lto.cx7a_gcp_c2s60
l.x
l.x: create secondary indexes
Performance metrics for all DBMS, not just the ones listed above. Some are normalized by throughput, others are not. Legend for results is here.
ips	qps	rps	rmbps	wps	wmbps	rpq	rkbpq	wpi	wkbpi	csps	cpups	cspq	cpupq	dbgb1	dbgb2	rss	maxop	p50	p99	tag
330661	0	72	0.4	648.3	138.0	0.000	0.001	0.002	0.427	1953	3.3	0.006	3	79.5	155.8	0.0	0.002	NA	NA	400m.pg1119_o3_native_lto.cx7a_gcp_c2s60
334252	0	108	0.6	642.9	134.7	0.000	0.002	0.002	0.413	1962	3.3	0.006	3	78.3	152.2	0.0	0.002	NA	NA	400m.pg1214_o3_native_lto.cx7a_gcp_c2s60
338781	0	0	0.0	401.6	101.7	0.000	0.000	0.001	0.308	1427	3.3	0.004	3	78.3	150.8	0.0	0.016	NA	NA	400m.pg1310_o3_native_lto.cx7a_gcp_c2s60
337068	0	0	0.0	425.6	105.0	0.000	0.000	0.001	0.319	1073	3.1	0.003	3	78.3	152.8	0.0	0.029	NA	NA	400m.pg147_o3_native_lto.cx7a_gcp_c2s60
333695	0	0	0.0	437.2	108.2	0.000	0.000	0.001	0.332	1078	3.0	0.003	3	78.3	152.4	0.0	0.019	NA	NA	400m.pg151_o3_native_lto.cx7a_gcp_c2s60
333139	0	0	0.0	436.3	105.5	0.000	0.000	0.001	0.324	1033	3.0	0.003	3	78.3	157.8	0.0	0.002	NA	NA	400m.pg152_o3_native_lto.cx7a_gcp_c2s60
l.i1
l.i1: continue load after secondary indexes created
Performance metrics for all DBMS, not just the ones listed above. Some are normalized by throughput, others are not. Legend for results is here.
ips	qps	rps	rmbps	wps	wmbps	rpq	rkbpq	wpi	wkbpi	csps	cpups	cspq	cpupq	dbgb1	dbgb2	rss	maxop	p50	p99	tag
399600	0	2508	12.8	2529.3	429.1	0.006	0.033	0.006	1.100	263356	53.1	0.659	40	176.5	314.9	0.0	1.867	24722	1398	400m.pg1119_o3_native_lto.cx7a_gcp_c2s60
398804	0	2293	13.4	2499.8	429.2	0.006	0.034	0.006	1.102	268418	53.7	0.673	40	170.2	307.1	0.0	2.045	24473	1798	400m.pg1214_o3_native_lto.cx7a_gcp_c2s60
388350	0	2517	14.1	2550.9	455.3	0.006	0.037	0.007	1.201	301266	52.7	0.776	41	170.2	316.8	NA	1.749	23733	1499	400m.pg1310_o3_native_lto.cx7a_gcp_c2s60
400000	0	2516	11.6	2416.5	460.3	0.006	0.030	0.006	1.178	257699	53.1	0.644	40	170.2	328.0	NA	1.888	24673	1749	400m.pg147_o3_native_lto.cx7a_gcp_c2s60
394477	0	1979	14.8	2424.2	444.5	0.005	0.039	0.006	1.154	301611	52.8	0.765	40	170.2	326.0	NA	0.911	24024	2048	400m.pg151_o3_native_lto.cx7a_gcp_c2s60
402820	0	1937	13.9	2427.0	448.8	0.005	0.035	0.006	1.141	283063	53.5	0.703	40	170.2	330.6	0.0	0.884	24522	2547	400m.pg152_o3_native_lto.cx7a_gcp_c2s60
q100.1
q100.1: range queries with 100 insert/s per client
Performance metrics for all DBMS, not just the ones listed above. Some are normalized by throughput, others are not. Legend for results is here.
ips	qps	rps	rmbps	wps	wmbps	rpq	rkbpq	wpi	wkbpi	csps	cpups	cspq	cpupq	dbgb1	dbgb2	rss	maxop	p50	p99	tag
1976	188921	0	0.0	2907.9	68.0	0.000	0.000	1.472	35.231	670220	63.0	3.548	100	177.6	291.9	0.0	1.654	9350	8966	400m.pg1119_o3_native_lto.cx7a_gcp_c2s60
1976	197188	0	0.0	2782.2	74.0	0.000	0.000	1.408	38.348	698835	62.9	3.544	96	171.1	291.5	0.0	0.025	9861	9366	400m.pg1214_o3_native_lto.cx7a_gcp_c2s60
1976	197843	1	0.0	2558.0	67.6	0.000	0.000	1.295	35.012	701944	62.9	3.548	95	171.1	274.8	0.0	0.025	9877	9430	400m.pg1310_o3_native_lto.cx7a_gcp_c2s60
1976	196052	1	0.0	2581.0	63.8	0.000	0.000	1.306	33.064	698805	63.0	3.564	96	171.1	312.3	0.0	0.023	9765	9429	400m.pg147_o3_native_lto.cx7a_gcp_c2s60
1976	195775	1	0.0	2510.3	63.0	0.000	0.000	1.271	32.641	697644	62.9	3.564	96	171.1	310.9	0.0	0.024	9685	9318	400m.pg151_o3_native_lto.cx7a_gcp_c2s60
1976	197053	0	0.0	2561.3	62.9	0.000	0.000	1.296	32.622	699264	63.0	3.549	96	171.1	307.8	0.0	0.024	9717	9318	400m.pg152_o3_native_lto.cx7a_gcp_c2s60
q500.1
q500.1: range queries with 500 insert/s per client
Performance metrics for all DBMS, not just the ones listed above. Some are normalized by throughput, others are not. Legend for results is here.
ips	qps	rps	rmbps	wps	wmbps	rpq	rkbpq	wpi	wkbpi	csps	cpups	cspq	cpupq	dbgb1	dbgb2	rss	maxop	p50	p99	tag
9885	189090	0	0.0	5259.5	158.1	0.000	0.000	0.532	16.378	659524	64.1	3.488	102	183.7	258.5	0.0	0.126	9366	8934	400m.pg1119_o3_native_lto.cx7a_gcp_c2s60
9885	198630	0	0.0	4782.9	153.6	0.000	0.000	0.484	15.910	691619	64.1	3.482	97	176.0	255.8	0.0	0.035	9829	9318	400m.pg1214_o3_native_lto.cx7a_gcp_c2s60
9885	199177	0	0.0	4670.3	149.7	0.000	0.000	0.472	15.512	692523	64.1	3.477	97	176.0	243.5	0.0	0.042	9865	9365	400m.pg1310_o3_native_lto.cx7a_gcp_c2s60
9885	197464	0	0.0	4744.2	144.9	0.000	0.000	0.480	15.010	689664	64.1	3.493	97	176.0	266.8	0.0	0.352	9781	9306	400m.pg147_o3_native_lto.cx7a_gcp_c2s60
9890	196554	0	0.0	4560.7	141.6	0.000	0.000	0.461	14.659	686810	64.1	3.494	98	176.0	260.3	0.0	0.120	9813	9350	400m.pg151_o3_native_lto.cx7a_gcp_c2s60
9885	197432	2	0.0	4633.5	143.6	0.000	0.000	0.469	14.880	689200	64.1	3.491	97	176.0	259.4	0.0	0.035	9801	9334	400m.pg152_o3_native_lto.cx7a_gcp_c2s60
q1000.1
q1000.1: range queries with 1000 insert/s per client
Performance metrics for all DBMS, not just the ones listed above. Some are normalized by throughput, others are not. Legend for results is here.
ips	qps	rps	rmbps	wps	wmbps	rpq	rkbpq	wpi	wkbpi	csps	cpups	cspq	cpupq	dbgb1	dbgb2	rss	maxop	p50	p99	tag
19769	194131	4	0.0	4947.6	221.0	0.000	0.000	0.250	11.449	653160	65.5	3.365	101	197.2	262.6	0.0	0.049	9594	8954	400m.pg1119_o3_native_lto.cx7a_gcp_c2s60
19769	204002	3	0.0	4426.2	217.5	0.000	0.000	0.224	11.264	684034	65.4	3.353	96	189.4	258.9	0.0	0.036	10165	9446	400m.pg1214_o3_native_lto.cx7a_gcp_c2s60
19769	204662	0	0.0	4359.9	208.6	0.000	0.000	0.221	10.805	686147	65.4	3.353	96	189.4	252.6	0.0	0.037	10149	9446	400m.pg1310_o3_native_lto.cx7a_gcp_c2s60
19769	201219	0	0.0	4705.3	199.2	0.000	0.000	0.238	10.320	679712	65.2	3.378	97	189.4	270.5	0.0	0.036	9957	9286	400m.pg147_o3_native_lto.cx7a_gcp_c2s60
19769	201918	0	0.0	4739.5	203.3	0.000	0.000	0.240	10.532	681698	65.2	3.376	97	189.4	268.9	0.0	0.054	10053	9398	400m.pg151_o3_native_lto.cx7a_gcp_c2s60
19769	202487	0	0.0	4732.2	200.0	0.000	0.000	0.239	10.357	682184	65.3	3.369	97	189.4	268.3	0.0	0.033	10121	9430	400m.pg152_o3_native_lto.cx7a_gcp_c2s60
l.i0
- l.i0: load without secondary indexes
- Legend for results is here.
- Each entry lists the percentage of responses that fit in that bucket (slower than max time for previous bucket, faster than min time for next bucket).
Insert response time histogram
256us	1ms	4ms	16ms	64ms	256ms	1s	4s	16s	gt	max	tag
0.000	27.058	69.873	3.012	0.015	0.031	0.011	0.000	0.000	0.000	0.612	pg1119_o3_native_lto.cx7a_gcp_c2s60
0.000	21.451	75.212	3.285	0.013	0.028	0.010	0.001	0.000	0.000	1.221	pg1214_o3_native_lto.cx7a_gcp_c2s60
0.000	25.335	70.950	3.657	0.024	0.025	0.010	0.000	0.000	0.000	0.813	pg1310_o3_native_lto.cx7a_gcp_c2s60
0.000	23.912	72.914	3.121	0.015	0.027	0.011	nonzero	0.000	0.000	1.883	pg147_o3_native_lto.cx7a_gcp_c2s60
0.000	24.912	71.498	3.535	0.016	0.029	0.011	0.000	0.000	0.000	0.610	pg151_o3_native_lto.cx7a_gcp_c2s60
0.000	26.640	69.507	3.761	0.053	0.024	0.015	0.000	0.000	0.000	0.692	pg152_o3_native_lto.cx7a_gcp_c2s60
l.x
- l.x: create secondary indexes
- Legend for results is here.
- Each entry lists the percentage of responses that fit in that bucket (slower than max time for previous bucket, faster than min time for next bucket).
TODO - determine whether there is data for create index response time
l.i1
- l.i1: continue load after secondary indexes created
- Legend for results is here.
- Each entry lists the percentage of responses that fit in that bucket (slower than max time for previous bucket, faster than min time for next bucket).
Insert response time histogram
256us	1ms	4ms	16ms	64ms	256ms	1s	4s	16s	gt	max	tag
0.000	0.000	94.823	4.216	0.909	0.038	0.014	0.001	0.000	0.000	1.867	pg1119_o3_native_lto.cx7a_gcp_c2s60
0.000	0.000	94.747	4.361	0.844	0.033	0.014	0.001	0.000	0.000	2.045	pg1214_o3_native_lto.cx7a_gcp_c2s60
0.000	0.000	94.373	4.686	0.895	0.034	0.012	nonzero	0.000	0.000	1.749	pg1310_o3_native_lto.cx7a_gcp_c2s60
0.000	0.000	94.687	4.372	0.894	0.031	0.016	0.001	0.000	0.000	1.888	pg147_o3_native_lto.cx7a_gcp_c2s60
0.000	0.000	94.534	4.614	0.808	0.030	0.014	0.000	0.000	0.000	0.911	pg151_o3_native_lto.cx7a_gcp_c2s60
0.000	0.000	94.671	4.489	0.794	0.033	0.013	0.000	0.000	0.000	0.884	pg152_o3_native_lto.cx7a_gcp_c2s60
q100.1
- q100.1: range queries with 100 insert/s per client
- Legend for results is here.
- Each entry lists the percentage of responses that fit in that bucket (slower than max time for previous bucket, faster than min time for next bucket).
Query response time histogram
256us	1ms	4ms	16ms	64ms	256ms	1s	4s	16s	gt	max	tag
99.966	0.027	0.006	0.001	nonzero	0.000	nonzero	nonzero	0.000	0.000	1.654	pg1119_o3_native_lto.cx7a_gcp_c2s60
99.973	0.020	0.006	0.001	nonzero	0.000	0.000	0.000	0.000	0.000	0.025	pg1214_o3_native_lto.cx7a_gcp_c2s60
99.974	0.019	0.006	0.001	nonzero	0.000	0.000	0.000	0.000	0.000	0.025	pg1310_o3_native_lto.cx7a_gcp_c2s60
99.974	0.019	0.006	0.001	nonzero	0.000	0.000	0.000	0.000	0.000	0.023	pg147_o3_native_lto.cx7a_gcp_c2s60
99.974	0.019	0.006	0.001	nonzero	0.000	0.000	0.000	0.000	0.000	0.024	pg151_o3_native_lto.cx7a_gcp_c2s60
99.974	0.019	0.006	0.001	nonzero	0.000	0.000	0.000	0.000	0.000	0.024	pg152_o3_native_lto.cx7a_gcp_c2s60
Insert response time histogram
256us	1ms	4ms	16ms	64ms	256ms	1s	4s	16s	gt	max	tag
0.000	0.000	98.375	1.350	0.272	0.000	0.001	0.001	0.000	0.000	1.653	pg1119_o3_native_lto.cx7a_gcp_c2s60
0.000	0.000	98.225	1.449	0.314	0.010	0.001	0.001	0.000	0.000	1.807	pg1214_o3_native_lto.cx7a_gcp_c2s60
0.000	0.000	98.401	1.363	0.236	0.000	0.000	0.000	0.000	0.000	0.045	pg1310_o3_native_lto.cx7a_gcp_c2s60
0.000	0.000	98.221	1.487	0.272	0.010	0.010	0.000	0.000	0.000	0.274	pg147_o3_native_lto.cx7a_gcp_c2s60
0.000	0.000	97.812	1.815	0.372	0.000	0.000	0.000	0.000	0.000	0.056	pg151_o3_native_lto.cx7a_gcp_c2s60
0.000	0.000	98.453	1.325	0.199	0.011	0.013	0.000	0.000	0.000	0.347	pg152_o3_native_lto.cx7a_gcp_c2s60
q500.1
- q500.1: range queries with 500 insert/s per client
- Legend for results is here.
- Each entry lists the percentage of responses that fit in that bucket (slower than max time for previous bucket, faster than min time for next bucket).
Query response time histogram
256us	1ms	4ms	16ms	64ms	256ms	1s	4s	16s	gt	max	tag
99.904	0.066	0.027	0.003	nonzero	nonzero	0.000	0.000	0.000	0.000	0.126	pg1119_o3_native_lto.cx7a_gcp_c2s60
99.917	0.054	0.026	0.003	nonzero	0.000	0.000	0.000	0.000	0.000	0.035	pg1214_o3_native_lto.cx7a_gcp_c2s60
99.916	0.055	0.026	0.002	nonzero	0.000	0.000	0.000	0.000	0.000	0.042	pg1310_o3_native_lto.cx7a_gcp_c2s60
99.915	0.055	0.026	0.003	nonzero	nonzero	nonzero	0.000	0.000	0.000	0.352	pg147_o3_native_lto.cx7a_gcp_c2s60
99.914	0.057	0.026	0.003	nonzero	nonzero	0.000	0.000	0.000	0.000	0.120	pg151_o3_native_lto.cx7a_gcp_c2s60
99.916	0.055	0.026	0.003	nonzero	0.000	0.000	0.000	0.000	0.000	0.035	pg152_o3_native_lto.cx7a_gcp_c2s60
Insert response time histogram
256us	1ms	4ms	16ms	64ms	256ms	1s	4s	16s	gt	max	tag
0.000	0.000	51.664	28.431	19.621	0.284	0.000	0.000	0.000	0.000	0.188	pg1119_o3_native_lto.cx7a_gcp_c2s60
0.000	0.000	51.460	28.213	19.995	0.333	0.000	0.000	0.000	0.000	0.185	pg1214_o3_native_lto.cx7a_gcp_c2s60
0.000	0.000	52.581	27.975	19.152	0.292	0.000	0.000	0.000	0.000	0.171	pg1310_o3_native_lto.cx7a_gcp_c2s60
0.000	0.000	52.292	27.560	19.876	0.266	0.006	0.000	0.000	0.000	0.473	pg147_o3_native_lto.cx7a_gcp_c2s60
0.000	0.000	52.579	27.501	19.656	0.264	0.000	0.000	0.000	0.000	0.171	pg151_o3_native_lto.cx7a_gcp_c2s60
0.000	0.000	52.591	27.501	19.639	0.270	0.000	0.000	0.000	0.000	0.228	pg152_o3_native_lto.cx7a_gcp_c2s60
q1000.1
- q1000.1: range queries with 1000 insert/s per client
- Legend for results is here.
- Each entry lists the percentage of responses that fit in that bucket (slower than max time for previous bucket, faster than min time for next bucket).
Query response time histogram
256us	1ms	4ms	16ms	64ms	256ms	1s	4s	16s	gt	max	tag
99.857	0.102	0.038	0.004	nonzero	0.000	0.000	0.000	0.000	0.000	0.049	pg1119_o3_native_lto.cx7a_gcp_c2s60
99.865	0.094	0.038	0.004	nonzero	0.000	0.000	0.000	0.000	0.000	0.036	pg1214_o3_native_lto.cx7a_gcp_c2s60
99.867	0.093	0.036	0.003	nonzero	0.000	0.000	0.000	0.000	0.000	0.037	pg1310_o3_native_lto.cx7a_gcp_c2s60
99.861	0.097	0.038	0.004	nonzero	0.000	0.000	0.000	0.000	0.000	0.036	pg147_o3_native_lto.cx7a_gcp_c2s60
99.861	0.098	0.037	0.004	nonzero	0.000	0.000	0.000	0.000	0.000	0.054	pg151_o3_native_lto.cx7a_gcp_c2s60
99.865	0.095	0.037	0.004	nonzero	0.000	0.000	0.000	0.000	0.000	0.033	pg152_o3_native_lto.cx7a_gcp_c2s60
Insert response time histogram
256us	1ms	4ms	16ms	64ms	256ms	1s	4s	16s	gt	max	tag
0.000	0.000	63.720	24.445	11.592	0.242	0.000	0.000	0.000	0.000	0.187	pg1119_o3_native_lto.cx7a_gcp_c2s60
0.000	0.000	60.853	25.980	12.861	0.307	0.000	0.000	0.000	0.000	0.204	pg1214_o3_native_lto.cx7a_gcp_c2s60
0.000	0.000	61.971	25.846	11.925	0.258	0.000	0.000	0.000	0.000	0.169	pg1310_o3_native_lto.cx7a_gcp_c2s60
0.000	0.000	61.064	26.606	12.103	0.227	0.000	0.000	0.000	0.000	0.201	pg147_o3_native_lto.cx7a_gcp_c2s60
0.000	0.000	61.153	26.291	12.328	0.228	0.000	0.000	0.000	0.000	0.163	pg151_o3_native_lto.cx7a_gcp_c2s60
0.000	0.000	60.778	26.775	12.220	0.226	0.000	0.000	0.000	0.000	0.216	pg152_o3_native_lto.cx7a_gcp_c2s60