Introduction
This is a report for the insert benchmark with 400M docs and 20 client(s). It is generated by scripts (bash, awk, sed) and Tufte might not be impressed. An overview of the insert benchmark is here and a short update is here. Below, by DBMS, I mean DBMS+version.config. An example is my8020.c10b40 where my means MySQL, 8020 is version 8.0.20 and c10b40 is the name for the configuration file.
The test server is c2-standard-60 from GCP with 30 cores, hyperthreads disabled, 240G RAM and 3T of NVMe (XFS with RAID0 over 8 devices). The benchmark was run with 20 clients and there were 1 or 2 connections per client (1 for queries, 1 for inserts). It uses 1 table. It loads 400M rows without secondary indexes, creates secondary indexes, loads another 400M rows per table then does 3 read+write tests for one hour each that do queries as fast as possible with 100, 500 and then 1000 writes/second/client concurrent with the queries. The database is cached by the OS but not by Postgres. Clients and the DBMS share one server. The per-database configs are in the per-database subdirectories here.
The tested DBMS are:
- pg1119_o3_native_lto.cx7_gcp_c2s60_4g - Postgres 11.19, the cx7_gcp_c2s60_4g config and the build used: -O3 -march=native -mtune=native and -flto
- pg1214_o3_native_lto.cx7_gcp_c2s60_4g - Postgres 12.14, the cx7_gcp_c2s60_4g config and the build used: -O3 -march=native -mtune=native and -flto
- pg1310_o3_native_lto.cx7_gcp_c2s60_4g - Postgres 13.10, the cx7_gcp_c2s60_4g config and the build used: -O3 -march=native -mtune=native and -flto
- pg147_o3_native_lto.cx7_gcp_c2s60_4g - Postgres 14.7, the cx7_gcp_c2s60_4g config and the build used: -O3 -march=native -mtune=native and -flto
- pg151_o3_native_lto.cx7_gcp_c2s60_4g - Postgres 15.1, the cx7_gcp_c2s60_4g config and the build used: -O3 -march=native -mtune=native and -flto
- pg152_o3_native_lto.cx7_gcp_c2s60_4g - Postgres 15.2, the cx7_gcp_c2s60_4g config and the build used: -O3 -march=native -mtune=native and -flto
Contents
- Summary
- l.i0: load without secondary indexes
- l.x: create secondary indexes
- l.i1: continue load after secondary indexes created
- q100.1: range queries with 100 insert/s per client
- q500.1: range queries with 500 insert/s per client
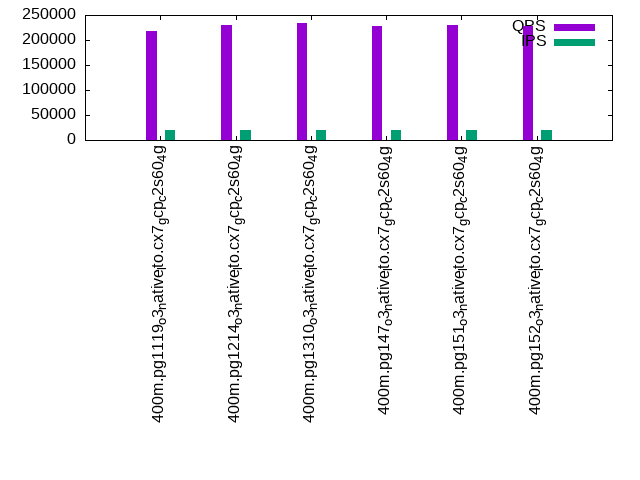
- q1000.1: range queries with 1000 insert/s per client
Summary
The numbers are inserts/s for l.i0 and l.i1, indexed docs (or rows) /s for l.x and queries/s for q*.2. The values are the average rate over the entire test for inserts (IPS) and queries (QPS). The range of values for IPS and QPS is split into 3 parts: bottom 25%, middle 50%, top 25%. Values in the bottom 25% have a red background, values in the top 25% have a green background and values in the middle have no color. A gray background is used for values that can be ignored because the DBMS did not sustain the target insert rate. Red backgrounds are not used when the minimum value is within 80% of the max value.
| dbms | l.i0 | l.x | l.i1 | q100.1 | q500.1 | q1000.1 |
|---|---|---|---|---|---|---|
| 400m.pg1119_o3_native_lto.cx7_gcp_c2s60_4g | 1142857 | 330116 | 201005 | 194505 | 206764 | 218869 |
| 400m.pg1214_o3_native_lto.cx7_gcp_c2s60_4g | 1136364 | 328220 | 203355 | 202223 | 213272 | 230173 |
| 400m.pg1310_o3_native_lto.cx7_gcp_c2s60_4g | 1126760 | 329843 | 199700 | 205454 | 218224 | 234039 |
| 400m.pg147_o3_native_lto.cx7_gcp_c2s60_4g | 1126760 | 325020 | 199005 | 204559 | 214898 | 227051 |
| 400m.pg151_o3_native_lto.cx7_gcp_c2s60_4g | 1162791 | 316535 | 202224 | 206718 | 216467 | 230002 |
| 400m.pg152_o3_native_lto.cx7_gcp_c2s60_4g | 1123596 | 319059 | 200803 | 202057 | 213310 | 227760 |
This table has relative throughput, throughput for the DBMS relative to the DBMS in the first line, using the absolute throughput from the previous table.
| dbms | l.i0 | l.x | l.i1 | q100.1 | q500.1 | q1000.1 |
|---|---|---|---|---|---|---|
| 400m.pg1119_o3_native_lto.cx7_gcp_c2s60_4g | 1.00 | 1.00 | 1.00 | 1.00 | 1.00 | 1.00 |
| 400m.pg1214_o3_native_lto.cx7_gcp_c2s60_4g | 0.99 | 0.99 | 1.01 | 1.04 | 1.03 | 1.05 |
| 400m.pg1310_o3_native_lto.cx7_gcp_c2s60_4g | 0.99 | 1.00 | 0.99 | 1.06 | 1.06 | 1.07 |
| 400m.pg147_o3_native_lto.cx7_gcp_c2s60_4g | 0.99 | 0.98 | 0.99 | 1.05 | 1.04 | 1.04 |
| 400m.pg151_o3_native_lto.cx7_gcp_c2s60_4g | 1.02 | 0.96 | 1.01 | 1.06 | 1.05 | 1.05 |
| 400m.pg152_o3_native_lto.cx7_gcp_c2s60_4g | 0.98 | 0.97 | 1.00 | 1.04 | 1.03 | 1.04 |
This lists the average rate of inserts/s for the tests that do inserts concurrent with queries. For such tests the query rate is listed in the table above. The read+write tests are setup so that the insert rate should match the target rate every second. Cells that are not at least 95% of the target have a red background to indicate a failure to satisfy the target.
| dbms | q100.1 | q500.1 | q1000.1 |
|---|---|---|---|
| pg1119_o3_native_lto.cx7_gcp_c2s60_4g | 1977 | 9885 | 19769 |
| pg1214_o3_native_lto.cx7_gcp_c2s60_4g | 1976 | 9885 | 19769 |
| pg1310_o3_native_lto.cx7_gcp_c2s60_4g | 1976 | 9885 | 19769 |
| pg147_o3_native_lto.cx7_gcp_c2s60_4g | 1977 | 9885 | 19769 |
| pg151_o3_native_lto.cx7_gcp_c2s60_4g | 1976 | 9885 | 19769 |
| pg152_o3_native_lto.cx7_gcp_c2s60_4g | 1976 | 9885 | 19769 |
| target | 2000 | 10000 | 20000 |
l.i0
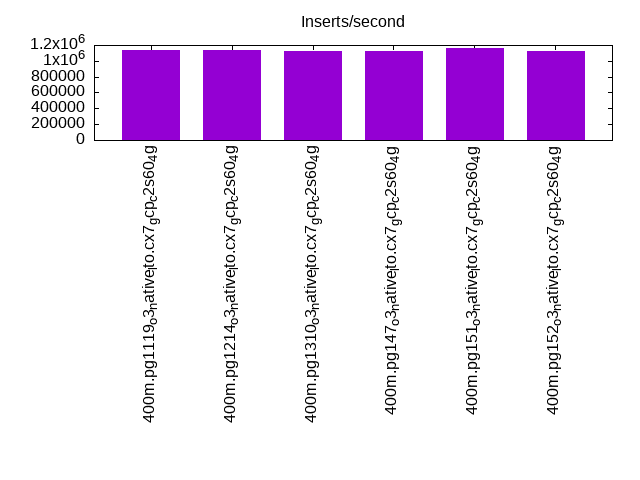
l.i0: load without secondary indexes. Graphs for performance per 1-second interval are here.
Average throughput:
Insert response time histogram: each cell has the percentage of responses that take <= the time in the header and max is the max response time in seconds. For the max column values in the top 25% of the range have a red background and in the bottom 25% of the range have a green background. The red background is not used when the min value is within 80% of the max value.
| dbms | 256us | 1ms | 4ms | 16ms | 64ms | 256ms | 1s | 4s | 16s | gt | max |
|---|---|---|---|---|---|---|---|---|---|---|---|
| pg1119_o3_native_lto.cx7_gcp_c2s60_4g | 26.463 | 70.867 | 2.614 | 0.022 | 0.027 | 0.007 | 0.928 | ||||
| pg1214_o3_native_lto.cx7_gcp_c2s60_4g | 25.153 | 72.067 | 2.724 | 0.020 | 0.028 | 0.008 | 0.703 | ||||
| pg1310_o3_native_lto.cx7_gcp_c2s60_4g | 27.756 | 69.241 | 2.943 | 0.021 | 0.029 | 0.010 | 0.628 | ||||
| pg147_o3_native_lto.cx7_gcp_c2s60_4g | 25.136 | 72.164 | 2.635 | 0.024 | 0.034 | 0.006 | 0.926 | ||||
| pg151_o3_native_lto.cx7_gcp_c2s60_4g | 31.368 | 66.117 | 2.463 | 0.019 | 0.025 | 0.008 | 0.366 | ||||
| pg152_o3_native_lto.cx7_gcp_c2s60_4g | 26.926 | 70.268 | 2.749 | 0.019 | 0.030 | 0.009 | 0.641 |
Performance metrics for the DBMS listed above. Some are normalized by throughput, others are not. Legend for results is here.
ips	qps	rps	rmbps	wps	wmbps	rpq	rkbpq	wpi	wkbpi	csps	cpups	cspq	cpupq	dbgb1	dbgb2	rss	maxop	p50	p99	tag
1142857	0	0	0.0	2367.1	463.3	0.000	0.000	0.002	0.415	352090	58.9	0.308	15	44.2	114.2	NA	0.928	62658	26582	400m.pg1119_o3_native_lto.cx7_gcp_c2s60_4g
1136364	0	0	0.0	2542.1	458.0	0.000	0.000	0.002	0.413	316397	58.8	0.278	16	43.0	112.3	0.0	0.703	62232	21876	400m.pg1214_o3_native_lto.cx7_gcp_c2s60_4g
1126760	0	0	0.0	2212.8	465.5	0.000	0.000	0.002	0.423	334683	57.6	0.297	15	43.0	112.5	NA	0.628	61932	19878	400m.pg1310_o3_native_lto.cx7_gcp_c2s60_4g
1126760	0	0	0.0	2267.2	465.1	0.000	0.000	0.002	0.423	324191	57.9	0.288	15	43.0	112.3	NA	0.926	62132	22476	400m.pg147_o3_native_lto.cx7_gcp_c2s60_4g
1162791	0	0	0.0	2311.7	463.6	0.000	0.000	0.002	0.408	324905	58.7	0.279	15	43.0	112.4	0.0	0.366	63827	13885	400m.pg151_o3_native_lto.cx7_gcp_c2s60_4g
1123596	0	0	0.0	2281.2	466.4	0.000	0.000	0.002	0.425	326517	57.7	0.291	15	43.0	112.4	NA	0.641	61858	17680	400m.pg152_o3_native_lto.cx7_gcp_c2s60_4g
l.x
l.x: create secondary indexes.
Average throughput:

Performance metrics for the DBMS listed above. Some are normalized by throughput, others are not. Legend for results is here.
ips	qps	rps	rmbps	wps	wmbps	rpq	rkbpq	wpi	wkbpi	csps	cpups	cspq	cpupq	dbgb1	dbgb2	rss	maxop	p50	p99	tag
330116	0	0	0.0	584.1	129.7	0.000	0.000	0.002	0.402	1606	3.3	0.005	3	79.5	156.0	0.0	0.002	NA	NA	400m.pg1119_o3_native_lto.cx7_gcp_c2s60_4g
328220	0	0	0.0	626.0	131.5	0.000	0.000	0.002	0.410	1630	3.2	0.005	3	78.3	154.4	0.0	0.002	NA	NA	400m.pg1214_o3_native_lto.cx7_gcp_c2s60_4g
329843	0	0	0.0	508.6	125.9	0.000	0.000	0.002	0.391	1792	3.2	0.005	3	78.3	152.0	0.0	0.002	NA	NA	400m.pg1310_o3_native_lto.cx7_gcp_c2s60_4g
325020	0	0	0.0	532.5	135.2	0.000	0.000	0.002	0.426	1914	3.2	0.006	3	78.3	163.9	0.0	0.002	NA	NA	400m.pg147_o3_native_lto.cx7_gcp_c2s60_4g
316535	0	0	0.0	561.7	128.6	0.000	0.000	0.002	0.416	2088	3.2	0.007	3	78.3	164.9	0.0	0.002	NA	NA	400m.pg151_o3_native_lto.cx7_gcp_c2s60_4g
319059	0	0	0.0	570.1	135.2	0.000	0.000	0.002	0.434	2715	3.2	0.009	3	78.3	164.0	0.0	0.002	NA	NA	400m.pg152_o3_native_lto.cx7_gcp_c2s60_4g
l.i1
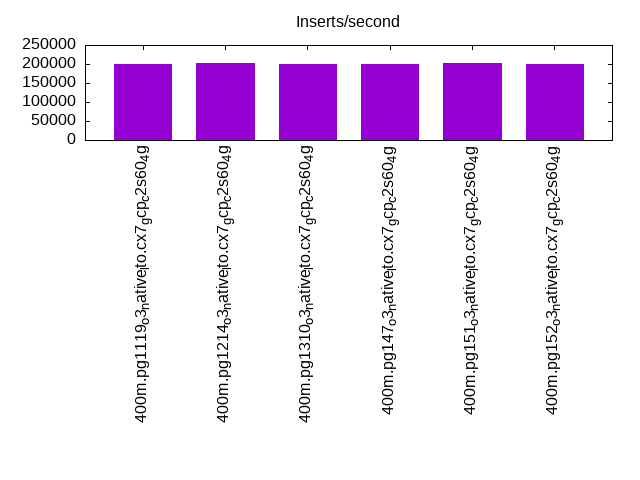
l.i1: continue load after secondary indexes created. Graphs for performance per 1-second interval are here.
Average throughput:
Insert response time histogram: each cell has the percentage of responses that take <= the time in the header and max is the max response time in seconds. For the max column values in the top 25% of the range have a red background and in the bottom 25% of the range have a green background. The red background is not used when the min value is within 80% of the max value.
| dbms | 256us | 1ms | 4ms | 16ms | 64ms | 256ms | 1s | 4s | 16s | gt | max |
|---|---|---|---|---|---|---|---|---|---|---|---|
| pg1119_o3_native_lto.cx7_gcp_c2s60_4g | 86.064 | 10.693 | 2.521 | 0.706 | 0.016 | 0.539 | |||||
| pg1214_o3_native_lto.cx7_gcp_c2s60_4g | 86.100 | 10.716 | 2.509 | 0.653 | 0.022 | 0.598 | |||||
| pg1310_o3_native_lto.cx7_gcp_c2s60_4g | 85.987 | 10.674 | 2.617 | 0.699 | 0.023 | 0.701 | |||||
| pg147_o3_native_lto.cx7_gcp_c2s60_4g | 86.827 | 9.916 | 2.494 | 0.737 | 0.027 | 0.578 | |||||
| pg151_o3_native_lto.cx7_gcp_c2s60_4g | 87.176 | 9.691 | 2.396 | 0.711 | 0.026 | 0.648 | |||||
| pg152_o3_native_lto.cx7_gcp_c2s60_4g | 86.729 | 10.122 | 2.400 | 0.720 | 0.029 | 0.753 |
Performance metrics for the DBMS listed above. Some are normalized by throughput, others are not. Legend for results is here.
ips	qps	rps	rmbps	wps	wmbps	rpq	rkbpq	wpi	wkbpi	csps	cpups	cspq	cpupq	dbgb1	dbgb2	rss	maxop	p50	p99	tag
201005	0	3	0.0	40629.9	1276.5	0.000	0.000	0.202	6.503	189505	43.7	0.943	65	176.4	271.5	0.0	0.539	10691	1099	400m.pg1119_o3_native_lto.cx7_gcp_c2s60_4g
203355	0	1	0.0	40237.6	1271.2	0.000	0.000	0.198	6.401	191732	43.7	0.943	64	170.2	264.8	0.0	0.598	10988	1199	400m.pg1214_o3_native_lto.cx7_gcp_c2s60_4g
199700	0	0	0.0	41267.0	1278.4	0.000	0.000	0.207	6.555	199420	42.8	0.999	64	170.2	266.1	NA	0.701	10788	1099	400m.pg1310_o3_native_lto.cx7_gcp_c2s60_4g
199005	0	0	0.0	41456.6	1280.2	0.000	0.000	0.208	6.588	186577	42.7	0.938	64	170.2	286.8	NA	0.578	10688	1199	400m.pg147_o3_native_lto.cx7_gcp_c2s60_4g
202224	0	0	0.0	40306.4	1272.0	0.000	0.000	0.199	6.441	191698	43.0	0.948	64	170.2	287.1	NA	0.648	10838	1199	400m.pg151_o3_native_lto.cx7_gcp_c2s60_4g
200803	0	0	0.0	41023.9	1275.9	0.000	0.000	0.204	6.506	190978	43.0	0.951	64	170.2	286.2	NA	0.753	10693	999	400m.pg152_o3_native_lto.cx7_gcp_c2s60_4g
q100.1
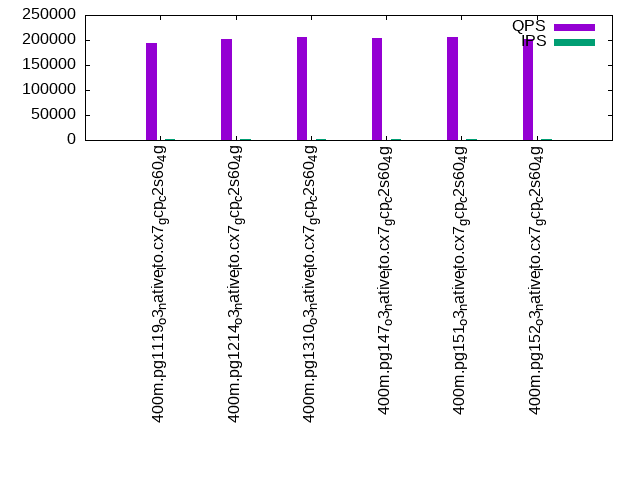
q100.1: range queries with 100 insert/s per client. Graphs for performance per 1-second interval are here.
Average throughput:
Query response time histogram: each cell has the percentage of responses that take <= the time in the header and max is the max response time in seconds. For max values in the top 25% of the range have a red background and in the bottom 25% of the range have a green background. The red background is not used when the min value is within 80% of the max value.
| dbms | 256us | 1ms | 4ms | 16ms | 64ms | 256ms | 1s | 4s | 16s | gt | max |
|---|---|---|---|---|---|---|---|---|---|---|---|
| pg1119_o3_native_lto.cx7_gcp_c2s60_4g | 99.973 | 0.020 | 0.006 | 0.001 | nonzero | 0.020 | |||||
| pg1214_o3_native_lto.cx7_gcp_c2s60_4g | 99.976 | 0.017 | 0.006 | 0.001 | 0.015 | ||||||
| pg1310_o3_native_lto.cx7_gcp_c2s60_4g | 99.978 | 0.015 | 0.006 | 0.001 | nonzero | 0.024 | |||||
| pg147_o3_native_lto.cx7_gcp_c2s60_4g | 99.977 | 0.016 | 0.006 | 0.001 | nonzero | 0.024 | |||||
| pg151_o3_native_lto.cx7_gcp_c2s60_4g | 99.978 | 0.015 | 0.006 | 0.001 | nonzero | 0.024 | |||||
| pg152_o3_native_lto.cx7_gcp_c2s60_4g | 99.976 | 0.017 | 0.006 | 0.001 | nonzero | 0.024 |
Insert response time histogram: each cell has the percentage of responses that take <= the time in the header and max is the max response time in seconds. For max values in the top 25% of the range have a red background and in the bottom 25% of the range have a green background. The red background is not used when the min value is within 80% of the max value.
| dbms | 256us | 1ms | 4ms | 16ms | 64ms | 256ms | 1s | 4s | 16s | gt | max |
|---|---|---|---|---|---|---|---|---|---|---|---|
| pg1119_o3_native_lto.cx7_gcp_c2s60_4g | 97.579 | 2.285 | 0.136 | 0.034 | |||||||
| pg1214_o3_native_lto.cx7_gcp_c2s60_4g | 97.144 | 2.581 | 0.275 | 0.039 | |||||||
| pg1310_o3_native_lto.cx7_gcp_c2s60_4g | 97.276 | 2.454 | 0.243 | 0.022 | 0.004 | 0.262 | |||||
| pg147_o3_native_lto.cx7_gcp_c2s60_4g | 97.024 | 2.647 | 0.310 | 0.018 | 0.001 | 0.301 | |||||
| pg151_o3_native_lto.cx7_gcp_c2s60_4g | 98.401 | 1.499 | 0.088 | 0.001 | 0.011 | 0.318 | |||||
| pg152_o3_native_lto.cx7_gcp_c2s60_4g | 98.381 | 1.511 | 0.096 | 0.013 | 0.197 |
Performance metrics for the DBMS listed above. Some are normalized by throughput, others are not. Legend for results is here.
ips	qps	rps	rmbps	wps	wmbps	rpq	rkbpq	wpi	wkbpi	csps	cpups	cspq	cpupq	dbgb1	dbgb2	rss	maxop	p50	p99	tag
1977	194505	0	0.0	4026.4	50.4	0.000	0.000	2.037	26.112	695977	62.9	3.578	97	177.6	241.0	0.0	0.020	9577	9238	400m.pg1119_o3_native_lto.cx7_gcp_c2s60_4g
1976	202223	0	0.0	3960.4	50.0	0.000	0.000	2.004	25.895	721374	62.5	3.567	93	171.1	234.5	0.0	0.015	10025	9689	400m.pg1214_o3_native_lto.cx7_gcp_c2s60_4g
1976	205454	1	0.0	3981.2	52.0	0.000	0.000	2.015	26.947	732835	62.6	3.567	91	171.1	232.9	0.0	0.024	10197	9865	400m.pg1310_o3_native_lto.cx7_gcp_c2s60_4g
1977	204559	3	0.0	4024.6	52.0	0.000	0.000	2.036	26.954	728605	62.6	3.562	92	171.1	267.4	0.0	0.024	10121	9781	400m.pg147_o3_native_lto.cx7_gcp_c2s60_4g
1976	206718	2	0.0	4032.1	52.1	0.000	0.000	2.041	27.013	737779	62.5	3.569	91	171.1	267.8	0.0	0.024	10197	9866	400m.pg151_o3_native_lto.cx7_gcp_c2s60_4g
1976	202057	2	0.0	4022.1	51.5	0.000	0.000	2.036	26.717	721671	62.4	3.572	93	171.1	264.9	0.0	0.024	10069	9717	400m.pg152_o3_native_lto.cx7_gcp_c2s60_4g
q500.1
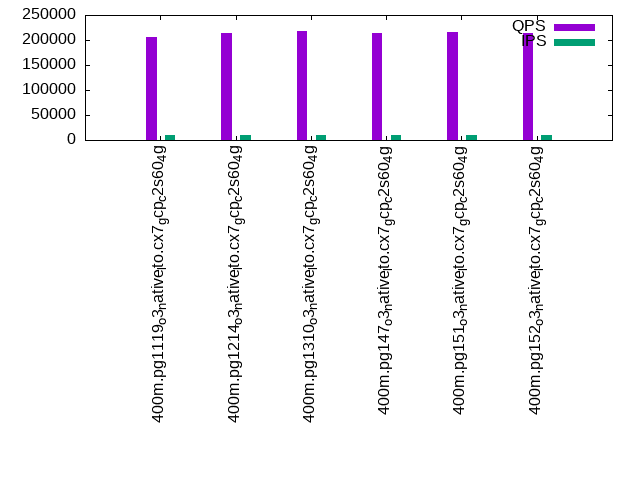
q500.1: range queries with 500 insert/s per client. Graphs for performance per 1-second interval are here.
Average throughput:
Query response time histogram: each cell has the percentage of responses that take <= the time in the header and max is the max response time in seconds. For max values in the top 25% of the range have a red background and in the bottom 25% of the range have a green background. The red background is not used when the min value is within 80% of the max value.
| dbms | 256us | 1ms | 4ms | 16ms | 64ms | 256ms | 1s | 4s | 16s | gt | max |
|---|---|---|---|---|---|---|---|---|---|---|---|
| pg1119_o3_native_lto.cx7_gcp_c2s60_4g | 99.875 | 0.091 | 0.031 | 0.002 | nonzero | 0.030 | |||||
| pg1214_o3_native_lto.cx7_gcp_c2s60_4g | 99.882 | 0.086 | 0.030 | 0.002 | nonzero | 0.025 | |||||
| pg1310_o3_native_lto.cx7_gcp_c2s60_4g | 99.889 | 0.080 | 0.029 | 0.002 | nonzero | 0.028 | |||||
| pg147_o3_native_lto.cx7_gcp_c2s60_4g | 99.887 | 0.082 | 0.030 | 0.002 | nonzero | 0.026 | |||||
| pg151_o3_native_lto.cx7_gcp_c2s60_4g | 99.889 | 0.080 | 0.029 | 0.002 | nonzero | 0.027 | |||||
| pg152_o3_native_lto.cx7_gcp_c2s60_4g | 99.883 | 0.085 | 0.030 | 0.002 | nonzero | nonzero | 0.270 |
Insert response time histogram: each cell has the percentage of responses that take <= the time in the header and max is the max response time in seconds. For max values in the top 25% of the range have a red background and in the bottom 25% of the range have a green background. The red background is not used when the min value is within 80% of the max value.
| dbms | 256us | 1ms | 4ms | 16ms | 64ms | 256ms | 1s | 4s | 16s | gt | max |
|---|---|---|---|---|---|---|---|---|---|---|---|
| pg1119_o3_native_lto.cx7_gcp_c2s60_4g | 43.791 | 42.053 | 14.114 | 0.042 | 0.103 | ||||||
| pg1214_o3_native_lto.cx7_gcp_c2s60_4g | 44.242 | 40.729 | 14.982 | 0.048 | 0.110 | ||||||
| pg1310_o3_native_lto.cx7_gcp_c2s60_4g | 45.588 | 41.146 | 13.226 | 0.041 | 0.112 | ||||||
| pg147_o3_native_lto.cx7_gcp_c2s60_4g | 45.481 | 39.909 | 14.539 | 0.071 | 0.195 | ||||||
| pg151_o3_native_lto.cx7_gcp_c2s60_4g | 44.827 | 40.126 | 14.984 | 0.063 | 0.251 | ||||||
| pg152_o3_native_lto.cx7_gcp_c2s60_4g | 45.261 | 40.270 | 14.412 | 0.057 | 0.001 | 0.377 |
Performance metrics for the DBMS listed above. Some are normalized by throughput, others are not. Legend for results is here.
ips	qps	rps	rmbps	wps	wmbps	rpq	rkbpq	wpi	wkbpi	csps	cpups	cspq	cpupq	dbgb1	dbgb2	rss	maxop	p50	p99	tag
9885	206764	0	0.0	19898.2	225.0	0.000	0.000	2.013	23.307	696975	64.7	3.371	94	183.7	234.1	0.0	0.030	10213	9398	400m.pg1119_o3_native_lto.cx7_gcp_c2s60_4g
9885	213272	0	0.0	19522.7	223.2	0.000	0.000	1.975	23.122	720320	64.3	3.377	90	176.0	227.8	0.0	0.025	10393	9573	400m.pg1214_o3_native_lto.cx7_gcp_c2s60_4g
9885	218224	0	0.0	19537.3	222.4	0.000	0.000	1.977	23.044	734992	64.3	3.368	88	176.0	227.5	0.0	0.028	10724	9813	400m.pg1310_o3_native_lto.cx7_gcp_c2s60_4g
9885	214898	0	0.0	19524.0	222.8	0.000	0.000	1.975	23.082	726181	64.4	3.379	90	176.0	247.1	0.0	0.026	10580	9749	400m.pg147_o3_native_lto.cx7_gcp_c2s60_4g
9885	216467	0	0.0	19518.5	222.8	0.000	0.000	1.975	23.078	731604	64.3	3.380	89	176.0	247.4	0.0	0.027	10532	9738	400m.pg151_o3_native_lto.cx7_gcp_c2s60_4g
9885	213310	0	0.0	19516.3	222.5	0.000	0.000	1.974	23.055	721165	64.3	3.381	90	176.0	244.5	0.0	0.270	10357	9526	400m.pg152_o3_native_lto.cx7_gcp_c2s60_4g
q1000.1
q1000.1: range queries with 1000 insert/s per client. Graphs for performance per 1-second interval are here.
Average throughput:
Query response time histogram: each cell has the percentage of responses that take <= the time in the header and max is the max response time in seconds. For max values in the top 25% of the range have a red background and in the bottom 25% of the range have a green background. The red background is not used when the min value is within 80% of the max value.
| dbms | 256us | 1ms | 4ms | 16ms | 64ms | 256ms | 1s | 4s | 16s | gt | max |
|---|---|---|---|---|---|---|---|---|---|---|---|
| pg1119_o3_native_lto.cx7_gcp_c2s60_4g | 99.764 | 0.184 | 0.049 | 0.003 | nonzero | nonzero | 0.238 | ||||
| pg1214_o3_native_lto.cx7_gcp_c2s60_4g | 99.775 | 0.175 | 0.047 | 0.003 | nonzero | nonzero | 0.086 | ||||
| pg1310_o3_native_lto.cx7_gcp_c2s60_4g | 99.782 | 0.170 | 0.045 | 0.003 | nonzero | 0.063 | |||||
| pg147_o3_native_lto.cx7_gcp_c2s60_4g | 99.795 | 0.159 | 0.043 | 0.003 | nonzero | 0.048 | |||||
| pg151_o3_native_lto.cx7_gcp_c2s60_4g | 99.783 | 0.169 | 0.045 | 0.003 | nonzero | 0.050 | |||||
| pg152_o3_native_lto.cx7_gcp_c2s60_4g | 99.774 | 0.178 | 0.046 | 0.003 | nonzero | nonzero | 0.090 |
Insert response time histogram: each cell has the percentage of responses that take <= the time in the header and max is the max response time in seconds. For max values in the top 25% of the range have a red background and in the bottom 25% of the range have a green background. The red background is not used when the min value is within 80% of the max value.
| dbms | 256us | 1ms | 4ms | 16ms | 64ms | 256ms | 1s | 4s | 16s | gt | max |
|---|---|---|---|---|---|---|---|---|---|---|---|
| pg1119_o3_native_lto.cx7_gcp_c2s60_4g | 43.240 | 45.290 | 11.068 | 0.399 | 0.003 | 0.344 | |||||
| pg1214_o3_native_lto.cx7_gcp_c2s60_4g | 41.861 | 45.717 | 11.959 | 0.463 | 0.255 | ||||||
| pg1310_o3_native_lto.cx7_gcp_c2s60_4g | 42.713 | 45.769 | 11.218 | 0.300 | 0.239 | ||||||
| pg147_o3_native_lto.cx7_gcp_c2s60_4g | 52.271 | 40.361 | 7.138 | 0.230 | 0.244 | ||||||
| pg151_o3_native_lto.cx7_gcp_c2s60_4g | 44.460 | 46.598 | 8.746 | 0.195 | 0.217 | ||||||
| pg152_o3_native_lto.cx7_gcp_c2s60_4g | 45.136 | 46.153 | 8.538 | 0.171 | 0.002 | 0.303 |
Performance metrics for the DBMS listed above. Some are normalized by throughput, others are not. Legend for results is here.
ips	qps	rps	rmbps	wps	wmbps	rpq	rkbpq	wpi	wkbpi	csps	cpups	cspq	cpupq	dbgb1	dbgb2	rss	maxop	p50	p99	tag
19769	218869	0	0.0	38608.9	408.3	0.000	0.000	1.953	21.148	692307	66.8	3.163	92	197.2	256.5	0.0	0.238	10757	9429	400m.pg1119_o3_native_lto.cx7_gcp_c2s60_4g
19769	230173	0	0.0	38107.5	408.8	0.000	0.000	1.928	21.172	726584	66.5	3.157	87	189.4	250.0	0.0	0.086	11315	9781	400m.pg1214_o3_native_lto.cx7_gcp_c2s60_4g
19769	234039	0	0.0	38234.1	407.8	0.000	0.000	1.934	21.121	735799	66.6	3.144	85	189.4	250.0	0.0	0.063	11417	9957	400m.pg1310_o3_native_lto.cx7_gcp_c2s60_4g
19769	227051	0	0.0	38159.4	392.1	0.000	0.000	1.930	20.308	721965	66.5	3.180	88	189.5	261.4	0.0	0.048	11089	9717	400m.pg147_o3_native_lto.cx7_gcp_c2s60_4g
19769	230002	0	0.0	38217.0	393.9	0.000	0.000	1.933	20.402	730673	66.4	3.177	87	189.4	261.4	0.0	0.050	11268	9861	400m.pg151_o3_native_lto.cx7_gcp_c2s60_4g
19769	227760	0	0.0	38165.5	394.5	0.000	0.000	1.931	20.432	720749	66.4	3.165	87	189.4	261.3	0.0	0.090	11301	9802	400m.pg152_o3_native_lto.cx7_gcp_c2s60_4g
l.i0
l.i0: load without secondary indexes
Performance metrics for all DBMS, not just the ones listed above. Some are normalized by throughput, others are not. Legend for results is here.
ips	qps	rps	rmbps	wps	wmbps	rpq	rkbpq	wpi	wkbpi	csps	cpups	cspq	cpupq	dbgb1	dbgb2	rss	maxop	p50	p99	tag
1142857	0	0	0.0	2367.1	463.3	0.000	0.000	0.002	0.415	352090	58.9	0.308	15	44.2	114.2	NA	0.928	62658	26582	400m.pg1119_o3_native_lto.cx7_gcp_c2s60_4g
1136364	0	0	0.0	2542.1	458.0	0.000	0.000	0.002	0.413	316397	58.8	0.278	16	43.0	112.3	0.0	0.703	62232	21876	400m.pg1214_o3_native_lto.cx7_gcp_c2s60_4g
1126760	0	0	0.0	2212.8	465.5	0.000	0.000	0.002	0.423	334683	57.6	0.297	15	43.0	112.5	NA	0.628	61932	19878	400m.pg1310_o3_native_lto.cx7_gcp_c2s60_4g
1126760	0	0	0.0	2267.2	465.1	0.000	0.000	0.002	0.423	324191	57.9	0.288	15	43.0	112.3	NA	0.926	62132	22476	400m.pg147_o3_native_lto.cx7_gcp_c2s60_4g
1162791	0	0	0.0	2311.7	463.6	0.000	0.000	0.002	0.408	324905	58.7	0.279	15	43.0	112.4	0.0	0.366	63827	13885	400m.pg151_o3_native_lto.cx7_gcp_c2s60_4g
1123596	0	0	0.0	2281.2	466.4	0.000	0.000	0.002	0.425	326517	57.7	0.291	15	43.0	112.4	NA	0.641	61858	17680	400m.pg152_o3_native_lto.cx7_gcp_c2s60_4g
l.x
l.x: create secondary indexes
Performance metrics for all DBMS, not just the ones listed above. Some are normalized by throughput, others are not. Legend for results is here.
ips	qps	rps	rmbps	wps	wmbps	rpq	rkbpq	wpi	wkbpi	csps	cpups	cspq	cpupq	dbgb1	dbgb2	rss	maxop	p50	p99	tag
330116	0	0	0.0	584.1	129.7	0.000	0.000	0.002	0.402	1606	3.3	0.005	3	79.5	156.0	0.0	0.002	NA	NA	400m.pg1119_o3_native_lto.cx7_gcp_c2s60_4g
328220	0	0	0.0	626.0	131.5	0.000	0.000	0.002	0.410	1630	3.2	0.005	3	78.3	154.4	0.0	0.002	NA	NA	400m.pg1214_o3_native_lto.cx7_gcp_c2s60_4g
329843	0	0	0.0	508.6	125.9	0.000	0.000	0.002	0.391	1792	3.2	0.005	3	78.3	152.0	0.0	0.002	NA	NA	400m.pg1310_o3_native_lto.cx7_gcp_c2s60_4g
325020	0	0	0.0	532.5	135.2	0.000	0.000	0.002	0.426	1914	3.2	0.006	3	78.3	163.9	0.0	0.002	NA	NA	400m.pg147_o3_native_lto.cx7_gcp_c2s60_4g
316535	0	0	0.0	561.7	128.6	0.000	0.000	0.002	0.416	2088	3.2	0.007	3	78.3	164.9	0.0	0.002	NA	NA	400m.pg151_o3_native_lto.cx7_gcp_c2s60_4g
319059	0	0	0.0	570.1	135.2	0.000	0.000	0.002	0.434	2715	3.2	0.009	3	78.3	164.0	0.0	0.002	NA	NA	400m.pg152_o3_native_lto.cx7_gcp_c2s60_4g
l.i1
l.i1: continue load after secondary indexes created
Performance metrics for all DBMS, not just the ones listed above. Some are normalized by throughput, others are not. Legend for results is here.
ips	qps	rps	rmbps	wps	wmbps	rpq	rkbpq	wpi	wkbpi	csps	cpups	cspq	cpupq	dbgb1	dbgb2	rss	maxop	p50	p99	tag
201005	0	3	0.0	40629.9	1276.5	0.000	0.000	0.202	6.503	189505	43.7	0.943	65	176.4	271.5	0.0	0.539	10691	1099	400m.pg1119_o3_native_lto.cx7_gcp_c2s60_4g
203355	0	1	0.0	40237.6	1271.2	0.000	0.000	0.198	6.401	191732	43.7	0.943	64	170.2	264.8	0.0	0.598	10988	1199	400m.pg1214_o3_native_lto.cx7_gcp_c2s60_4g
199700	0	0	0.0	41267.0	1278.4	0.000	0.000	0.207	6.555	199420	42.8	0.999	64	170.2	266.1	NA	0.701	10788	1099	400m.pg1310_o3_native_lto.cx7_gcp_c2s60_4g
199005	0	0	0.0	41456.6	1280.2	0.000	0.000	0.208	6.588	186577	42.7	0.938	64	170.2	286.8	NA	0.578	10688	1199	400m.pg147_o3_native_lto.cx7_gcp_c2s60_4g
202224	0	0	0.0	40306.4	1272.0	0.000	0.000	0.199	6.441	191698	43.0	0.948	64	170.2	287.1	NA	0.648	10838	1199	400m.pg151_o3_native_lto.cx7_gcp_c2s60_4g
200803	0	0	0.0	41023.9	1275.9	0.000	0.000	0.204	6.506	190978	43.0	0.951	64	170.2	286.2	NA	0.753	10693	999	400m.pg152_o3_native_lto.cx7_gcp_c2s60_4g
q100.1
q100.1: range queries with 100 insert/s per client
Performance metrics for all DBMS, not just the ones listed above. Some are normalized by throughput, others are not. Legend for results is here.
ips	qps	rps	rmbps	wps	wmbps	rpq	rkbpq	wpi	wkbpi	csps	cpups	cspq	cpupq	dbgb1	dbgb2	rss	maxop	p50	p99	tag
1977	194505	0	0.0	4026.4	50.4	0.000	0.000	2.037	26.112	695977	62.9	3.578	97	177.6	241.0	0.0	0.020	9577	9238	400m.pg1119_o3_native_lto.cx7_gcp_c2s60_4g
1976	202223	0	0.0	3960.4	50.0	0.000	0.000	2.004	25.895	721374	62.5	3.567	93	171.1	234.5	0.0	0.015	10025	9689	400m.pg1214_o3_native_lto.cx7_gcp_c2s60_4g
1976	205454	1	0.0	3981.2	52.0	0.000	0.000	2.015	26.947	732835	62.6	3.567	91	171.1	232.9	0.0	0.024	10197	9865	400m.pg1310_o3_native_lto.cx7_gcp_c2s60_4g
1977	204559	3	0.0	4024.6	52.0	0.000	0.000	2.036	26.954	728605	62.6	3.562	92	171.1	267.4	0.0	0.024	10121	9781	400m.pg147_o3_native_lto.cx7_gcp_c2s60_4g
1976	206718	2	0.0	4032.1	52.1	0.000	0.000	2.041	27.013	737779	62.5	3.569	91	171.1	267.8	0.0	0.024	10197	9866	400m.pg151_o3_native_lto.cx7_gcp_c2s60_4g
1976	202057	2	0.0	4022.1	51.5	0.000	0.000	2.036	26.717	721671	62.4	3.572	93	171.1	264.9	0.0	0.024	10069	9717	400m.pg152_o3_native_lto.cx7_gcp_c2s60_4g
q500.1
q500.1: range queries with 500 insert/s per client
Performance metrics for all DBMS, not just the ones listed above. Some are normalized by throughput, others are not. Legend for results is here.
ips	qps	rps	rmbps	wps	wmbps	rpq	rkbpq	wpi	wkbpi	csps	cpups	cspq	cpupq	dbgb1	dbgb2	rss	maxop	p50	p99	tag
9885	206764	0	0.0	19898.2	225.0	0.000	0.000	2.013	23.307	696975	64.7	3.371	94	183.7	234.1	0.0	0.030	10213	9398	400m.pg1119_o3_native_lto.cx7_gcp_c2s60_4g
9885	213272	0	0.0	19522.7	223.2	0.000	0.000	1.975	23.122	720320	64.3	3.377	90	176.0	227.8	0.0	0.025	10393	9573	400m.pg1214_o3_native_lto.cx7_gcp_c2s60_4g
9885	218224	0	0.0	19537.3	222.4	0.000	0.000	1.977	23.044	734992	64.3	3.368	88	176.0	227.5	0.0	0.028	10724	9813	400m.pg1310_o3_native_lto.cx7_gcp_c2s60_4g
9885	214898	0	0.0	19524.0	222.8	0.000	0.000	1.975	23.082	726181	64.4	3.379	90	176.0	247.1	0.0	0.026	10580	9749	400m.pg147_o3_native_lto.cx7_gcp_c2s60_4g
9885	216467	0	0.0	19518.5	222.8	0.000	0.000	1.975	23.078	731604	64.3	3.380	89	176.0	247.4	0.0	0.027	10532	9738	400m.pg151_o3_native_lto.cx7_gcp_c2s60_4g
9885	213310	0	0.0	19516.3	222.5	0.000	0.000	1.974	23.055	721165	64.3	3.381	90	176.0	244.5	0.0	0.270	10357	9526	400m.pg152_o3_native_lto.cx7_gcp_c2s60_4g
q1000.1
q1000.1: range queries with 1000 insert/s per client
Performance metrics for all DBMS, not just the ones listed above. Some are normalized by throughput, others are not. Legend for results is here.
ips	qps	rps	rmbps	wps	wmbps	rpq	rkbpq	wpi	wkbpi	csps	cpups	cspq	cpupq	dbgb1	dbgb2	rss	maxop	p50	p99	tag
19769	218869	0	0.0	38608.9	408.3	0.000	0.000	1.953	21.148	692307	66.8	3.163	92	197.2	256.5	0.0	0.238	10757	9429	400m.pg1119_o3_native_lto.cx7_gcp_c2s60_4g
19769	230173	0	0.0	38107.5	408.8	0.000	0.000	1.928	21.172	726584	66.5	3.157	87	189.4	250.0	0.0	0.086	11315	9781	400m.pg1214_o3_native_lto.cx7_gcp_c2s60_4g
19769	234039	0	0.0	38234.1	407.8	0.000	0.000	1.934	21.121	735799	66.6	3.144	85	189.4	250.0	0.0	0.063	11417	9957	400m.pg1310_o3_native_lto.cx7_gcp_c2s60_4g
19769	227051	0	0.0	38159.4	392.1	0.000	0.000	1.930	20.308	721965	66.5	3.180	88	189.5	261.4	0.0	0.048	11089	9717	400m.pg147_o3_native_lto.cx7_gcp_c2s60_4g
19769	230002	0	0.0	38217.0	393.9	0.000	0.000	1.933	20.402	730673	66.4	3.177	87	189.4	261.4	0.0	0.050	11268	9861	400m.pg151_o3_native_lto.cx7_gcp_c2s60_4g
19769	227760	0	0.0	38165.5	394.5	0.000	0.000	1.931	20.432	720749	66.4	3.165	87	189.4	261.3	0.0	0.090	11301	9802	400m.pg152_o3_native_lto.cx7_gcp_c2s60_4g
l.i0
- l.i0: load without secondary indexes
- Legend for results is here.
- Each entry lists the percentage of responses that fit in that bucket (slower than max time for previous bucket, faster than min time for next bucket).
Insert response time histogram
256us	1ms	4ms	16ms	64ms	256ms	1s	4s	16s	gt	max	tag
0.000	26.463	70.867	2.614	0.022	0.027	0.007	0.000	0.000	0.000	0.928	pg1119_o3_native_lto.cx7_gcp_c2s60_4g
0.000	25.153	72.067	2.724	0.020	0.028	0.008	0.000	0.000	0.000	0.703	pg1214_o3_native_lto.cx7_gcp_c2s60_4g
0.000	27.756	69.241	2.943	0.021	0.029	0.010	0.000	0.000	0.000	0.628	pg1310_o3_native_lto.cx7_gcp_c2s60_4g
0.000	25.136	72.164	2.635	0.024	0.034	0.006	0.000	0.000	0.000	0.926	pg147_o3_native_lto.cx7_gcp_c2s60_4g
0.000	31.368	66.117	2.463	0.019	0.025	0.008	0.000	0.000	0.000	0.366	pg151_o3_native_lto.cx7_gcp_c2s60_4g
0.000	26.926	70.268	2.749	0.019	0.030	0.009	0.000	0.000	0.000	0.641	pg152_o3_native_lto.cx7_gcp_c2s60_4g
l.x
- l.x: create secondary indexes
- Legend for results is here.
- Each entry lists the percentage of responses that fit in that bucket (slower than max time for previous bucket, faster than min time for next bucket).
TODO - determine whether there is data for create index response time
l.i1
- l.i1: continue load after secondary indexes created
- Legend for results is here.
- Each entry lists the percentage of responses that fit in that bucket (slower than max time for previous bucket, faster than min time for next bucket).
Insert response time histogram
256us	1ms	4ms	16ms	64ms	256ms	1s	4s	16s	gt	max	tag
0.000	0.000	86.064	10.693	2.521	0.706	0.016	0.000	0.000	0.000	0.539	pg1119_o3_native_lto.cx7_gcp_c2s60_4g
0.000	0.000	86.100	10.716	2.509	0.653	0.022	0.000	0.000	0.000	0.598	pg1214_o3_native_lto.cx7_gcp_c2s60_4g
0.000	0.000	85.987	10.674	2.617	0.699	0.023	0.000	0.000	0.000	0.701	pg1310_o3_native_lto.cx7_gcp_c2s60_4g
0.000	0.000	86.827	9.916	2.494	0.737	0.027	0.000	0.000	0.000	0.578	pg147_o3_native_lto.cx7_gcp_c2s60_4g
0.000	0.000	87.176	9.691	2.396	0.711	0.026	0.000	0.000	0.000	0.648	pg151_o3_native_lto.cx7_gcp_c2s60_4g
0.000	0.000	86.729	10.122	2.400	0.720	0.029	0.000	0.000	0.000	0.753	pg152_o3_native_lto.cx7_gcp_c2s60_4g
q100.1
- q100.1: range queries with 100 insert/s per client
- Legend for results is here.
- Each entry lists the percentage of responses that fit in that bucket (slower than max time for previous bucket, faster than min time for next bucket).
Query response time histogram
256us	1ms	4ms	16ms	64ms	256ms	1s	4s	16s	gt	max	tag
99.973	0.020	0.006	0.001	nonzero	0.000	0.000	0.000	0.000	0.000	0.020	pg1119_o3_native_lto.cx7_gcp_c2s60_4g
99.976	0.017	0.006	0.001	0.000	0.000	0.000	0.000	0.000	0.000	0.015	pg1214_o3_native_lto.cx7_gcp_c2s60_4g
99.978	0.015	0.006	0.001	nonzero	0.000	0.000	0.000	0.000	0.000	0.024	pg1310_o3_native_lto.cx7_gcp_c2s60_4g
99.977	0.016	0.006	0.001	nonzero	0.000	0.000	0.000	0.000	0.000	0.024	pg147_o3_native_lto.cx7_gcp_c2s60_4g
99.978	0.015	0.006	0.001	nonzero	0.000	0.000	0.000	0.000	0.000	0.024	pg151_o3_native_lto.cx7_gcp_c2s60_4g
99.976	0.017	0.006	0.001	nonzero	0.000	0.000	0.000	0.000	0.000	0.024	pg152_o3_native_lto.cx7_gcp_c2s60_4g
Insert response time histogram
256us	1ms	4ms	16ms	64ms	256ms	1s	4s	16s	gt	max	tag
0.000	0.000	97.579	2.285	0.136	0.000	0.000	0.000	0.000	0.000	0.034	pg1119_o3_native_lto.cx7_gcp_c2s60_4g
0.000	0.000	97.144	2.581	0.275	0.000	0.000	0.000	0.000	0.000	0.039	pg1214_o3_native_lto.cx7_gcp_c2s60_4g
0.000	0.000	97.276	2.454	0.243	0.022	0.004	0.000	0.000	0.000	0.262	pg1310_o3_native_lto.cx7_gcp_c2s60_4g
0.000	0.000	97.024	2.647	0.310	0.018	0.001	0.000	0.000	0.000	0.301	pg147_o3_native_lto.cx7_gcp_c2s60_4g
0.000	0.000	98.401	1.499	0.088	0.001	0.011	0.000	0.000	0.000	0.318	pg151_o3_native_lto.cx7_gcp_c2s60_4g
0.000	0.000	98.381	1.511	0.096	0.013	0.000	0.000	0.000	0.000	0.197	pg152_o3_native_lto.cx7_gcp_c2s60_4g
q500.1
- q500.1: range queries with 500 insert/s per client
- Legend for results is here.
- Each entry lists the percentage of responses that fit in that bucket (slower than max time for previous bucket, faster than min time for next bucket).
Query response time histogram
256us	1ms	4ms	16ms	64ms	256ms	1s	4s	16s	gt	max	tag
99.875	0.091	0.031	0.002	nonzero	0.000	0.000	0.000	0.000	0.000	0.030	pg1119_o3_native_lto.cx7_gcp_c2s60_4g
99.882	0.086	0.030	0.002	nonzero	0.000	0.000	0.000	0.000	0.000	0.025	pg1214_o3_native_lto.cx7_gcp_c2s60_4g
99.889	0.080	0.029	0.002	nonzero	0.000	0.000	0.000	0.000	0.000	0.028	pg1310_o3_native_lto.cx7_gcp_c2s60_4g
99.887	0.082	0.030	0.002	nonzero	0.000	0.000	0.000	0.000	0.000	0.026	pg147_o3_native_lto.cx7_gcp_c2s60_4g
99.889	0.080	0.029	0.002	nonzero	0.000	0.000	0.000	0.000	0.000	0.027	pg151_o3_native_lto.cx7_gcp_c2s60_4g
99.883	0.085	0.030	0.002	nonzero	0.000	nonzero	0.000	0.000	0.000	0.270	pg152_o3_native_lto.cx7_gcp_c2s60_4g
Insert response time histogram
256us	1ms	4ms	16ms	64ms	256ms	1s	4s	16s	gt	max	tag
0.000	0.000	43.791	42.053	14.114	0.042	0.000	0.000	0.000	0.000	0.103	pg1119_o3_native_lto.cx7_gcp_c2s60_4g
0.000	0.000	44.242	40.729	14.982	0.048	0.000	0.000	0.000	0.000	0.110	pg1214_o3_native_lto.cx7_gcp_c2s60_4g
0.000	0.000	45.588	41.146	13.226	0.041	0.000	0.000	0.000	0.000	0.112	pg1310_o3_native_lto.cx7_gcp_c2s60_4g
0.000	0.000	45.481	39.909	14.539	0.071	0.000	0.000	0.000	0.000	0.195	pg147_o3_native_lto.cx7_gcp_c2s60_4g
0.000	0.000	44.827	40.126	14.984	0.063	0.000	0.000	0.000	0.000	0.251	pg151_o3_native_lto.cx7_gcp_c2s60_4g
0.000	0.000	45.261	40.270	14.412	0.057	0.001	0.000	0.000	0.000	0.377	pg152_o3_native_lto.cx7_gcp_c2s60_4g
q1000.1
- q1000.1: range queries with 1000 insert/s per client
- Legend for results is here.
- Each entry lists the percentage of responses that fit in that bucket (slower than max time for previous bucket, faster than min time for next bucket).
Query response time histogram
256us	1ms	4ms	16ms	64ms	256ms	1s	4s	16s	gt	max	tag
99.764	0.184	0.049	0.003	nonzero	nonzero	0.000	0.000	0.000	0.000	0.238	pg1119_o3_native_lto.cx7_gcp_c2s60_4g
99.775	0.175	0.047	0.003	nonzero	nonzero	0.000	0.000	0.000	0.000	0.086	pg1214_o3_native_lto.cx7_gcp_c2s60_4g
99.782	0.170	0.045	0.003	nonzero	0.000	0.000	0.000	0.000	0.000	0.063	pg1310_o3_native_lto.cx7_gcp_c2s60_4g
99.795	0.159	0.043	0.003	nonzero	0.000	0.000	0.000	0.000	0.000	0.048	pg147_o3_native_lto.cx7_gcp_c2s60_4g
99.783	0.169	0.045	0.003	nonzero	0.000	0.000	0.000	0.000	0.000	0.050	pg151_o3_native_lto.cx7_gcp_c2s60_4g
99.774	0.178	0.046	0.003	nonzero	nonzero	0.000	0.000	0.000	0.000	0.090	pg152_o3_native_lto.cx7_gcp_c2s60_4g
Insert response time histogram
256us	1ms	4ms	16ms	64ms	256ms	1s	4s	16s	gt	max	tag
0.000	0.000	43.240	45.290	11.068	0.399	0.003	0.000	0.000	0.000	0.344	pg1119_o3_native_lto.cx7_gcp_c2s60_4g
0.000	0.000	41.861	45.717	11.959	0.463	0.000	0.000	0.000	0.000	0.255	pg1214_o3_native_lto.cx7_gcp_c2s60_4g
0.000	0.000	42.713	45.769	11.218	0.300	0.000	0.000	0.000	0.000	0.239	pg1310_o3_native_lto.cx7_gcp_c2s60_4g
0.000	0.000	52.271	40.361	7.138	0.230	0.000	0.000	0.000	0.000	0.244	pg147_o3_native_lto.cx7_gcp_c2s60_4g
0.000	0.000	44.460	46.598	8.746	0.195	0.000	0.000	0.000	0.000	0.217	pg151_o3_native_lto.cx7_gcp_c2s60_4g
0.000	0.000	45.136	46.153	8.538	0.171	0.002	0.000	0.000	0.000	0.303	pg152_o3_native_lto.cx7_gcp_c2s60_4g