Introduction
This is a report for the insert benchmark with 400M docs and 20 client(s). It is generated by scripts (bash, awk, sed) and Tufte might not be impressed. An overview of the insert benchmark is here and a short update is here. Below, by DBMS, I mean DBMS+version.config. An example is my8020.c10b40 where my means MySQL, 8020 is version 8.0.20 and c10b40 is the name for the configuration file.
The test server is c2-standard-60 from GCP with 30 cores, hyperthreads disabled, 240G RAM and 3T of NVMe (XFS with RAID0 over 8 devices). The benchmark was run with 20 clients and there were 1 or 2 connections per client (1 for queries, 1 for inserts). It uses 20 tables with a client per table. It loads 20M rows per table without secondary indexes, creates secondary indexes, loads another 20M rows per table then does 3 read+write tests for one hour each that do queries as fast as possible with 100, 500 and then 1000 writes/second/client concurrent with the queries. The database is cached by the storage engine and the only IO is for writes. Clients and the DBMS share one server. The per-database configs are in the per-database subdirectories here.
The tested DBMS are:
- pg1119_o3_native_lto.cx7a_gcp_c2s60 - Postgres 11.19, the cx7a_gcp_c2s60 config and the build used: -O3 -march=native -mtune=native and -flto
- pg1214_o3_native_lto.cx7a_gcp_c2s60 - Postgres 12.14, the cx7a_gcp_c2s60 config and the build used: -O3 -march=native -mtune=native and -flto
- pg1310_o3_native_lto.cx7a_gcp_c2s60 - Postgres 13.10, the cx7a_gcp_c2s60 config and the build used: -O3 -march=native -mtune=native and -flto
- pg147_o3_native_lto.cx7a_gcp_c2s60 - Postgres 14.7, the cx7a_gcp_c2s60 config and the build used: -O3 -march=native -mtune=native and -flto
- pg151_o3_native_lto.cx7a_gcp_c2s60 - Postgres 15.1, the cx7a_gcp_c2s60 config and the build used: -O3 -march=native -mtune=native and -flto
- pg152_o3_native_lto.cx7a_gcp_c2s60 - Postgres 15.2, the cx7a_gcp_c2s60 config and the build used: -O3 -march=native -mtune=native and -flto
Contents
- Summary
- l.i0: load without secondary indexes
- l.x: create secondary indexes
- l.i1: continue load after secondary indexes created
- q100.1: range queries with 100 insert/s per client
- q500.1: range queries with 500 insert/s per client
- q1000.1: range queries with 1000 insert/s per client
Summary
The numbers are inserts/s for l.i0 and l.i1, indexed docs (or rows) /s for l.x and queries/s for q*.2. The values are the average rate over the entire test for inserts (IPS) and queries (QPS). The range of values for IPS and QPS is split into 3 parts: bottom 25%, middle 50%, top 25%. Values in the bottom 25% have a red background, values in the top 25% have a green background and values in the middle have no color. A gray background is used for values that can be ignored because the DBMS did not sustain the target insert rate. Red backgrounds are not used when the minimum value is within 80% of the max value.
| dbms | l.i0 | l.x | l.i1 | q100.1 | q500.1 | q1000.1 |
|---|---|---|---|---|---|---|
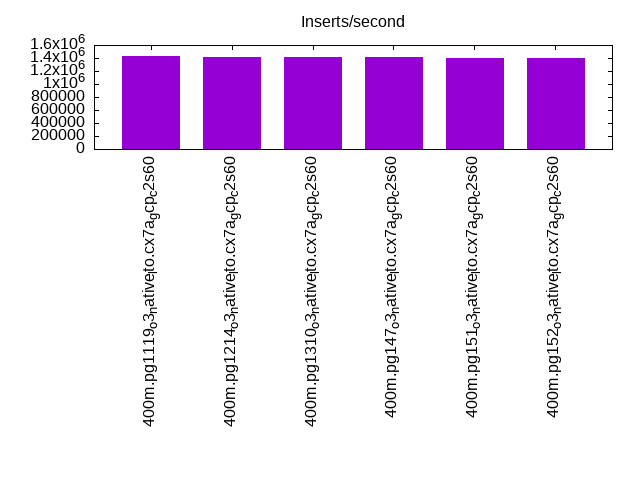
| 400m.pg1119_o3_native_lto.cx7a_gcp_c2s60 | 1433692 | 2598052 | 415800 | 188675 | 192502 | 195348 |
| 400m.pg1214_o3_native_lto.cx7a_gcp_c2s60 | 1418440 | 2598052 | 414508 | 197253 | 200389 | 203676 |
| 400m.pg1310_o3_native_lto.cx7a_gcp_c2s60 | 1418440 | 2615033 | 407747 | 198065 | 200386 | 204291 |
| 400m.pg147_o3_native_lto.cx7a_gcp_c2s60 | 1413428 | 2759310 | 421496 | 196086 | 197693 | 201489 |
| 400m.pg151_o3_native_lto.cx7a_gcp_c2s60 | 1393728 | 2778472 | 416233 | 197942 | 200354 | 203691 |
| 400m.pg152_o3_native_lto.cx7a_gcp_c2s60 | 1398601 | 2759310 | 418410 | 197101 | 199559 | 203675 |
This table has relative throughput, throughput for the DBMS relative to the DBMS in the first line, using the absolute throughput from the previous table.
| dbms | l.i0 | l.x | l.i1 | q100.1 | q500.1 | q1000.1 |
|---|---|---|---|---|---|---|
| 400m.pg1119_o3_native_lto.cx7a_gcp_c2s60 | 1.00 | 1.00 | 1.00 | 1.00 | 1.00 | 1.00 |
| 400m.pg1214_o3_native_lto.cx7a_gcp_c2s60 | 0.99 | 1.00 | 1.00 | 1.05 | 1.04 | 1.04 |
| 400m.pg1310_o3_native_lto.cx7a_gcp_c2s60 | 0.99 | 1.01 | 0.98 | 1.05 | 1.04 | 1.05 |
| 400m.pg147_o3_native_lto.cx7a_gcp_c2s60 | 0.99 | 1.06 | 1.01 | 1.04 | 1.03 | 1.03 |
| 400m.pg151_o3_native_lto.cx7a_gcp_c2s60 | 0.97 | 1.07 | 1.00 | 1.05 | 1.04 | 1.04 |
| 400m.pg152_o3_native_lto.cx7a_gcp_c2s60 | 0.98 | 1.06 | 1.01 | 1.04 | 1.04 | 1.04 |
This lists the average rate of inserts/s for the tests that do inserts concurrent with queries. For such tests the query rate is listed in the table above. The read+write tests are setup so that the insert rate should match the target rate every second. Cells that are not at least 95% of the target have a red background to indicate a failure to satisfy the target.
| dbms | q100.1 | q500.1 | q1000.1 |
|---|---|---|---|
| pg1119_o3_native_lto.cx7a_gcp_c2s60 | 1976 | 9890 | 19769 |
| pg1214_o3_native_lto.cx7a_gcp_c2s60 | 1976 | 9885 | 19769 |
| pg1310_o3_native_lto.cx7a_gcp_c2s60 | 1976 | 9885 | 19769 |
| pg147_o3_native_lto.cx7a_gcp_c2s60 | 1976 | 9885 | 19769 |
| pg151_o3_native_lto.cx7a_gcp_c2s60 | 1976 | 9885 | 19769 |
| pg152_o3_native_lto.cx7a_gcp_c2s60 | 1976 | 9885 | 19769 |
| target | 2000 | 10000 | 20000 |
l.i0
l.i0: load without secondary indexes. Graphs for performance per 1-second interval are here.
Average throughput:
Insert response time histogram: each cell has the percentage of responses that take <= the time in the header and max is the max response time in seconds. For the max column values in the top 25% of the range have a red background and in the bottom 25% of the range have a green background. The red background is not used when the min value is within 80% of the max value.
| dbms | 256us | 1ms | 4ms | 16ms | 64ms | 256ms | 1s | 4s | 16s | gt | max |
|---|---|---|---|---|---|---|---|---|---|---|---|
| pg1119_o3_native_lto.cx7a_gcp_c2s60 | 61.827 | 37.288 | 0.835 | 0.016 | 0.023 | 0.010 | nonzero | 1.234 | |||
| pg1214_o3_native_lto.cx7a_gcp_c2s60 | 59.680 | 39.487 | 0.781 | 0.020 | 0.024 | 0.007 | 0.496 | ||||
| pg1310_o3_native_lto.cx7a_gcp_c2s60 | 59.578 | 39.590 | 0.780 | 0.019 | 0.020 | 0.012 | 0.508 | ||||
| pg147_o3_native_lto.cx7a_gcp_c2s60 | 59.476 | 39.637 | 0.834 | 0.019 | 0.024 | 0.010 | 0.410 | ||||
| pg151_o3_native_lto.cx7a_gcp_c2s60 | 57.634 | 41.520 | 0.796 | 0.022 | 0.019 | 0.009 | 0.001 | 1.104 | |||
| pg152_o3_native_lto.cx7a_gcp_c2s60 | 57.385 | 41.814 | 0.744 | 0.025 | 0.024 | 0.008 | 0.669 |
Performance metrics for the DBMS listed above. Some are normalized by throughput, others are not. Legend for results is here.
ips	qps	rps	rmbps	wps	wmbps	rpq	rkbpq	wpi	wkbpi	csps	cpups	cspq	cpupq	dbgb1	dbgb2	rss	maxop	p50	p99	tag
1433692	0	0	0.0	1829.2	492.3	0.000	0.000	0.001	0.352	227055	60.9	0.158	13	38.3	103.2	NA	1.234	81311	16782	400m.pg1119_o3_native_lto.cx7a_gcp_c2s60
1418440	0	0	0.0	1840.1	483.1	0.000	0.000	0.001	0.349	232332	60.8	0.164	13	38.3	103.2	NA	0.496	79444	24272	400m.pg1214_o3_native_lto.cx7a_gcp_c2s60
1418440	0	0	0.0	1814.0	482.0	0.000	0.000	0.001	0.348	240507	60.2	0.170	13	38.3	103.4	NA	0.508	80253	18280	400m.pg1310_o3_native_lto.cx7a_gcp_c2s60
1413428	0	0	0.0	1751.3	475.8	0.000	0.000	0.001	0.345	231964	60.3	0.164	13	38.3	103.4	NA	0.410	79613	23774	400m.pg147_o3_native_lto.cx7a_gcp_c2s60
1393728	0	0	0.0	1787.3	468.2	0.000	0.000	0.001	0.344	257420	60.1	0.185	13	38.3	103.4	0.0	1.104	77915	19286	400m.pg151_o3_native_lto.cx7a_gcp_c2s60
1398601	0	0	0.0	1827.8	477.4	0.000	0.000	0.001	0.350	261473	60.0	0.187	13	38.3	103.4	0.0	0.669	78714	24174	400m.pg152_o3_native_lto.cx7a_gcp_c2s60
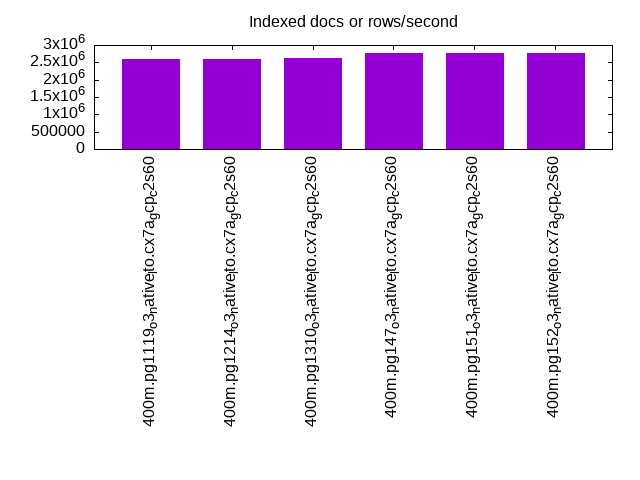
l.x
l.x: create secondary indexes.
Average throughput:
Performance metrics for the DBMS listed above. Some are normalized by throughput, others are not. Legend for results is here.
ips	qps	rps	rmbps	wps	wmbps	rpq	rkbpq	wpi	wkbpi	csps	cpups	cspq	cpupq	dbgb1	dbgb2	rss	maxop	p50	p99	tag
2598052	0	1	0.0	3278.6	812.4	0.000	0.000	0.001	0.320	104341	24.4	0.040	3	73.5	170.5	0.0	0.032	NA	NA	400m.pg1119_o3_native_lto.cx7a_gcp_c2s60
2598052	0	0	0.0	3204.7	816.9	0.000	0.000	0.001	0.322	105827	25.2	0.041	3	73.5	170.5	0.0	0.045	NA	NA	400m.pg1214_o3_native_lto.cx7a_gcp_c2s60
2615033	0	0	0.0	3304.3	831.6	0.000	0.000	0.001	0.326	103461	25.6	0.040	3	73.5	170.7	0.0	0.063	NA	NA	400m.pg1310_o3_native_lto.cx7a_gcp_c2s60
2759310	0	0	0.0	3030.7	796.8	0.000	0.000	0.001	0.296	109024	26.1	0.040	3	73.5	170.7	0.0	0.438	NA	NA	400m.pg147_o3_native_lto.cx7a_gcp_c2s60
2778472	0	0	0.0	3129.8	810.7	0.000	0.000	0.001	0.299	110496	26.0	0.040	3	73.5	171.7	0.0	0.175	NA	NA	400m.pg151_o3_native_lto.cx7a_gcp_c2s60
2759310	0	0	0.0	3103.8	814.4	0.000	0.000	0.001	0.302	111661	25.6	0.040	3	73.5	171.7	0.0	0.067	NA	NA	400m.pg152_o3_native_lto.cx7a_gcp_c2s60
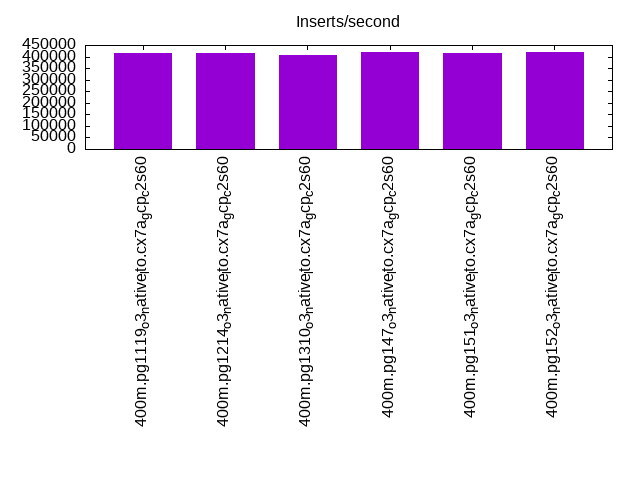
l.i1
l.i1: continue load after secondary indexes created. Graphs for performance per 1-second interval are here.
Average throughput:
Insert response time histogram: each cell has the percentage of responses that take <= the time in the header and max is the max response time in seconds. For the max column values in the top 25% of the range have a red background and in the bottom 25% of the range have a green background. The red background is not used when the min value is within 80% of the max value.
| dbms | 256us | 1ms | 4ms | 16ms | 64ms | 256ms | 1s | 4s | 16s | gt | max |
|---|---|---|---|---|---|---|---|---|---|---|---|
| pg1119_o3_native_lto.cx7a_gcp_c2s60 | 0.004 | 96.480 | 1.887 | 1.584 | 0.031 | 0.015 | nonzero | 1.127 | |||
| pg1214_o3_native_lto.cx7a_gcp_c2s60 | 0.010 | 96.339 | 2.127 | 1.484 | 0.026 | 0.014 | nonzero | 1.228 | |||
| pg1310_o3_native_lto.cx7a_gcp_c2s60 | 0.010 | 96.068 | 2.383 | 1.497 | 0.033 | 0.009 | nonzero | 1.255 | |||
| pg147_o3_native_lto.cx7a_gcp_c2s60 | nonzero | 96.357 | 2.472 | 1.122 | 0.033 | 0.015 | nonzero | 1.182 | |||
| pg151_o3_native_lto.cx7a_gcp_c2s60 | 0.003 | 96.248 | 2.610 | 1.092 | 0.036 | 0.011 | nonzero | 1.045 | |||
| pg152_o3_native_lto.cx7a_gcp_c2s60 | 0.003 | 96.318 | 2.574 | 1.058 | 0.034 | 0.013 | nonzero | 1.068 |
Performance metrics for the DBMS listed above. Some are normalized by throughput, others are not. Legend for results is here.
ips	qps	rps	rmbps	wps	wmbps	rpq	rkbpq	wpi	wkbpi	csps	cpups	cspq	cpupq	dbgb1	dbgb2	rss	maxop	p50	p99	tag
415800	0	2819	23.0	5608.4	537.9	0.007	0.057	0.013	1.325	268120	51.3	0.645	37	165.8	332.0	NA	1.127	26831	1699	400m.pg1119_o3_native_lto.cx7a_gcp_c2s60
414508	0	3027	22.1	5797.1	536.9	0.007	0.055	0.014	1.326	273614	51.7	0.660	37	163.1	328.1	NA	1.228	26770	1898	400m.pg1214_o3_native_lto.cx7a_gcp_c2s60
407747	0	3003	20.8	5263.9	553.4	0.007	0.052	0.013	1.390	286984	51.3	0.704	38	163.3	330.3	NA	1.255	25572	1898	400m.pg1310_o3_native_lto.cx7a_gcp_c2s60
421496	0	2472	17.1	4737.6	551.6	0.006	0.042	0.011	1.340	290520	52.6	0.689	37	163.3	346.9	0.0	1.182	26471	2149	400m.pg147_o3_native_lto.cx7a_gcp_c2s60
416233	0	2745	16.6	4710.3	546.7	0.007	0.041	0.011	1.345	313216	52.4	0.753	38	163.3	348.6	0.0	1.045	25871	2198	400m.pg151_o3_native_lto.cx7a_gcp_c2s60
418410	0	2437	16.4	4692.1	543.7	0.006	0.040	0.011	1.331	310293	52.4	0.742	38	163.3	347.3	NA	1.068	26071	1998	400m.pg152_o3_native_lto.cx7a_gcp_c2s60
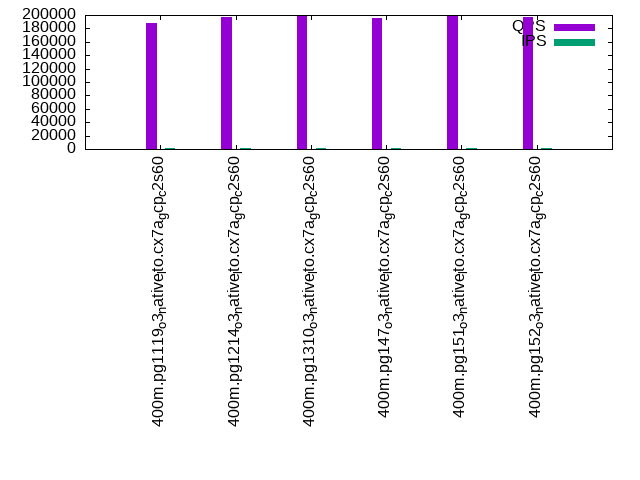
q100.1
q100.1: range queries with 100 insert/s per client. Graphs for performance per 1-second interval are here.
Average throughput:
Query response time histogram: each cell has the percentage of responses that take <= the time in the header and max is the max response time in seconds. For max values in the top 25% of the range have a red background and in the bottom 25% of the range have a green background. The red background is not used when the min value is within 80% of the max value.
| dbms | 256us | 1ms | 4ms | 16ms | 64ms | 256ms | 1s | 4s | 16s | gt | max |
|---|---|---|---|---|---|---|---|---|---|---|---|
| pg1119_o3_native_lto.cx7a_gcp_c2s60 | 99.950 | 0.042 | 0.007 | 0.001 | nonzero | 0.027 | |||||
| pg1214_o3_native_lto.cx7a_gcp_c2s60 | 99.953 | 0.040 | 0.006 | 0.001 | nonzero | 0.027 | |||||
| pg1310_o3_native_lto.cx7a_gcp_c2s60 | 99.916 | 0.077 | 0.006 | 0.001 | nonzero | nonzero | 0.129 | ||||
| pg147_o3_native_lto.cx7a_gcp_c2s60 | 99.914 | 0.079 | 0.006 | 0.001 | nonzero | 0.027 | |||||
| pg151_o3_native_lto.cx7a_gcp_c2s60 | 99.917 | 0.076 | 0.006 | 0.001 | nonzero | nonzero | 0.201 | ||||
| pg152_o3_native_lto.cx7a_gcp_c2s60 | 99.917 | 0.076 | 0.006 | 0.001 | nonzero | nonzero | 0.092 |
Insert response time histogram: each cell has the percentage of responses that take <= the time in the header and max is the max response time in seconds. For max values in the top 25% of the range have a red background and in the bottom 25% of the range have a green background. The red background is not used when the min value is within 80% of the max value.
| dbms | 256us | 1ms | 4ms | 16ms | 64ms | 256ms | 1s | 4s | 16s | gt | max |
|---|---|---|---|---|---|---|---|---|---|---|---|
| pg1119_o3_native_lto.cx7a_gcp_c2s60 | 92.011 | 6.439 | 1.550 | 0.056 | |||||||
| pg1214_o3_native_lto.cx7a_gcp_c2s60 | 96.101 | 2.853 | 1.031 | 0.014 | 0.001 | 0.778 | |||||
| pg1310_o3_native_lto.cx7a_gcp_c2s60 | 84.588 | 12.347 | 3.036 | 0.029 | 0.183 | ||||||
| pg147_o3_native_lto.cx7a_gcp_c2s60 | 94.310 | 4.558 | 1.132 | 0.058 | |||||||
| pg151_o3_native_lto.cx7a_gcp_c2s60 | 95.233 | 4.078 | 0.689 | 0.036 | |||||||
| pg152_o3_native_lto.cx7a_gcp_c2s60 | 92.847 | 5.435 | 1.690 | 0.010 | 0.018 | 0.325 |
Performance metrics for the DBMS listed above. Some are normalized by throughput, others are not. Legend for results is here.
ips	qps	rps	rmbps	wps	wmbps	rpq	rkbpq	wpi	wkbpi	csps	cpups	cspq	cpupq	dbgb1	dbgb2	rss	maxop	p50	p99	tag
1976	188675	75	0.9	3904.0	105.4	0.000	0.005	1.976	54.612	669809	63.2	3.550	100	166.6	300.9	0.0	0.027	9398	9018	400m.pg1119_o3_native_lto.cx7a_gcp_c2s60
1976	197253	58	0.4	3812.5	103.1	0.000	0.002	1.930	53.436	700563	63.0	3.552	96	163.6	296.5	0.0	0.027	9781	9430	400m.pg1214_o3_native_lto.cx7a_gcp_c2s60
1976	198065	177	1.7	3506.4	86.6	0.001	0.009	1.775	44.903	703558	63.0	3.552	95	163.9	273.9	0.0	0.129	9813	9398	400m.pg1310_o3_native_lto.cx7a_gcp_c2s60
1976	196086	158	1.5	3518.8	82.2	0.001	0.008	1.781	42.614	697637	63.0	3.558	96	163.9	322.9	0.0	0.027	9717	9318	400m.pg147_o3_native_lto.cx7a_gcp_c2s60
1976	197942	168	1.6	3460.3	82.0	0.001	0.008	1.751	42.479	704632	63.0	3.560	95	163.9	320.1	0.0	0.201	9797	9414	400m.pg151_o3_native_lto.cx7a_gcp_c2s60
1976	197101	168	1.6	3468.9	82.8	0.001	0.008	1.756	42.887	702182	62.9	3.563	96	163.9	319.5	0.0	0.092	9833	9461	400m.pg152_o3_native_lto.cx7a_gcp_c2s60
q500.1
q500.1: range queries with 500 insert/s per client. Graphs for performance per 1-second interval are here.
Average throughput:
Query response time histogram: each cell has the percentage of responses that take <= the time in the header and max is the max response time in seconds. For max values in the top 25% of the range have a red background and in the bottom 25% of the range have a green background. The red background is not used when the min value is within 80% of the max value.
| dbms | 256us | 1ms | 4ms | 16ms | 64ms | 256ms | 1s | 4s | 16s | gt | max |
|---|---|---|---|---|---|---|---|---|---|---|---|
| pg1119_o3_native_lto.cx7a_gcp_c2s60 | 99.903 | 0.064 | 0.029 | 0.003 | nonzero | nonzero | 0.065 | ||||
| pg1214_o3_native_lto.cx7a_gcp_c2s60 | 99.912 | 0.056 | 0.028 | 0.003 | nonzero | nonzero | 0.064 | ||||
| pg1310_o3_native_lto.cx7a_gcp_c2s60 | 99.912 | 0.057 | 0.028 | 0.003 | nonzero | nonzero | nonzero | 0.285 | |||
| pg147_o3_native_lto.cx7a_gcp_c2s60 | 99.909 | 0.058 | 0.028 | 0.004 | nonzero | 0.047 | |||||
| pg151_o3_native_lto.cx7a_gcp_c2s60 | 99.912 | 0.056 | 0.028 | 0.004 | nonzero | 0.049 | |||||
| pg152_o3_native_lto.cx7a_gcp_c2s60 | 99.912 | 0.056 | 0.028 | 0.004 | nonzero | 0.045 |
Insert response time histogram: each cell has the percentage of responses that take <= the time in the header and max is the max response time in seconds. For max values in the top 25% of the range have a red background and in the bottom 25% of the range have a green background. The red background is not used when the min value is within 80% of the max value.
| dbms | 256us | 1ms | 4ms | 16ms | 64ms | 256ms | 1s | 4s | 16s | gt | max |
|---|---|---|---|---|---|---|---|---|---|---|---|
| pg1119_o3_native_lto.cx7a_gcp_c2s60 | 43.903 | 26.809 | 27.987 | 1.300 | 0.001 | 0.325 | |||||
| pg1214_o3_native_lto.cx7a_gcp_c2s60 | 43.807 | 26.331 | 28.459 | 1.403 | 0.001 | 0.297 | |||||
| pg1310_o3_native_lto.cx7a_gcp_c2s60 | 44.415 | 26.417 | 27.856 | 1.307 | 0.006 | 0.312 | |||||
| pg147_o3_native_lto.cx7a_gcp_c2s60 | 44.371 | 25.302 | 29.125 | 1.201 | 0.001 | 0.361 | |||||
| pg151_o3_native_lto.cx7a_gcp_c2s60 | 45.118 | 24.665 | 28.994 | 1.223 | 0.230 | ||||||
| pg152_o3_native_lto.cx7a_gcp_c2s60 | 44.607 | 25.076 | 29.166 | 1.144 | 0.006 | 0.399 |
Performance metrics for the DBMS listed above. Some are normalized by throughput, others are not. Legend for results is here.
ips	qps	rps	rmbps	wps	wmbps	rpq	rkbpq	wpi	wkbpi	csps	cpups	cspq	cpupq	dbgb1	dbgb2	rss	maxop	p50	p99	tag
9890	192502	10	0.2	6721.9	209.8	0.000	0.001	0.680	21.725	669748	64.0	3.479	100	171.6	264.6	0.0	0.065	9498	8998	400m.pg1119_o3_native_lto.cx7a_gcp_c2s60
9885	200389	10	0.2	6284.8	204.9	0.000	0.001	0.636	21.224	695574	64.2	3.471	96	167.1	259.5	0.0	0.064	9861	9326	400m.pg1214_o3_native_lto.cx7a_gcp_c2s60
9885	200386	2	0.0	6154.3	200.9	0.000	0.000	0.623	20.808	696249	64.2	3.475	96	167.5	247.8	0.0	0.285	9865	9382	400m.pg1310_o3_native_lto.cx7a_gcp_c2s60
9885	197693	4	0.0	6435.8	193.4	0.000	0.000	0.651	20.031	690476	64.0	3.493	97	167.5	276.5	0.0	0.047	9829	9318	400m.pg147_o3_native_lto.cx7a_gcp_c2s60
9885	200354	6	0.1	6400.4	194.1	0.000	0.000	0.648	20.103	698395	63.9	3.486	96	167.4	274.9	0.0	0.049	9877	9350	400m.pg151_o3_native_lto.cx7a_gcp_c2s60
9885	199559	6	0.0	6415.9	193.3	0.000	0.000	0.649	20.027	697295	64.0	3.494	96	167.5	274.8	0.0	0.045	9898	9366	400m.pg152_o3_native_lto.cx7a_gcp_c2s60
q1000.1
q1000.1: range queries with 1000 insert/s per client. Graphs for performance per 1-second interval are here.
Average throughput:
Query response time histogram: each cell has the percentage of responses that take <= the time in the header and max is the max response time in seconds. For max values in the top 25% of the range have a red background and in the bottom 25% of the range have a green background. The red background is not used when the min value is within 80% of the max value.
| dbms | 256us | 1ms | 4ms | 16ms | 64ms | 256ms | 1s | 4s | 16s | gt | max |
|---|---|---|---|---|---|---|---|---|---|---|---|
| pg1119_o3_native_lto.cx7a_gcp_c2s60 | 99.833 | 0.114 | 0.045 | 0.007 | nonzero | nonzero | 0.070 | ||||
| pg1214_o3_native_lto.cx7a_gcp_c2s60 | 99.845 | 0.104 | 0.044 | 0.007 | nonzero | nonzero | 0.100 | ||||
| pg1310_o3_native_lto.cx7a_gcp_c2s60 | 99.847 | 0.103 | 0.043 | 0.006 | nonzero | nonzero | 0.105 | ||||
| pg147_o3_native_lto.cx7a_gcp_c2s60 | 99.845 | 0.104 | 0.043 | 0.007 | nonzero | nonzero | 0.113 | ||||
| pg151_o3_native_lto.cx7a_gcp_c2s60 | 99.850 | 0.101 | 0.042 | 0.007 | nonzero | 0.058 | |||||
| pg152_o3_native_lto.cx7a_gcp_c2s60 | 99.850 | 0.100 | 0.043 | 0.007 | nonzero | 0.059 |
Insert response time histogram: each cell has the percentage of responses that take <= the time in the header and max is the max response time in seconds. For max values in the top 25% of the range have a red background and in the bottom 25% of the range have a green background. The red background is not used when the min value is within 80% of the max value.
| dbms | 256us | 1ms | 4ms | 16ms | 64ms | 256ms | 1s | 4s | 16s | gt | max |
|---|---|---|---|---|---|---|---|---|---|---|---|
| pg1119_o3_native_lto.cx7a_gcp_c2s60 | 56.332 | 23.117 | 19.664 | 0.886 | 0.254 | ||||||
| pg1214_o3_native_lto.cx7a_gcp_c2s60 | 56.191 | 23.258 | 19.548 | 1.002 | 0.249 | ||||||
| pg1310_o3_native_lto.cx7a_gcp_c2s60 | 56.719 | 21.964 | 20.053 | 1.264 | 0.253 | ||||||
| pg147_o3_native_lto.cx7a_gcp_c2s60 | 57.384 | 22.705 | 19.120 | 0.791 | 0.233 | ||||||
| pg151_o3_native_lto.cx7a_gcp_c2s60 | 57.634 | 22.750 | 18.822 | 0.794 | 0.199 | ||||||
| pg152_o3_native_lto.cx7a_gcp_c2s60 | 57.457 | 22.748 | 19.004 | 0.791 | 0.211 |
Performance metrics for the DBMS listed above. Some are normalized by throughput, others are not. Legend for results is here.
ips	qps	rps	rmbps	wps	wmbps	rpq	rkbpq	wpi	wkbpi	csps	cpups	cspq	cpupq	dbgb1	dbgb2	rss	maxop	p50	p99	tag
19769	195348	48	0.6	6404.8	297.4	0.000	0.003	0.324	15.406	659562	65.4	3.376	100	185.4	270.3	0.0	0.070	9670	8838	400m.pg1119_o3_native_lto.cx7a_gcp_c2s60
19769	203676	39	0.4	5498.2	289.0	0.000	0.002	0.278	14.969	685334	65.4	3.365	96	179.3	264.1	0.0	0.100	10037	9126	400m.pg1214_o3_native_lto.cx7a_gcp_c2s60
19769	204291	55	0.7	5607.7	293.5	0.000	0.003	0.284	15.203	689143	65.5	3.373	96	179.6	259.6	0.0	0.105	10121	9270	400m.pg1310_o3_native_lto.cx7a_gcp_c2s60
19769	201489	65	0.5	6379.5	267.1	0.000	0.003	0.323	13.833	683464	65.2	3.392	97	179.6	281.4	0.0	0.113	10069	9193	400m.pg147_o3_native_lto.cx7a_gcp_c2s60
19769	203691	63	0.5	6290.9	263.1	0.000	0.002	0.318	13.627	690673	65.2	3.391	96	179.6	280.4	0.0	0.058	10053	9163	400m.pg151_o3_native_lto.cx7a_gcp_c2s60
19769	203675	51	0.4	6305.6	264.1	0.000	0.002	0.319	13.678	690844	65.2	3.392	96	179.6	280.4	0.0	0.059	10165	9238	400m.pg152_o3_native_lto.cx7a_gcp_c2s60
l.i0
l.i0: load without secondary indexes
Performance metrics for all DBMS, not just the ones listed above. Some are normalized by throughput, others are not. Legend for results is here.
ips	qps	rps	rmbps	wps	wmbps	rpq	rkbpq	wpi	wkbpi	csps	cpups	cspq	cpupq	dbgb1	dbgb2	rss	maxop	p50	p99	tag
1433692	0	0	0.0	1829.2	492.3	0.000	0.000	0.001	0.352	227055	60.9	0.158	13	38.3	103.2	NA	1.234	81311	16782	400m.pg1119_o3_native_lto.cx7a_gcp_c2s60
1418440	0	0	0.0	1840.1	483.1	0.000	0.000	0.001	0.349	232332	60.8	0.164	13	38.3	103.2	NA	0.496	79444	24272	400m.pg1214_o3_native_lto.cx7a_gcp_c2s60
1418440	0	0	0.0	1814.0	482.0	0.000	0.000	0.001	0.348	240507	60.2	0.170	13	38.3	103.4	NA	0.508	80253	18280	400m.pg1310_o3_native_lto.cx7a_gcp_c2s60
1413428	0	0	0.0	1751.3	475.8	0.000	0.000	0.001	0.345	231964	60.3	0.164	13	38.3	103.4	NA	0.410	79613	23774	400m.pg147_o3_native_lto.cx7a_gcp_c2s60
1393728	0	0	0.0	1787.3	468.2	0.000	0.000	0.001	0.344	257420	60.1	0.185	13	38.3	103.4	0.0	1.104	77915	19286	400m.pg151_o3_native_lto.cx7a_gcp_c2s60
1398601	0	0	0.0	1827.8	477.4	0.000	0.000	0.001	0.350	261473	60.0	0.187	13	38.3	103.4	0.0	0.669	78714	24174	400m.pg152_o3_native_lto.cx7a_gcp_c2s60
l.x
l.x: create secondary indexes
Performance metrics for all DBMS, not just the ones listed above. Some are normalized by throughput, others are not. Legend for results is here.
ips	qps	rps	rmbps	wps	wmbps	rpq	rkbpq	wpi	wkbpi	csps	cpups	cspq	cpupq	dbgb1	dbgb2	rss	maxop	p50	p99	tag
2598052	0	1	0.0	3278.6	812.4	0.000	0.000	0.001	0.320	104341	24.4	0.040	3	73.5	170.5	0.0	0.032	NA	NA	400m.pg1119_o3_native_lto.cx7a_gcp_c2s60
2598052	0	0	0.0	3204.7	816.9	0.000	0.000	0.001	0.322	105827	25.2	0.041	3	73.5	170.5	0.0	0.045	NA	NA	400m.pg1214_o3_native_lto.cx7a_gcp_c2s60
2615033	0	0	0.0	3304.3	831.6	0.000	0.000	0.001	0.326	103461	25.6	0.040	3	73.5	170.7	0.0	0.063	NA	NA	400m.pg1310_o3_native_lto.cx7a_gcp_c2s60
2759310	0	0	0.0	3030.7	796.8	0.000	0.000	0.001	0.296	109024	26.1	0.040	3	73.5	170.7	0.0	0.438	NA	NA	400m.pg147_o3_native_lto.cx7a_gcp_c2s60
2778472	0	0	0.0	3129.8	810.7	0.000	0.000	0.001	0.299	110496	26.0	0.040	3	73.5	171.7	0.0	0.175	NA	NA	400m.pg151_o3_native_lto.cx7a_gcp_c2s60
2759310	0	0	0.0	3103.8	814.4	0.000	0.000	0.001	0.302	111661	25.6	0.040	3	73.5	171.7	0.0	0.067	NA	NA	400m.pg152_o3_native_lto.cx7a_gcp_c2s60
l.i1
l.i1: continue load after secondary indexes created
Performance metrics for all DBMS, not just the ones listed above. Some are normalized by throughput, others are not. Legend for results is here.
ips	qps	rps	rmbps	wps	wmbps	rpq	rkbpq	wpi	wkbpi	csps	cpups	cspq	cpupq	dbgb1	dbgb2	rss	maxop	p50	p99	tag
415800	0	2819	23.0	5608.4	537.9	0.007	0.057	0.013	1.325	268120	51.3	0.645	37	165.8	332.0	NA	1.127	26831	1699	400m.pg1119_o3_native_lto.cx7a_gcp_c2s60
414508	0	3027	22.1	5797.1	536.9	0.007	0.055	0.014	1.326	273614	51.7	0.660	37	163.1	328.1	NA	1.228	26770	1898	400m.pg1214_o3_native_lto.cx7a_gcp_c2s60
407747	0	3003	20.8	5263.9	553.4	0.007	0.052	0.013	1.390	286984	51.3	0.704	38	163.3	330.3	NA	1.255	25572	1898	400m.pg1310_o3_native_lto.cx7a_gcp_c2s60
421496	0	2472	17.1	4737.6	551.6	0.006	0.042	0.011	1.340	290520	52.6	0.689	37	163.3	346.9	0.0	1.182	26471	2149	400m.pg147_o3_native_lto.cx7a_gcp_c2s60
416233	0	2745	16.6	4710.3	546.7	0.007	0.041	0.011	1.345	313216	52.4	0.753	38	163.3	348.6	0.0	1.045	25871	2198	400m.pg151_o3_native_lto.cx7a_gcp_c2s60
418410	0	2437	16.4	4692.1	543.7	0.006	0.040	0.011	1.331	310293	52.4	0.742	38	163.3	347.3	NA	1.068	26071	1998	400m.pg152_o3_native_lto.cx7a_gcp_c2s60
q100.1
q100.1: range queries with 100 insert/s per client
Performance metrics for all DBMS, not just the ones listed above. Some are normalized by throughput, others are not. Legend for results is here.
ips	qps	rps	rmbps	wps	wmbps	rpq	rkbpq	wpi	wkbpi	csps	cpups	cspq	cpupq	dbgb1	dbgb2	rss	maxop	p50	p99	tag
1976	188675	75	0.9	3904.0	105.4	0.000	0.005	1.976	54.612	669809	63.2	3.550	100	166.6	300.9	0.0	0.027	9398	9018	400m.pg1119_o3_native_lto.cx7a_gcp_c2s60
1976	197253	58	0.4	3812.5	103.1	0.000	0.002	1.930	53.436	700563	63.0	3.552	96	163.6	296.5	0.0	0.027	9781	9430	400m.pg1214_o3_native_lto.cx7a_gcp_c2s60
1976	198065	177	1.7	3506.4	86.6	0.001	0.009	1.775	44.903	703558	63.0	3.552	95	163.9	273.9	0.0	0.129	9813	9398	400m.pg1310_o3_native_lto.cx7a_gcp_c2s60
1976	196086	158	1.5	3518.8	82.2	0.001	0.008	1.781	42.614	697637	63.0	3.558	96	163.9	322.9	0.0	0.027	9717	9318	400m.pg147_o3_native_lto.cx7a_gcp_c2s60
1976	197942	168	1.6	3460.3	82.0	0.001	0.008	1.751	42.479	704632	63.0	3.560	95	163.9	320.1	0.0	0.201	9797	9414	400m.pg151_o3_native_lto.cx7a_gcp_c2s60
1976	197101	168	1.6	3468.9	82.8	0.001	0.008	1.756	42.887	702182	62.9	3.563	96	163.9	319.5	0.0	0.092	9833	9461	400m.pg152_o3_native_lto.cx7a_gcp_c2s60
q500.1
q500.1: range queries with 500 insert/s per client
Performance metrics for all DBMS, not just the ones listed above. Some are normalized by throughput, others are not. Legend for results is here.
ips	qps	rps	rmbps	wps	wmbps	rpq	rkbpq	wpi	wkbpi	csps	cpups	cspq	cpupq	dbgb1	dbgb2	rss	maxop	p50	p99	tag
9890	192502	10	0.2	6721.9	209.8	0.000	0.001	0.680	21.725	669748	64.0	3.479	100	171.6	264.6	0.0	0.065	9498	8998	400m.pg1119_o3_native_lto.cx7a_gcp_c2s60
9885	200389	10	0.2	6284.8	204.9	0.000	0.001	0.636	21.224	695574	64.2	3.471	96	167.1	259.5	0.0	0.064	9861	9326	400m.pg1214_o3_native_lto.cx7a_gcp_c2s60
9885	200386	2	0.0	6154.3	200.9	0.000	0.000	0.623	20.808	696249	64.2	3.475	96	167.5	247.8	0.0	0.285	9865	9382	400m.pg1310_o3_native_lto.cx7a_gcp_c2s60
9885	197693	4	0.0	6435.8	193.4	0.000	0.000	0.651	20.031	690476	64.0	3.493	97	167.5	276.5	0.0	0.047	9829	9318	400m.pg147_o3_native_lto.cx7a_gcp_c2s60
9885	200354	6	0.1	6400.4	194.1	0.000	0.000	0.648	20.103	698395	63.9	3.486	96	167.4	274.9	0.0	0.049	9877	9350	400m.pg151_o3_native_lto.cx7a_gcp_c2s60
9885	199559	6	0.0	6415.9	193.3	0.000	0.000	0.649	20.027	697295	64.0	3.494	96	167.5	274.8	0.0	0.045	9898	9366	400m.pg152_o3_native_lto.cx7a_gcp_c2s60
q1000.1
q1000.1: range queries with 1000 insert/s per client
Performance metrics for all DBMS, not just the ones listed above. Some are normalized by throughput, others are not. Legend for results is here.
ips	qps	rps	rmbps	wps	wmbps	rpq	rkbpq	wpi	wkbpi	csps	cpups	cspq	cpupq	dbgb1	dbgb2	rss	maxop	p50	p99	tag
19769	195348	48	0.6	6404.8	297.4	0.000	0.003	0.324	15.406	659562	65.4	3.376	100	185.4	270.3	0.0	0.070	9670	8838	400m.pg1119_o3_native_lto.cx7a_gcp_c2s60
19769	203676	39	0.4	5498.2	289.0	0.000	0.002	0.278	14.969	685334	65.4	3.365	96	179.3	264.1	0.0	0.100	10037	9126	400m.pg1214_o3_native_lto.cx7a_gcp_c2s60
19769	204291	55	0.7	5607.7	293.5	0.000	0.003	0.284	15.203	689143	65.5	3.373	96	179.6	259.6	0.0	0.105	10121	9270	400m.pg1310_o3_native_lto.cx7a_gcp_c2s60
19769	201489	65	0.5	6379.5	267.1	0.000	0.003	0.323	13.833	683464	65.2	3.392	97	179.6	281.4	0.0	0.113	10069	9193	400m.pg147_o3_native_lto.cx7a_gcp_c2s60
19769	203691	63	0.5	6290.9	263.1	0.000	0.002	0.318	13.627	690673	65.2	3.391	96	179.6	280.4	0.0	0.058	10053	9163	400m.pg151_o3_native_lto.cx7a_gcp_c2s60
19769	203675	51	0.4	6305.6	264.1	0.000	0.002	0.319	13.678	690844	65.2	3.392	96	179.6	280.4	0.0	0.059	10165	9238	400m.pg152_o3_native_lto.cx7a_gcp_c2s60
l.i0
- l.i0: load without secondary indexes
- Legend for results is here.
- Each entry lists the percentage of responses that fit in that bucket (slower than max time for previous bucket, faster than min time for next bucket).
Insert response time histogram
256us	1ms	4ms	16ms	64ms	256ms	1s	4s	16s	gt	max	tag
0.000	61.827	37.288	0.835	0.016	0.023	0.010	nonzero	0.000	0.000	1.234	pg1119_o3_native_lto.cx7a_gcp_c2s60
0.000	59.680	39.487	0.781	0.020	0.024	0.007	0.000	0.000	0.000	0.496	pg1214_o3_native_lto.cx7a_gcp_c2s60
0.000	59.578	39.590	0.780	0.019	0.020	0.012	0.000	0.000	0.000	0.508	pg1310_o3_native_lto.cx7a_gcp_c2s60
0.000	59.476	39.637	0.834	0.019	0.024	0.010	0.000	0.000	0.000	0.410	pg147_o3_native_lto.cx7a_gcp_c2s60
0.000	57.634	41.520	0.796	0.022	0.019	0.009	0.001	0.000	0.000	1.104	pg151_o3_native_lto.cx7a_gcp_c2s60
0.000	57.385	41.814	0.744	0.025	0.024	0.008	0.000	0.000	0.000	0.669	pg152_o3_native_lto.cx7a_gcp_c2s60
l.x
- l.x: create secondary indexes
- Legend for results is here.
- Each entry lists the percentage of responses that fit in that bucket (slower than max time for previous bucket, faster than min time for next bucket).
TODO - determine whether there is data for create index response time
l.i1
- l.i1: continue load after secondary indexes created
- Legend for results is here.
- Each entry lists the percentage of responses that fit in that bucket (slower than max time for previous bucket, faster than min time for next bucket).
Insert response time histogram
256us	1ms	4ms	16ms	64ms	256ms	1s	4s	16s	gt	max	tag
0.000	0.004	96.480	1.887	1.584	0.031	0.015	nonzero	0.000	0.000	1.127	pg1119_o3_native_lto.cx7a_gcp_c2s60
0.000	0.010	96.339	2.127	1.484	0.026	0.014	nonzero	0.000	0.000	1.228	pg1214_o3_native_lto.cx7a_gcp_c2s60
0.000	0.010	96.068	2.383	1.497	0.033	0.009	nonzero	0.000	0.000	1.255	pg1310_o3_native_lto.cx7a_gcp_c2s60
0.000	nonzero	96.357	2.472	1.122	0.033	0.015	nonzero	0.000	0.000	1.182	pg147_o3_native_lto.cx7a_gcp_c2s60
0.000	0.003	96.248	2.610	1.092	0.036	0.011	nonzero	0.000	0.000	1.045	pg151_o3_native_lto.cx7a_gcp_c2s60
0.000	0.003	96.318	2.574	1.058	0.034	0.013	nonzero	0.000	0.000	1.068	pg152_o3_native_lto.cx7a_gcp_c2s60
q100.1
- q100.1: range queries with 100 insert/s per client
- Legend for results is here.
- Each entry lists the percentage of responses that fit in that bucket (slower than max time for previous bucket, faster than min time for next bucket).
Query response time histogram
256us	1ms	4ms	16ms	64ms	256ms	1s	4s	16s	gt	max	tag
99.950	0.042	0.007	0.001	nonzero	0.000	0.000	0.000	0.000	0.000	0.027	pg1119_o3_native_lto.cx7a_gcp_c2s60
99.953	0.040	0.006	0.001	nonzero	0.000	0.000	0.000	0.000	0.000	0.027	pg1214_o3_native_lto.cx7a_gcp_c2s60
99.916	0.077	0.006	0.001	nonzero	nonzero	0.000	0.000	0.000	0.000	0.129	pg1310_o3_native_lto.cx7a_gcp_c2s60
99.914	0.079	0.006	0.001	nonzero	0.000	0.000	0.000	0.000	0.000	0.027	pg147_o3_native_lto.cx7a_gcp_c2s60
99.917	0.076	0.006	0.001	nonzero	nonzero	0.000	0.000	0.000	0.000	0.201	pg151_o3_native_lto.cx7a_gcp_c2s60
99.917	0.076	0.006	0.001	nonzero	nonzero	0.000	0.000	0.000	0.000	0.092	pg152_o3_native_lto.cx7a_gcp_c2s60
Insert response time histogram
256us	1ms	4ms	16ms	64ms	256ms	1s	4s	16s	gt	max	tag
0.000	0.000	92.011	6.439	1.550	0.000	0.000	0.000	0.000	0.000	0.056	pg1119_o3_native_lto.cx7a_gcp_c2s60
0.000	0.000	96.101	2.853	1.031	0.014	0.001	0.000	0.000	0.000	0.778	pg1214_o3_native_lto.cx7a_gcp_c2s60
0.000	0.000	84.588	12.347	3.036	0.029	0.000	0.000	0.000	0.000	0.183	pg1310_o3_native_lto.cx7a_gcp_c2s60
0.000	0.000	94.310	4.558	1.132	0.000	0.000	0.000	0.000	0.000	0.058	pg147_o3_native_lto.cx7a_gcp_c2s60
0.000	0.000	95.233	4.078	0.689	0.000	0.000	0.000	0.000	0.000	0.036	pg151_o3_native_lto.cx7a_gcp_c2s60
0.000	0.000	92.847	5.435	1.690	0.010	0.018	0.000	0.000	0.000	0.325	pg152_o3_native_lto.cx7a_gcp_c2s60
q500.1
- q500.1: range queries with 500 insert/s per client
- Legend for results is here.
- Each entry lists the percentage of responses that fit in that bucket (slower than max time for previous bucket, faster than min time for next bucket).
Query response time histogram
256us	1ms	4ms	16ms	64ms	256ms	1s	4s	16s	gt	max	tag
99.903	0.064	0.029	0.003	nonzero	nonzero	0.000	0.000	0.000	0.000	0.065	pg1119_o3_native_lto.cx7a_gcp_c2s60
99.912	0.056	0.028	0.003	nonzero	nonzero	0.000	0.000	0.000	0.000	0.064	pg1214_o3_native_lto.cx7a_gcp_c2s60
99.912	0.057	0.028	0.003	nonzero	nonzero	nonzero	0.000	0.000	0.000	0.285	pg1310_o3_native_lto.cx7a_gcp_c2s60
99.909	0.058	0.028	0.004	nonzero	0.000	0.000	0.000	0.000	0.000	0.047	pg147_o3_native_lto.cx7a_gcp_c2s60
99.912	0.056	0.028	0.004	nonzero	0.000	0.000	0.000	0.000	0.000	0.049	pg151_o3_native_lto.cx7a_gcp_c2s60
99.912	0.056	0.028	0.004	nonzero	0.000	0.000	0.000	0.000	0.000	0.045	pg152_o3_native_lto.cx7a_gcp_c2s60
Insert response time histogram
256us	1ms	4ms	16ms	64ms	256ms	1s	4s	16s	gt	max	tag
0.000	0.000	43.903	26.809	27.987	1.300	0.001	0.000	0.000	0.000	0.325	pg1119_o3_native_lto.cx7a_gcp_c2s60
0.000	0.000	43.807	26.331	28.459	1.403	0.001	0.000	0.000	0.000	0.297	pg1214_o3_native_lto.cx7a_gcp_c2s60
0.000	0.000	44.415	26.417	27.856	1.307	0.006	0.000	0.000	0.000	0.312	pg1310_o3_native_lto.cx7a_gcp_c2s60
0.000	0.000	44.371	25.302	29.125	1.201	0.001	0.000	0.000	0.000	0.361	pg147_o3_native_lto.cx7a_gcp_c2s60
0.000	0.000	45.118	24.665	28.994	1.223	0.000	0.000	0.000	0.000	0.230	pg151_o3_native_lto.cx7a_gcp_c2s60
0.000	0.000	44.607	25.076	29.166	1.144	0.006	0.000	0.000	0.000	0.399	pg152_o3_native_lto.cx7a_gcp_c2s60
q1000.1
- q1000.1: range queries with 1000 insert/s per client
- Legend for results is here.
- Each entry lists the percentage of responses that fit in that bucket (slower than max time for previous bucket, faster than min time for next bucket).
Query response time histogram
256us	1ms	4ms	16ms	64ms	256ms	1s	4s	16s	gt	max	tag
99.833	0.114	0.045	0.007	nonzero	nonzero	0.000	0.000	0.000	0.000	0.070	pg1119_o3_native_lto.cx7a_gcp_c2s60
99.845	0.104	0.044	0.007	nonzero	nonzero	0.000	0.000	0.000	0.000	0.100	pg1214_o3_native_lto.cx7a_gcp_c2s60
99.847	0.103	0.043	0.006	nonzero	nonzero	0.000	0.000	0.000	0.000	0.105	pg1310_o3_native_lto.cx7a_gcp_c2s60
99.845	0.104	0.043	0.007	nonzero	nonzero	0.000	0.000	0.000	0.000	0.113	pg147_o3_native_lto.cx7a_gcp_c2s60
99.850	0.101	0.042	0.007	nonzero	0.000	0.000	0.000	0.000	0.000	0.058	pg151_o3_native_lto.cx7a_gcp_c2s60
99.850	0.100	0.043	0.007	nonzero	0.000	0.000	0.000	0.000	0.000	0.059	pg152_o3_native_lto.cx7a_gcp_c2s60
Insert response time histogram
256us	1ms	4ms	16ms	64ms	256ms	1s	4s	16s	gt	max	tag
0.000	0.000	56.332	23.117	19.664	0.886	0.000	0.000	0.000	0.000	0.254	pg1119_o3_native_lto.cx7a_gcp_c2s60
0.000	0.000	56.191	23.258	19.548	1.002	0.000	0.000	0.000	0.000	0.249	pg1214_o3_native_lto.cx7a_gcp_c2s60
0.000	0.000	56.719	21.964	20.053	1.264	0.000	0.000	0.000	0.000	0.253	pg1310_o3_native_lto.cx7a_gcp_c2s60
0.000	0.000	57.384	22.705	19.120	0.791	0.000	0.000	0.000	0.000	0.233	pg147_o3_native_lto.cx7a_gcp_c2s60
0.000	0.000	57.634	22.750	18.822	0.794	0.000	0.000	0.000	0.000	0.199	pg151_o3_native_lto.cx7a_gcp_c2s60
0.000	0.000	57.457	22.748	19.004	0.791	0.000	0.000	0.000	0.000	0.211	pg152_o3_native_lto.cx7a_gcp_c2s60