Introduction
This is a report for the insert benchmark with 400M docs and 20 client(s). It is generated by scripts (bash, awk, sed) and Tufte might not be impressed. An overview of the insert benchmark is here and a short update is here. Below, by DBMS, I mean DBMS+version.config. An example is my8020.c10b40 where my means MySQL, 8020 is version 8.0.20 and c10b40 is the name for the configuration file.
The test server is c2-standard-60 from GCP with 30 cores, hyperthreads disabled, 240G RAM and 3T of NVMe (XFS with RAID0 over 8 devices). The benchmark was run with 20 clients and there were 1 or 2 connections per client (1 for queries, 1 for inserts). It uses 20 tables with a client per table. It loads 20M rows per table without secondary indexes, creates secondary indexes, loads another 20M rows per table then does 3 read+write tests for one hour each that do queries as fast as possible with 100, 500 and then 1000 writes/second/client concurrent with the queries. The database is cached by the OS but not by Postgres. Clients and the DBMS share one server. The per-database configs are in the per-database subdirectories here.
The tested DBMS are:
- pg1119_o3_native_lto.cx7_gcp_c2s60_4g - Postgres 11.19, the cx7_gcp_c2s60_4g config and the build used: -O3 -march=native -mtune=native and -flto
- pg1214_o3_native_lto.cx7_gcp_c2s60_4g - Postgres 12.14, the cx7_gcp_c2s60_4g config and the build used: -O3 -march=native -mtune=native and -flto
- pg1310_o3_native_lto.cx7_gcp_c2s60_4g - Postgres 13.10, the cx7_gcp_c2s60_4g config and the build used: -O3 -march=native -mtune=native and -flto
- pg147_o3_native_lto.cx7_gcp_c2s60_4g - Postgres 14.7, the cx7_gcp_c2s60_4g config and the build used: -O3 -march=native -mtune=native and -flto
- pg151_o3_native_lto.cx7_gcp_c2s60_4g - Postgres 15.1, the cx7_gcp_c2s60_4g config and the build used: -O3 -march=native -mtune=native and -flto
- pg152_o3_native_lto.cx7_gcp_c2s60_4g - Postgres 15.2, the cx7_gcp_c2s60_4g config and the build used: -O3 -march=native -mtune=native and -flto
Contents
- Summary
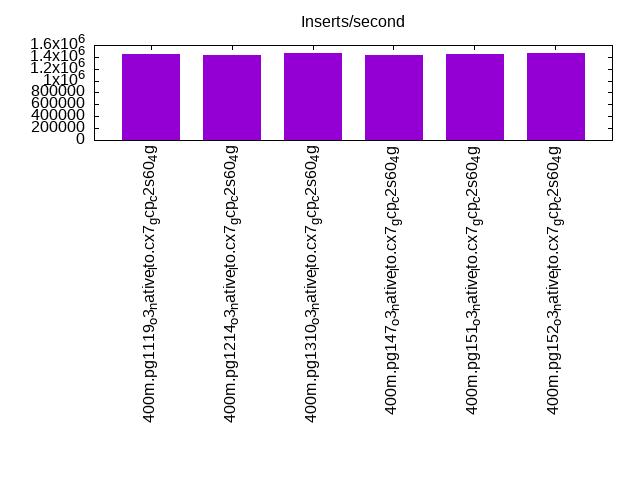
- l.i0: load without secondary indexes
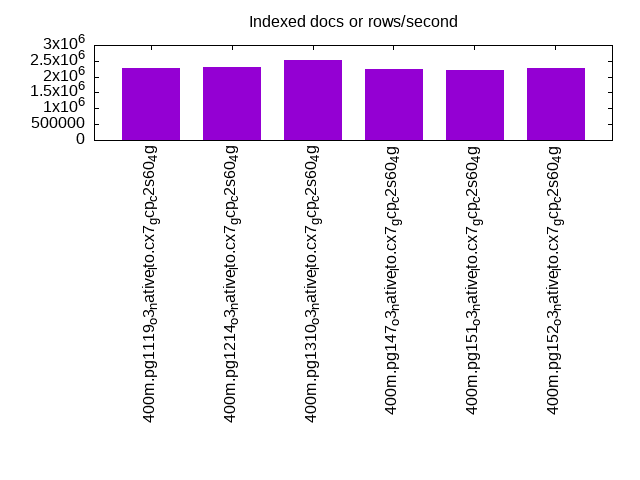
- l.x: create secondary indexes
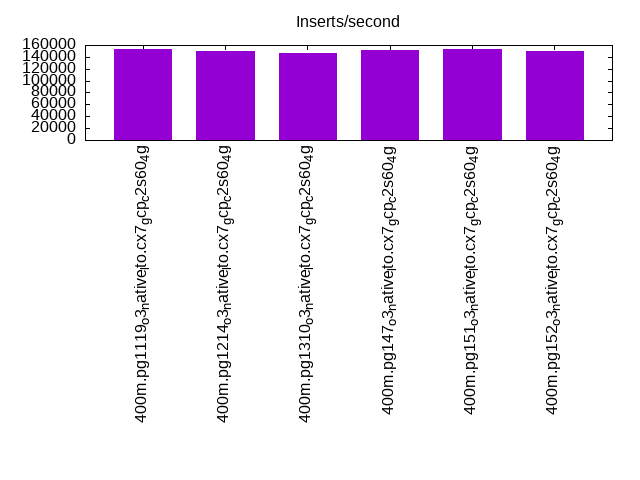
- l.i1: continue load after secondary indexes created
- q100.1: range queries with 100 insert/s per client
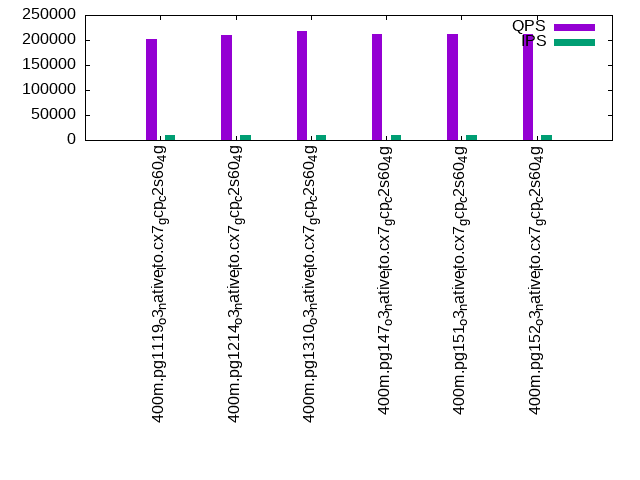
- q500.1: range queries with 500 insert/s per client
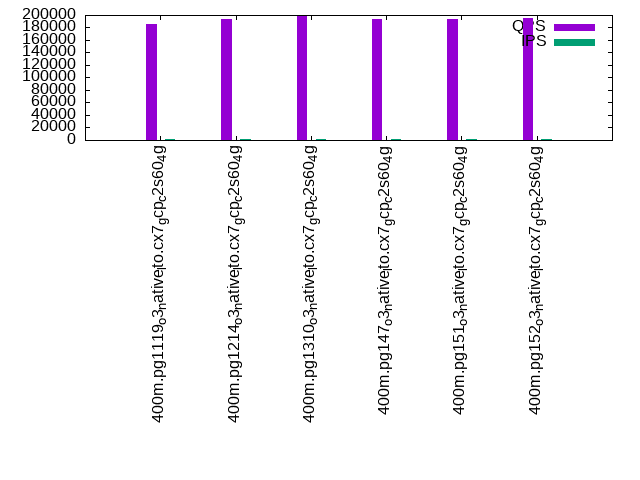
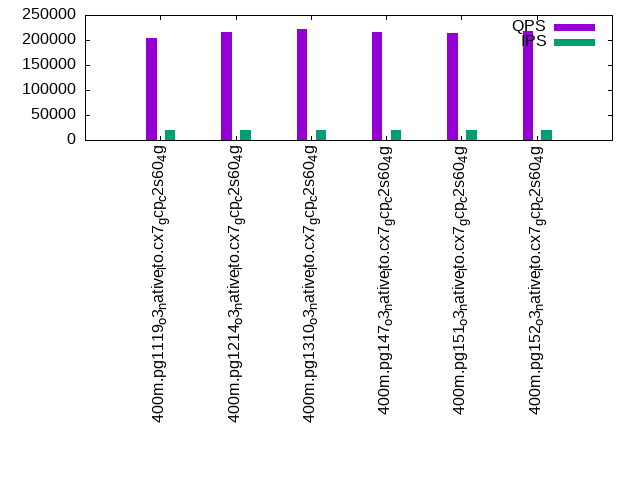
- q1000.1: range queries with 1000 insert/s per client
Summary
The numbers are inserts/s for l.i0 and l.i1, indexed docs (or rows) /s for l.x and queries/s for q*.2. The values are the average rate over the entire test for inserts (IPS) and queries (QPS). The range of values for IPS and QPS is split into 3 parts: bottom 25%, middle 50%, top 25%. Values in the bottom 25% have a red background, values in the top 25% have a green background and values in the middle have no color. A gray background is used for values that can be ignored because the DBMS did not sustain the target insert rate. Red backgrounds are not used when the minimum value is within 80% of the max value.
| dbms | l.i0 | l.x | l.i1 | q100.1 | q500.1 | q1000.1 |
|---|---|---|---|---|---|---|
| 400m.pg1119_o3_native_lto.cx7_gcp_c2s60_4g | 1449275 | 2273295 | 152964 | 185303 | 201176 | 204268 |
| 400m.pg1214_o3_native_lto.cx7_gcp_c2s60_4g | 1428571 | 2312717 | 149198 | 194186 | 210675 | 215760 |
| 400m.pg1310_o3_native_lto.cx7_gcp_c2s60_4g | 1465201 | 2516352 | 146897 | 199374 | 217362 | 221057 |
| 400m.pg147_o3_native_lto.cx7_gcp_c2s60_4g | 1428571 | 2247753 | 151114 | 193581 | 211679 | 215660 |
| 400m.pg151_o3_native_lto.cx7_gcp_c2s60_4g | 1454545 | 2198352 | 153315 | 193608 | 211192 | 214804 |
| 400m.pg152_o3_native_lto.cx7_gcp_c2s60_4g | 1459854 | 2260452 | 150489 | 194594 | 212687 | 217247 |
This table has relative throughput, throughput for the DBMS relative to the DBMS in the first line, using the absolute throughput from the previous table.
| dbms | l.i0 | l.x | l.i1 | q100.1 | q500.1 | q1000.1 |
|---|---|---|---|---|---|---|
| 400m.pg1119_o3_native_lto.cx7_gcp_c2s60_4g | 1.00 | 1.00 | 1.00 | 1.00 | 1.00 | 1.00 |
| 400m.pg1214_o3_native_lto.cx7_gcp_c2s60_4g | 0.99 | 1.02 | 0.98 | 1.05 | 1.05 | 1.06 |
| 400m.pg1310_o3_native_lto.cx7_gcp_c2s60_4g | 1.01 | 1.11 | 0.96 | 1.08 | 1.08 | 1.08 |
| 400m.pg147_o3_native_lto.cx7_gcp_c2s60_4g | 0.99 | 0.99 | 0.99 | 1.04 | 1.05 | 1.06 |
| 400m.pg151_o3_native_lto.cx7_gcp_c2s60_4g | 1.00 | 0.97 | 1.00 | 1.04 | 1.05 | 1.05 |
| 400m.pg152_o3_native_lto.cx7_gcp_c2s60_4g | 1.01 | 0.99 | 0.98 | 1.05 | 1.06 | 1.06 |
This lists the average rate of inserts/s for the tests that do inserts concurrent with queries. For such tests the query rate is listed in the table above. The read+write tests are setup so that the insert rate should match the target rate every second. Cells that are not at least 95% of the target have a red background to indicate a failure to satisfy the target.
| dbms | q100.1 | q500.1 | q1000.1 |
|---|---|---|---|
| pg1119_o3_native_lto.cx7_gcp_c2s60_4g | 1977 | 9885 | 19769 |
| pg1214_o3_native_lto.cx7_gcp_c2s60_4g | 1976 | 9885 | 19769 |
| pg1310_o3_native_lto.cx7_gcp_c2s60_4g | 1976 | 9885 | 19769 |
| pg147_o3_native_lto.cx7_gcp_c2s60_4g | 1976 | 9890 | 19769 |
| pg151_o3_native_lto.cx7_gcp_c2s60_4g | 1976 | 9885 | 19769 |
| pg152_o3_native_lto.cx7_gcp_c2s60_4g | 1976 | 9885 | 19769 |
| target | 2000 | 10000 | 20000 |
l.i0
l.i0: load without secondary indexes. Graphs for performance per 1-second interval are here.
Average throughput:
Insert response time histogram: each cell has the percentage of responses that take <= the time in the header and max is the max response time in seconds. For the max column values in the top 25% of the range have a red background and in the bottom 25% of the range have a green background. The red background is not used when the min value is within 80% of the max value.
| dbms | 256us | 1ms | 4ms | 16ms | 64ms | 256ms | 1s | 4s | 16s | gt | max |
|---|---|---|---|---|---|---|---|---|---|---|---|
| pg1119_o3_native_lto.cx7_gcp_c2s60_4g | 62.982 | 35.987 | 0.960 | 0.038 | 0.029 | 0.004 | 0.535 | ||||
| pg1214_o3_native_lto.cx7_gcp_c2s60_4g | 61.435 | 37.466 | 1.020 | 0.044 | 0.033 | 0.002 | 0.386 | ||||
| pg1310_o3_native_lto.cx7_gcp_c2s60_4g | 63.716 | 35.276 | 0.945 | 0.028 | 0.025 | 0.010 | 0.516 | ||||
| pg147_o3_native_lto.cx7_gcp_c2s60_4g | 61.893 | 37.125 | 0.918 | 0.028 | 0.028 | 0.007 | 0.621 | ||||
| pg151_o3_native_lto.cx7_gcp_c2s60_4g | 62.747 | 36.260 | 0.920 | 0.039 | 0.023 | 0.010 | 0.559 | ||||
| pg152_o3_native_lto.cx7_gcp_c2s60_4g | 62.755 | 36.269 | 0.910 | 0.035 | 0.025 | 0.006 | 0.682 |
Performance metrics for the DBMS listed above. Some are normalized by throughput, others are not. Legend for results is here.
ips	qps	rps	rmbps	wps	wmbps	rpq	rkbpq	wpi	wkbpi	csps	cpups	cspq	cpupq	dbgb1	dbgb2	rss	maxop	p50	p99	tag
1449275	0	0	0.0	10238.0	591.5	0.000	0.000	0.007	0.418	236176	60.6	0.163	13	38.3	103.2	NA	0.535	81110	31865	400m.pg1119_o3_native_lto.cx7_gcp_c2s60_4g
1428571	0	0	0.0	11173.6	595.5	0.000	0.000	0.008	0.427	237209	60.5	0.166	13	38.3	103.2	NA	0.386	78713	27069	400m.pg1214_o3_native_lto.cx7_gcp_c2s60_4g
1465201	0	0	0.0	10376.0	609.5	0.000	0.000	0.007	0.426	225384	60.1	0.154	12	38.3	103.2	NA	0.516	83408	21676	400m.pg1310_o3_native_lto.cx7_gcp_c2s60_4g
1428571	0	0	0.0	10099.1	593.4	0.000	0.000	0.007	0.425	224993	59.6	0.157	13	38.3	103.2	NA	0.621	81411	24773	400m.pg147_o3_native_lto.cx7_gcp_c2s60_4g
1454545	0	0	0.0	10210.5	603.1	0.000	0.000	0.007	0.425	229062	59.7	0.157	12	38.3	103.2	NA	0.559	81410	19579	400m.pg151_o3_native_lto.cx7_gcp_c2s60_4g
1459854	0	0	0.0	10345.9	608.9	0.000	0.000	0.007	0.427	239434	60.5	0.164	12	38.3	103.2	NA	0.682	81711	31365	400m.pg152_o3_native_lto.cx7_gcp_c2s60_4g
l.x
l.x: create secondary indexes.
Average throughput:
Performance metrics for the DBMS listed above. Some are normalized by throughput, others are not. Legend for results is here.
ips	qps	rps	rmbps	wps	wmbps	rpq	rkbpq	wpi	wkbpi	csps	cpups	cspq	cpupq	dbgb1	dbgb2	rss	maxop	p50	p99	tag
2273295	0	0	0.0	4578.5	890.1	0.000	0.000	0.002	0.401	116776	22.1	0.051	3	73.5	178.1	NA	0.021	NA	NA	400m.pg1119_o3_native_lto.cx7_gcp_c2s60_4g
2312717	0	0	0.0	8454.5	895.3	0.000	0.000	0.004	0.396	131153	23.0	0.057	3	73.5	180.9	0.0	0.042	NA	NA	400m.pg1214_o3_native_lto.cx7_gcp_c2s60_4g
2516352	0	0	0.0	3980.1	894.9	0.000	0.000	0.002	0.364	101472	23.9	0.040	3	73.5	174.7	NA	0.240	NA	NA	400m.pg1310_o3_native_lto.cx7_gcp_c2s60_4g
2247753	0	0	0.0	5576.0	888.4	0.000	0.000	0.002	0.405	117325	22.6	0.052	3	73.5	183.4	NA	0.108	NA	NA	400m.pg147_o3_native_lto.cx7_gcp_c2s60_4g
2198352	0	0	0.0	5809.6	895.1	0.000	0.000	0.003	0.417	117662	21.9	0.054	3	73.5	185.6	NA	0.051	NA	NA	400m.pg151_o3_native_lto.cx7_gcp_c2s60_4g
2260452	0	0	0.0	5437.6	869.0	0.000	0.000	0.002	0.394	114595	22.2	0.051	3	73.5	183.4	NA	0.071	NA	NA	400m.pg152_o3_native_lto.cx7_gcp_c2s60_4g
l.i1
l.i1: continue load after secondary indexes created. Graphs for performance per 1-second interval are here.
Average throughput:
Insert response time histogram: each cell has the percentage of responses that take <= the time in the header and max is the max response time in seconds. For the max column values in the top 25% of the range have a red background and in the bottom 25% of the range have a green background. The red background is not used when the min value is within 80% of the max value.
| dbms | 256us | 1ms | 4ms | 16ms | 64ms | 256ms | 1s | 4s | 16s | gt | max |
|---|---|---|---|---|---|---|---|---|---|---|---|
| pg1119_o3_native_lto.cx7_gcp_c2s60_4g | 64.487 | 29.527 | 5.101 | 0.863 | 0.023 | 0.722 | |||||
| pg1214_o3_native_lto.cx7_gcp_c2s60_4g | 67.264 | 26.287 | 5.471 | 0.943 | 0.036 | 0.724 | |||||
| pg1310_o3_native_lto.cx7_gcp_c2s60_4g | 68.106 | 25.263 | 5.612 | 0.979 | 0.041 | 0.882 | |||||
| pg147_o3_native_lto.cx7_gcp_c2s60_4g | 65.248 | 28.611 | 5.360 | 0.741 | 0.040 | nonzero | 1.055 | ||||
| pg151_o3_native_lto.cx7_gcp_c2s60_4g | 65.608 | 28.218 | 5.416 | 0.725 | 0.033 | 0.962 | |||||
| pg152_o3_native_lto.cx7_gcp_c2s60_4g | 64.408 | 29.067 | 5.756 | 0.742 | 0.028 | 0.733 |
Performance metrics for the DBMS listed above. Some are normalized by throughput, others are not. Legend for results is here.
ips	qps	rps	rmbps	wps	wmbps	rpq	rkbpq	wpi	wkbpi	csps	cpups	cspq	cpupq	dbgb1	dbgb2	rss	maxop	p50	p99	tag
152964	0	61	0.6	47588.7	1321.2	0.000	0.004	0.311	8.844	163384	41.4	1.068	81	165.8	269.6	NA	0.722	8341	849	400m.pg1119_o3_native_lto.cx7_gcp_c2s60_4g
149198	0	110	1.2	49821.6	1328.7	0.001	0.008	0.334	9.120	167777	39.8	1.125	80	163.1	274.1	0.0	0.724	7791	750	400m.pg1214_o3_native_lto.cx7_gcp_c2s60_4g
146897	0	63	0.6	48897.1	1325.9	0.000	0.004	0.333	9.243	169160	38.8	1.152	79	163.3	279.1	NA	0.882	7691	699	400m.pg1310_o3_native_lto.cx7_gcp_c2s60_4g
151114	0	577	3.6	48741.0	1317.6	0.004	0.024	0.323	8.929	157567	39.9	1.043	79	163.3	302.9	NA	1.055	7647	949	400m.pg147_o3_native_lto.cx7_gcp_c2s60_4g
153315	0	554	3.3	48017.3	1314.6	0.004	0.022	0.313	8.780	166626	40.1	1.087	78	163.3	304.0	NA	0.962	7744	899	400m.pg151_o3_native_lto.cx7_gcp_c2s60_4g
150489	0	563	3.3	48282.5	1318.0	0.004	0.022	0.321	8.968	162824	39.7	1.082	79	163.3	302.7	NA	0.733	7741	899	400m.pg152_o3_native_lto.cx7_gcp_c2s60_4g
q100.1
q100.1: range queries with 100 insert/s per client. Graphs for performance per 1-second interval are here.
Average throughput:
Query response time histogram: each cell has the percentage of responses that take <= the time in the header and max is the max response time in seconds. For max values in the top 25% of the range have a red background and in the bottom 25% of the range have a green background. The red background is not used when the min value is within 80% of the max value.
| dbms | 256us | 1ms | 4ms | 16ms | 64ms | 256ms | 1s | 4s | 16s | gt | max |
|---|---|---|---|---|---|---|---|---|---|---|---|
| pg1119_o3_native_lto.cx7_gcp_c2s60_4g | 99.949 | 0.042 | 0.008 | 0.001 | nonzero | nonzero | 0.137 | ||||
| pg1214_o3_native_lto.cx7_gcp_c2s60_4g | 99.962 | 0.030 | 0.008 | 0.001 | nonzero | nonzero | 0.212 | ||||
| pg1310_o3_native_lto.cx7_gcp_c2s60_4g | 99.924 | 0.068 | 0.008 | 0.001 | nonzero | nonzero | 0.189 | ||||
| pg147_o3_native_lto.cx7_gcp_c2s60_4g | 99.953 | 0.038 | 0.007 | 0.001 | nonzero | nonzero | nonzero | 0.338 | |||
| pg151_o3_native_lto.cx7_gcp_c2s60_4g | 99.951 | 0.041 | 0.007 | 0.001 | nonzero | nonzero | nonzero | 0.372 | |||
| pg152_o3_native_lto.cx7_gcp_c2s60_4g | 99.954 | 0.038 | 0.007 | 0.001 | nonzero | nonzero | nonzero | 0.355 |
Insert response time histogram: each cell has the percentage of responses that take <= the time in the header and max is the max response time in seconds. For max values in the top 25% of the range have a red background and in the bottom 25% of the range have a green background. The red background is not used when the min value is within 80% of the max value.
| dbms | 256us | 1ms | 4ms | 16ms | 64ms | 256ms | 1s | 4s | 16s | gt | max |
|---|---|---|---|---|---|---|---|---|---|---|---|
| pg1119_o3_native_lto.cx7_gcp_c2s60_4g | 94.976 | 4.386 | 0.637 | 0.061 | |||||||
| pg1214_o3_native_lto.cx7_gcp_c2s60_4g | 93.617 | 3.256 | 3.039 | 0.089 | 0.099 | ||||||
| pg1310_o3_native_lto.cx7_gcp_c2s60_4g | 94.221 | 5.294 | 0.485 | 0.038 | |||||||
| pg147_o3_native_lto.cx7_gcp_c2s60_4g | 94.968 | 4.568 | 0.462 | 0.001 | 0.090 | ||||||
| pg151_o3_native_lto.cx7_gcp_c2s60_4g | 95.942 | 3.729 | 0.311 | 0.017 | 0.001 | 0.292 | |||||
| pg152_o3_native_lto.cx7_gcp_c2s60_4g | 96.300 | 3.357 | 0.343 | 0.041 |
Performance metrics for the DBMS listed above. Some are normalized by throughput, others are not. Legend for results is here.
ips	qps	rps	rmbps	wps	wmbps	rpq	rkbpq	wpi	wkbpi	csps	cpups	cspq	cpupq	dbgb1	dbgb2	rss	maxop	p50	p99	tag
1977	185303	70	0.5	6328.9	71.6	0.000	0.003	3.201	37.074	660345	63.2	3.564	102	166.6	264.7	0.0	0.137	9238	8838	400m.pg1119_o3_native_lto.cx7_gcp_c2s60_4g
1976	194186	7	0.0	6299.0	75.5	0.000	0.000	3.188	39.152	689542	62.9	3.551	97	163.6	276.9	0.0	0.212	9605	9174	400m.pg1214_o3_native_lto.cx7_gcp_c2s60_4g
1976	199374	245	1.9	6287.9	73.8	0.001	0.010	3.182	38.250	706945	62.6	3.546	94	163.9	254.4	0.0	0.189	9925	9445	400m.pg1310_o3_native_lto.cx7_gcp_c2s60_4g
1976	193581	182	1.2	6281.3	73.5	0.001	0.006	3.179	38.079	689675	62.9	3.563	97	163.9	266.1	0.0	0.338	9589	9190	400m.pg147_o3_native_lto.cx7_gcp_c2s60_4g
1976	193608	161	1.0	6279.6	72.9	0.001	0.005	3.178	37.762	689550	62.7	3.562	97	163.9	264.6	0.0	0.372	9526	9142	400m.pg151_o3_native_lto.cx7_gcp_c2s60_4g
1976	194594	187	1.2	6285.5	72.7	0.001	0.006	3.181	37.702	693772	62.6	3.565	97	163.9	266.4	0.0	0.355	9637	9254	400m.pg152_o3_native_lto.cx7_gcp_c2s60_4g
q500.1
q500.1: range queries with 500 insert/s per client. Graphs for performance per 1-second interval are here.
Average throughput:
Query response time histogram: each cell has the percentage of responses that take <= the time in the header and max is the max response time in seconds. For max values in the top 25% of the range have a red background and in the bottom 25% of the range have a green background. The red background is not used when the min value is within 80% of the max value.
| dbms | 256us | 1ms | 4ms | 16ms | 64ms | 256ms | 1s | 4s | 16s | gt | max |
|---|---|---|---|---|---|---|---|---|---|---|---|
| pg1119_o3_native_lto.cx7_gcp_c2s60_4g | 99.813 | 0.146 | 0.038 | 0.004 | nonzero | nonzero | 0.152 | ||||
| pg1214_o3_native_lto.cx7_gcp_c2s60_4g | 99.827 | 0.133 | 0.037 | 0.003 | nonzero | nonzero | 0.068 | ||||
| pg1310_o3_native_lto.cx7_gcp_c2s60_4g | 99.836 | 0.126 | 0.035 | 0.003 | nonzero | nonzero | 0.065 | ||||
| pg147_o3_native_lto.cx7_gcp_c2s60_4g | 99.830 | 0.131 | 0.036 | 0.003 | nonzero | nonzero | 0.070 | ||||
| pg151_o3_native_lto.cx7_gcp_c2s60_4g | 99.830 | 0.130 | 0.036 | 0.003 | nonzero | nonzero | 0.094 | ||||
| pg152_o3_native_lto.cx7_gcp_c2s60_4g | 99.831 | 0.130 | 0.036 | 0.003 | nonzero | nonzero | 0.158 |
Insert response time histogram: each cell has the percentage of responses that take <= the time in the header and max is the max response time in seconds. For max values in the top 25% of the range have a red background and in the bottom 25% of the range have a green background. The red background is not used when the min value is within 80% of the max value.
| dbms | 256us | 1ms | 4ms | 16ms | 64ms | 256ms | 1s | 4s | 16s | gt | max |
|---|---|---|---|---|---|---|---|---|---|---|---|
| pg1119_o3_native_lto.cx7_gcp_c2s60_4g | 35.125 | 38.668 | 25.689 | 0.518 | 0.230 | ||||||
| pg1214_o3_native_lto.cx7_gcp_c2s60_4g | 34.020 | 38.824 | 26.617 | 0.540 | 0.219 | ||||||
| pg1310_o3_native_lto.cx7_gcp_c2s60_4g | 34.207 | 40.124 | 25.217 | 0.453 | 0.228 | ||||||
| pg147_o3_native_lto.cx7_gcp_c2s60_4g | 35.543 | 35.860 | 27.978 | 0.619 | 0.248 | ||||||
| pg151_o3_native_lto.cx7_gcp_c2s60_4g | 35.132 | 36.447 | 27.806 | 0.616 | 0.247 | ||||||
| pg152_o3_native_lto.cx7_gcp_c2s60_4g | 34.687 | 36.780 | 27.927 | 0.601 | 0.005 | 0.318 |
Performance metrics for the DBMS listed above. Some are normalized by throughput, others are not. Legend for results is here.
ips	qps	rps	rmbps	wps	wmbps	rpq	rkbpq	wpi	wkbpi	csps	cpups	cspq	cpupq	dbgb1	dbgb2	rss	maxop	p50	p99	tag
9885	201176	36	0.4	29917.6	325.4	0.000	0.002	3.027	33.709	663005	64.9	3.296	97	171.6	248.7	0.0	0.152	9909	8838	400m.pg1119_o3_native_lto.cx7_gcp_c2s60_4g
9885	210675	114	0.7	29711.6	324.7	0.001	0.004	3.006	33.641	692274	65.0	3.286	93	167.1	252.1	0.0	0.068	10261	9186	400m.pg1214_o3_native_lto.cx7_gcp_c2s60_4g
9885	217362	3	0.0	29418.6	321.3	0.000	0.000	2.976	33.284	708491	65.0	3.260	90	167.5	240.4	0.0	0.065	10708	9477	400m.pg1310_o3_native_lto.cx7_gcp_c2s60_4g
9890	211679	7	0.0	29477.1	327.3	0.000	0.000	2.980	33.885	694221	65.0	3.280	92	167.4	252.0	0.0	0.070	10441	9289	400m.pg147_o3_native_lto.cx7_gcp_c2s60_4g
9885	211192	10	0.1	29498.3	327.4	0.000	0.000	2.984	33.919	694193	64.9	3.287	92	167.4	251.4	0.0	0.094	10293	9146	400m.pg151_o3_native_lto.cx7_gcp_c2s60_4g
9885	212687	8	0.1	29486.0	327.2	0.000	0.000	2.983	33.897	697647	64.9	3.280	92	167.4	251.9	0.0	0.158	10372	9193	400m.pg152_o3_native_lto.cx7_gcp_c2s60_4g
q1000.1
q1000.1: range queries with 1000 insert/s per client. Graphs for performance per 1-second interval are here.
Average throughput:
Query response time histogram: each cell has the percentage of responses that take <= the time in the header and max is the max response time in seconds. For max values in the top 25% of the range have a red background and in the bottom 25% of the range have a green background. The red background is not used when the min value is within 80% of the max value.
| dbms | 256us | 1ms | 4ms | 16ms | 64ms | 256ms | 1s | 4s | 16s | gt | max |
|---|---|---|---|---|---|---|---|---|---|---|---|
| pg1119_o3_native_lto.cx7_gcp_c2s60_4g | 99.481 | 0.411 | 0.098 | 0.010 | 0.001 | nonzero | 0.090 | ||||
| pg1214_o3_native_lto.cx7_gcp_c2s60_4g | 99.475 | 0.417 | 0.099 | 0.009 | nonzero | nonzero | 0.080 | ||||
| pg1310_o3_native_lto.cx7_gcp_c2s60_4g | 99.493 | 0.400 | 0.099 | 0.009 | nonzero | nonzero | 0.134 | ||||
| pg147_o3_native_lto.cx7_gcp_c2s60_4g | 99.480 | 0.410 | 0.100 | 0.010 | nonzero | nonzero | 0.087 | ||||
| pg151_o3_native_lto.cx7_gcp_c2s60_4g | 99.475 | 0.415 | 0.100 | 0.009 | 0.001 | nonzero | 0.077 | ||||
| pg152_o3_native_lto.cx7_gcp_c2s60_4g | 99.492 | 0.402 | 0.097 | 0.009 | nonzero | nonzero | 0.076 |
Insert response time histogram: each cell has the percentage of responses that take <= the time in the header and max is the max response time in seconds. For max values in the top 25% of the range have a red background and in the bottom 25% of the range have a green background. The red background is not used when the min value is within 80% of the max value.
| dbms | 256us | 1ms | 4ms | 16ms | 64ms | 256ms | 1s | 4s | 16s | gt | max |
|---|---|---|---|---|---|---|---|---|---|---|---|
| pg1119_o3_native_lto.cx7_gcp_c2s60_4g | 36.910 | 44.374 | 17.497 | 1.213 | 0.006 | 0.489 | |||||
| pg1214_o3_native_lto.cx7_gcp_c2s60_4g | 28.914 | 50.875 | 19.222 | 0.986 | 0.003 | 0.289 | |||||
| pg1310_o3_native_lto.cx7_gcp_c2s60_4g | 26.897 | 50.537 | 21.245 | 1.319 | 0.001 | 0.337 | |||||
| pg147_o3_native_lto.cx7_gcp_c2s60_4g | 30.221 | 50.561 | 18.447 | 0.772 | 0.249 | ||||||
| pg151_o3_native_lto.cx7_gcp_c2s60_4g | 29.946 | 50.558 | 18.626 | 0.870 | 0.250 | ||||||
| pg152_o3_native_lto.cx7_gcp_c2s60_4g | 29.548 | 50.920 | 18.667 | 0.865 | 0.205 |
Performance metrics for the DBMS listed above. Some are normalized by throughput, others are not. Legend for results is here.
ips	qps	rps	rmbps	wps	wmbps	rpq	rkbpq	wpi	wkbpi	csps	cpups	cspq	cpupq	dbgb1	dbgb2	rss	maxop	p50	p99	tag
19769	204268	59	0.6	53514.2	578.7	0.000	0.003	2.707	29.977	639399	66.5	3.130	98	185.4	264.5	0.0	0.090	10165	8583	400m.pg1119_o3_native_lto.cx7_gcp_c2s60_4g
19769	215760	197	1.5	53061.5	573.0	0.001	0.007	2.684	29.678	673224	66.4	3.120	92	179.3	260.3	0.0	0.080	10676	8902	400m.pg1214_o3_native_lto.cx7_gcp_c2s60_4g
19769	221057	65	0.4	53093.1	582.9	0.000	0.002	2.686	30.195	687652	66.4	3.111	90	179.6	259.5	0.0	0.134	11012	9260	400m.pg1310_o3_native_lto.cx7_gcp_c2s60_4g
19769	215660	70	0.5	53030.8	572.8	0.000	0.002	2.682	29.669	675949	66.2	3.134	92	179.6	275.0	0.0	0.087	10660	8950	400m.pg147_o3_native_lto.cx7_gcp_c2s60_4g
19769	214804	79	0.5	53224.3	574.5	0.000	0.002	2.692	29.760	674123	66.2	3.138	92	179.6	275.1	0.0	0.077	10617	8954	400m.pg151_o3_native_lto.cx7_gcp_c2s60_4g
19769	217247	69	0.4	53026.7	573.4	0.000	0.002	2.682	29.699	678228	66.3	3.122	92	179.6	274.9	0.0	0.076	10692	8949	400m.pg152_o3_native_lto.cx7_gcp_c2s60_4g
l.i0
l.i0: load without secondary indexes
Performance metrics for all DBMS, not just the ones listed above. Some are normalized by throughput, others are not. Legend for results is here.
ips	qps	rps	rmbps	wps	wmbps	rpq	rkbpq	wpi	wkbpi	csps	cpups	cspq	cpupq	dbgb1	dbgb2	rss	maxop	p50	p99	tag
1449275	0	0	0.0	10238.0	591.5	0.000	0.000	0.007	0.418	236176	60.6	0.163	13	38.3	103.2	NA	0.535	81110	31865	400m.pg1119_o3_native_lto.cx7_gcp_c2s60_4g
1428571	0	0	0.0	11173.6	595.5	0.000	0.000	0.008	0.427	237209	60.5	0.166	13	38.3	103.2	NA	0.386	78713	27069	400m.pg1214_o3_native_lto.cx7_gcp_c2s60_4g
1465201	0	0	0.0	10376.0	609.5	0.000	0.000	0.007	0.426	225384	60.1	0.154	12	38.3	103.2	NA	0.516	83408	21676	400m.pg1310_o3_native_lto.cx7_gcp_c2s60_4g
1428571	0	0	0.0	10099.1	593.4	0.000	0.000	0.007	0.425	224993	59.6	0.157	13	38.3	103.2	NA	0.621	81411	24773	400m.pg147_o3_native_lto.cx7_gcp_c2s60_4g
1454545	0	0	0.0	10210.5	603.1	0.000	0.000	0.007	0.425	229062	59.7	0.157	12	38.3	103.2	NA	0.559	81410	19579	400m.pg151_o3_native_lto.cx7_gcp_c2s60_4g
1459854	0	0	0.0	10345.9	608.9	0.000	0.000	0.007	0.427	239434	60.5	0.164	12	38.3	103.2	NA	0.682	81711	31365	400m.pg152_o3_native_lto.cx7_gcp_c2s60_4g
l.x
l.x: create secondary indexes
Performance metrics for all DBMS, not just the ones listed above. Some are normalized by throughput, others are not. Legend for results is here.
ips	qps	rps	rmbps	wps	wmbps	rpq	rkbpq	wpi	wkbpi	csps	cpups	cspq	cpupq	dbgb1	dbgb2	rss	maxop	p50	p99	tag
2273295	0	0	0.0	4578.5	890.1	0.000	0.000	0.002	0.401	116776	22.1	0.051	3	73.5	178.1	NA	0.021	NA	NA	400m.pg1119_o3_native_lto.cx7_gcp_c2s60_4g
2312717	0	0	0.0	8454.5	895.3	0.000	0.000	0.004	0.396	131153	23.0	0.057	3	73.5	180.9	0.0	0.042	NA	NA	400m.pg1214_o3_native_lto.cx7_gcp_c2s60_4g
2516352	0	0	0.0	3980.1	894.9	0.000	0.000	0.002	0.364	101472	23.9	0.040	3	73.5	174.7	NA	0.240	NA	NA	400m.pg1310_o3_native_lto.cx7_gcp_c2s60_4g
2247753	0	0	0.0	5576.0	888.4	0.000	0.000	0.002	0.405	117325	22.6	0.052	3	73.5	183.4	NA	0.108	NA	NA	400m.pg147_o3_native_lto.cx7_gcp_c2s60_4g
2198352	0	0	0.0	5809.6	895.1	0.000	0.000	0.003	0.417	117662	21.9	0.054	3	73.5	185.6	NA	0.051	NA	NA	400m.pg151_o3_native_lto.cx7_gcp_c2s60_4g
2260452	0	0	0.0	5437.6	869.0	0.000	0.000	0.002	0.394	114595	22.2	0.051	3	73.5	183.4	NA	0.071	NA	NA	400m.pg152_o3_native_lto.cx7_gcp_c2s60_4g
l.i1
l.i1: continue load after secondary indexes created
Performance metrics for all DBMS, not just the ones listed above. Some are normalized by throughput, others are not. Legend for results is here.
ips	qps	rps	rmbps	wps	wmbps	rpq	rkbpq	wpi	wkbpi	csps	cpups	cspq	cpupq	dbgb1	dbgb2	rss	maxop	p50	p99	tag
152964	0	61	0.6	47588.7	1321.2	0.000	0.004	0.311	8.844	163384	41.4	1.068	81	165.8	269.6	NA	0.722	8341	849	400m.pg1119_o3_native_lto.cx7_gcp_c2s60_4g
149198	0	110	1.2	49821.6	1328.7	0.001	0.008	0.334	9.120	167777	39.8	1.125	80	163.1	274.1	0.0	0.724	7791	750	400m.pg1214_o3_native_lto.cx7_gcp_c2s60_4g
146897	0	63	0.6	48897.1	1325.9	0.000	0.004	0.333	9.243	169160	38.8	1.152	79	163.3	279.1	NA	0.882	7691	699	400m.pg1310_o3_native_lto.cx7_gcp_c2s60_4g
151114	0	577	3.6	48741.0	1317.6	0.004	0.024	0.323	8.929	157567	39.9	1.043	79	163.3	302.9	NA	1.055	7647	949	400m.pg147_o3_native_lto.cx7_gcp_c2s60_4g
153315	0	554	3.3	48017.3	1314.6	0.004	0.022	0.313	8.780	166626	40.1	1.087	78	163.3	304.0	NA	0.962	7744	899	400m.pg151_o3_native_lto.cx7_gcp_c2s60_4g
150489	0	563	3.3	48282.5	1318.0	0.004	0.022	0.321	8.968	162824	39.7	1.082	79	163.3	302.7	NA	0.733	7741	899	400m.pg152_o3_native_lto.cx7_gcp_c2s60_4g
q100.1
q100.1: range queries with 100 insert/s per client
Performance metrics for all DBMS, not just the ones listed above. Some are normalized by throughput, others are not. Legend for results is here.
ips	qps	rps	rmbps	wps	wmbps	rpq	rkbpq	wpi	wkbpi	csps	cpups	cspq	cpupq	dbgb1	dbgb2	rss	maxop	p50	p99	tag
1977	185303	70	0.5	6328.9	71.6	0.000	0.003	3.201	37.074	660345	63.2	3.564	102	166.6	264.7	0.0	0.137	9238	8838	400m.pg1119_o3_native_lto.cx7_gcp_c2s60_4g
1976	194186	7	0.0	6299.0	75.5	0.000	0.000	3.188	39.152	689542	62.9	3.551	97	163.6	276.9	0.0	0.212	9605	9174	400m.pg1214_o3_native_lto.cx7_gcp_c2s60_4g
1976	199374	245	1.9	6287.9	73.8	0.001	0.010	3.182	38.250	706945	62.6	3.546	94	163.9	254.4	0.0	0.189	9925	9445	400m.pg1310_o3_native_lto.cx7_gcp_c2s60_4g
1976	193581	182	1.2	6281.3	73.5	0.001	0.006	3.179	38.079	689675	62.9	3.563	97	163.9	266.1	0.0	0.338	9589	9190	400m.pg147_o3_native_lto.cx7_gcp_c2s60_4g
1976	193608	161	1.0	6279.6	72.9	0.001	0.005	3.178	37.762	689550	62.7	3.562	97	163.9	264.6	0.0	0.372	9526	9142	400m.pg151_o3_native_lto.cx7_gcp_c2s60_4g
1976	194594	187	1.2	6285.5	72.7	0.001	0.006	3.181	37.702	693772	62.6	3.565	97	163.9	266.4	0.0	0.355	9637	9254	400m.pg152_o3_native_lto.cx7_gcp_c2s60_4g
q500.1
q500.1: range queries with 500 insert/s per client
Performance metrics for all DBMS, not just the ones listed above. Some are normalized by throughput, others are not. Legend for results is here.
ips	qps	rps	rmbps	wps	wmbps	rpq	rkbpq	wpi	wkbpi	csps	cpups	cspq	cpupq	dbgb1	dbgb2	rss	maxop	p50	p99	tag
9885	201176	36	0.4	29917.6	325.4	0.000	0.002	3.027	33.709	663005	64.9	3.296	97	171.6	248.7	0.0	0.152	9909	8838	400m.pg1119_o3_native_lto.cx7_gcp_c2s60_4g
9885	210675	114	0.7	29711.6	324.7	0.001	0.004	3.006	33.641	692274	65.0	3.286	93	167.1	252.1	0.0	0.068	10261	9186	400m.pg1214_o3_native_lto.cx7_gcp_c2s60_4g
9885	217362	3	0.0	29418.6	321.3	0.000	0.000	2.976	33.284	708491	65.0	3.260	90	167.5	240.4	0.0	0.065	10708	9477	400m.pg1310_o3_native_lto.cx7_gcp_c2s60_4g
9890	211679	7	0.0	29477.1	327.3	0.000	0.000	2.980	33.885	694221	65.0	3.280	92	167.4	252.0	0.0	0.070	10441	9289	400m.pg147_o3_native_lto.cx7_gcp_c2s60_4g
9885	211192	10	0.1	29498.3	327.4	0.000	0.000	2.984	33.919	694193	64.9	3.287	92	167.4	251.4	0.0	0.094	10293	9146	400m.pg151_o3_native_lto.cx7_gcp_c2s60_4g
9885	212687	8	0.1	29486.0	327.2	0.000	0.000	2.983	33.897	697647	64.9	3.280	92	167.4	251.9	0.0	0.158	10372	9193	400m.pg152_o3_native_lto.cx7_gcp_c2s60_4g
q1000.1
q1000.1: range queries with 1000 insert/s per client
Performance metrics for all DBMS, not just the ones listed above. Some are normalized by throughput, others are not. Legend for results is here.
ips	qps	rps	rmbps	wps	wmbps	rpq	rkbpq	wpi	wkbpi	csps	cpups	cspq	cpupq	dbgb1	dbgb2	rss	maxop	p50	p99	tag
19769	204268	59	0.6	53514.2	578.7	0.000	0.003	2.707	29.977	639399	66.5	3.130	98	185.4	264.5	0.0	0.090	10165	8583	400m.pg1119_o3_native_lto.cx7_gcp_c2s60_4g
19769	215760	197	1.5	53061.5	573.0	0.001	0.007	2.684	29.678	673224	66.4	3.120	92	179.3	260.3	0.0	0.080	10676	8902	400m.pg1214_o3_native_lto.cx7_gcp_c2s60_4g
19769	221057	65	0.4	53093.1	582.9	0.000	0.002	2.686	30.195	687652	66.4	3.111	90	179.6	259.5	0.0	0.134	11012	9260	400m.pg1310_o3_native_lto.cx7_gcp_c2s60_4g
19769	215660	70	0.5	53030.8	572.8	0.000	0.002	2.682	29.669	675949	66.2	3.134	92	179.6	275.0	0.0	0.087	10660	8950	400m.pg147_o3_native_lto.cx7_gcp_c2s60_4g
19769	214804	79	0.5	53224.3	574.5	0.000	0.002	2.692	29.760	674123	66.2	3.138	92	179.6	275.1	0.0	0.077	10617	8954	400m.pg151_o3_native_lto.cx7_gcp_c2s60_4g
19769	217247	69	0.4	53026.7	573.4	0.000	0.002	2.682	29.699	678228	66.3	3.122	92	179.6	274.9	0.0	0.076	10692	8949	400m.pg152_o3_native_lto.cx7_gcp_c2s60_4g
l.i0
- l.i0: load without secondary indexes
- Legend for results is here.
- Each entry lists the percentage of responses that fit in that bucket (slower than max time for previous bucket, faster than min time for next bucket).
Insert response time histogram
256us	1ms	4ms	16ms	64ms	256ms	1s	4s	16s	gt	max	tag
0.000	62.982	35.987	0.960	0.038	0.029	0.004	0.000	0.000	0.000	0.535	pg1119_o3_native_lto.cx7_gcp_c2s60_4g
0.000	61.435	37.466	1.020	0.044	0.033	0.002	0.000	0.000	0.000	0.386	pg1214_o3_native_lto.cx7_gcp_c2s60_4g
0.000	63.716	35.276	0.945	0.028	0.025	0.010	0.000	0.000	0.000	0.516	pg1310_o3_native_lto.cx7_gcp_c2s60_4g
0.000	61.893	37.125	0.918	0.028	0.028	0.007	0.000	0.000	0.000	0.621	pg147_o3_native_lto.cx7_gcp_c2s60_4g
0.000	62.747	36.260	0.920	0.039	0.023	0.010	0.000	0.000	0.000	0.559	pg151_o3_native_lto.cx7_gcp_c2s60_4g
0.000	62.755	36.269	0.910	0.035	0.025	0.006	0.000	0.000	0.000	0.682	pg152_o3_native_lto.cx7_gcp_c2s60_4g
l.x
- l.x: create secondary indexes
- Legend for results is here.
- Each entry lists the percentage of responses that fit in that bucket (slower than max time for previous bucket, faster than min time for next bucket).
TODO - determine whether there is data for create index response time
l.i1
- l.i1: continue load after secondary indexes created
- Legend for results is here.
- Each entry lists the percentage of responses that fit in that bucket (slower than max time for previous bucket, faster than min time for next bucket).
Insert response time histogram
256us	1ms	4ms	16ms	64ms	256ms	1s	4s	16s	gt	max	tag
0.000	0.000	64.487	29.527	5.101	0.863	0.023	0.000	0.000	0.000	0.722	pg1119_o3_native_lto.cx7_gcp_c2s60_4g
0.000	0.000	67.264	26.287	5.471	0.943	0.036	0.000	0.000	0.000	0.724	pg1214_o3_native_lto.cx7_gcp_c2s60_4g
0.000	0.000	68.106	25.263	5.612	0.979	0.041	0.000	0.000	0.000	0.882	pg1310_o3_native_lto.cx7_gcp_c2s60_4g
0.000	0.000	65.248	28.611	5.360	0.741	0.040	nonzero	0.000	0.000	1.055	pg147_o3_native_lto.cx7_gcp_c2s60_4g
0.000	0.000	65.608	28.218	5.416	0.725	0.033	0.000	0.000	0.000	0.962	pg151_o3_native_lto.cx7_gcp_c2s60_4g
0.000	0.000	64.408	29.067	5.756	0.742	0.028	0.000	0.000	0.000	0.733	pg152_o3_native_lto.cx7_gcp_c2s60_4g
q100.1
- q100.1: range queries with 100 insert/s per client
- Legend for results is here.
- Each entry lists the percentage of responses that fit in that bucket (slower than max time for previous bucket, faster than min time for next bucket).
Query response time histogram
256us	1ms	4ms	16ms	64ms	256ms	1s	4s	16s	gt	max	tag
99.949	0.042	0.008	0.001	nonzero	nonzero	0.000	0.000	0.000	0.000	0.137	pg1119_o3_native_lto.cx7_gcp_c2s60_4g
99.962	0.030	0.008	0.001	nonzero	nonzero	0.000	0.000	0.000	0.000	0.212	pg1214_o3_native_lto.cx7_gcp_c2s60_4g
99.924	0.068	0.008	0.001	nonzero	nonzero	0.000	0.000	0.000	0.000	0.189	pg1310_o3_native_lto.cx7_gcp_c2s60_4g
99.953	0.038	0.007	0.001	nonzero	nonzero	nonzero	0.000	0.000	0.000	0.338	pg147_o3_native_lto.cx7_gcp_c2s60_4g
99.951	0.041	0.007	0.001	nonzero	nonzero	nonzero	0.000	0.000	0.000	0.372	pg151_o3_native_lto.cx7_gcp_c2s60_4g
99.954	0.038	0.007	0.001	nonzero	nonzero	nonzero	0.000	0.000	0.000	0.355	pg152_o3_native_lto.cx7_gcp_c2s60_4g
Insert response time histogram
256us	1ms	4ms	16ms	64ms	256ms	1s	4s	16s	gt	max	tag
0.000	0.000	94.976	4.386	0.637	0.000	0.000	0.000	0.000	0.000	0.061	pg1119_o3_native_lto.cx7_gcp_c2s60_4g
0.000	0.000	93.617	3.256	3.039	0.089	0.000	0.000	0.000	0.000	0.099	pg1214_o3_native_lto.cx7_gcp_c2s60_4g
0.000	0.000	94.221	5.294	0.485	0.000	0.000	0.000	0.000	0.000	0.038	pg1310_o3_native_lto.cx7_gcp_c2s60_4g
0.000	0.000	94.968	4.568	0.462	0.001	0.000	0.000	0.000	0.000	0.090	pg147_o3_native_lto.cx7_gcp_c2s60_4g
0.000	0.000	95.942	3.729	0.311	0.017	0.001	0.000	0.000	0.000	0.292	pg151_o3_native_lto.cx7_gcp_c2s60_4g
0.000	0.000	96.300	3.357	0.343	0.000	0.000	0.000	0.000	0.000	0.041	pg152_o3_native_lto.cx7_gcp_c2s60_4g
q500.1
- q500.1: range queries with 500 insert/s per client
- Legend for results is here.
- Each entry lists the percentage of responses that fit in that bucket (slower than max time for previous bucket, faster than min time for next bucket).
Query response time histogram
256us	1ms	4ms	16ms	64ms	256ms	1s	4s	16s	gt	max	tag
99.813	0.146	0.038	0.004	nonzero	nonzero	0.000	0.000	0.000	0.000	0.152	pg1119_o3_native_lto.cx7_gcp_c2s60_4g
99.827	0.133	0.037	0.003	nonzero	nonzero	0.000	0.000	0.000	0.000	0.068	pg1214_o3_native_lto.cx7_gcp_c2s60_4g
99.836	0.126	0.035	0.003	nonzero	nonzero	0.000	0.000	0.000	0.000	0.065	pg1310_o3_native_lto.cx7_gcp_c2s60_4g
99.830	0.131	0.036	0.003	nonzero	nonzero	0.000	0.000	0.000	0.000	0.070	pg147_o3_native_lto.cx7_gcp_c2s60_4g
99.830	0.130	0.036	0.003	nonzero	nonzero	0.000	0.000	0.000	0.000	0.094	pg151_o3_native_lto.cx7_gcp_c2s60_4g
99.831	0.130	0.036	0.003	nonzero	nonzero	0.000	0.000	0.000	0.000	0.158	pg152_o3_native_lto.cx7_gcp_c2s60_4g
Insert response time histogram
256us	1ms	4ms	16ms	64ms	256ms	1s	4s	16s	gt	max	tag
0.000	0.000	35.125	38.668	25.689	0.518	0.000	0.000	0.000	0.000	0.230	pg1119_o3_native_lto.cx7_gcp_c2s60_4g
0.000	0.000	34.020	38.824	26.617	0.540	0.000	0.000	0.000	0.000	0.219	pg1214_o3_native_lto.cx7_gcp_c2s60_4g
0.000	0.000	34.207	40.124	25.217	0.453	0.000	0.000	0.000	0.000	0.228	pg1310_o3_native_lto.cx7_gcp_c2s60_4g
0.000	0.000	35.543	35.860	27.978	0.619	0.000	0.000	0.000	0.000	0.248	pg147_o3_native_lto.cx7_gcp_c2s60_4g
0.000	0.000	35.132	36.447	27.806	0.616	0.000	0.000	0.000	0.000	0.247	pg151_o3_native_lto.cx7_gcp_c2s60_4g
0.000	0.000	34.687	36.780	27.927	0.601	0.005	0.000	0.000	0.000	0.318	pg152_o3_native_lto.cx7_gcp_c2s60_4g
q1000.1
- q1000.1: range queries with 1000 insert/s per client
- Legend for results is here.
- Each entry lists the percentage of responses that fit in that bucket (slower than max time for previous bucket, faster than min time for next bucket).
Query response time histogram
256us	1ms	4ms	16ms	64ms	256ms	1s	4s	16s	gt	max	tag
99.481	0.411	0.098	0.010	0.001	nonzero	0.000	0.000	0.000	0.000	0.090	pg1119_o3_native_lto.cx7_gcp_c2s60_4g
99.475	0.417	0.099	0.009	nonzero	nonzero	0.000	0.000	0.000	0.000	0.080	pg1214_o3_native_lto.cx7_gcp_c2s60_4g
99.493	0.400	0.099	0.009	nonzero	nonzero	0.000	0.000	0.000	0.000	0.134	pg1310_o3_native_lto.cx7_gcp_c2s60_4g
99.480	0.410	0.100	0.010	nonzero	nonzero	0.000	0.000	0.000	0.000	0.087	pg147_o3_native_lto.cx7_gcp_c2s60_4g
99.475	0.415	0.100	0.009	0.001	nonzero	0.000	0.000	0.000	0.000	0.077	pg151_o3_native_lto.cx7_gcp_c2s60_4g
99.492	0.402	0.097	0.009	nonzero	nonzero	0.000	0.000	0.000	0.000	0.076	pg152_o3_native_lto.cx7_gcp_c2s60_4g
Insert response time histogram
256us	1ms	4ms	16ms	64ms	256ms	1s	4s	16s	gt	max	tag
0.000	0.000	36.910	44.374	17.497	1.213	0.006	0.000	0.000	0.000	0.489	pg1119_o3_native_lto.cx7_gcp_c2s60_4g
0.000	0.000	28.914	50.875	19.222	0.986	0.003	0.000	0.000	0.000	0.289	pg1214_o3_native_lto.cx7_gcp_c2s60_4g
0.000	0.000	26.897	50.537	21.245	1.319	0.001	0.000	0.000	0.000	0.337	pg1310_o3_native_lto.cx7_gcp_c2s60_4g
0.000	0.000	30.221	50.561	18.447	0.772	0.000	0.000	0.000	0.000	0.249	pg147_o3_native_lto.cx7_gcp_c2s60_4g
0.000	0.000	29.946	50.558	18.626	0.870	0.000	0.000	0.000	0.000	0.250	pg151_o3_native_lto.cx7_gcp_c2s60_4g
0.000	0.000	29.548	50.920	18.667	0.865	0.000	0.000	0.000	0.000	0.205	pg152_o3_native_lto.cx7_gcp_c2s60_4g