Introduction
This is a report for the insert benchmark with 400M docs and 20 client(s). It is generated by scripts (bash, awk, sed) and Tufte might not be impressed. An overview of the insert benchmark is here and a short update is here. Below, by DBMS, I mean DBMS+version.config. An example is my8020.c10b40 where my means MySQL, 8020 is version 8.0.20 and c10b40 is the name for the configuration file.
The test server is c2-standard-60 from GCP with 30 cores, hyperthreads disabled, 240G RAM and 3T of NVMe (XFS with RAID0 over 8 devices). The benchmark was run with 20 clients and there were 1 or 2 connections per client (1 for queries, 1 for inserts). It uses 1 table. It loads 400M rows without secondary indexes, creates secondary indexes, loads another 400M rows per table then does 3 read+write tests for one hour each that do queries as fast as possible with 100, 500 and then 1000 writes/second/client concurrent with the queries. The database is cached by the storage engine and the only IO is for writes. Clients and the DBMS share one server. The per-database configs are in the per-database subdirectories here.
The tested DBMS are:
- pg151_def.cx7a_gcp_c2s60 - Postgres 15.1, the cx7a_gcp_c2s60 config and the build used: -O2
- pg151_o2_nofp.cx7a_gcp_c2s60 - Postgres 15.1, the cx7a_gcp_c2s60 config and the build used: -O2 -no-omit-frame-pointer
- pg151_o3.cx7a_gcp_c2s60 - Postgres 15.1, the cx7a_gcp_c2s60 config and the build used: -O3
- pg151_o3_native.cx7a_gcp_c2s60 - Postgres 15.1, the cx7a_gcp_c2s60 config and the build used: -O3 -march=native -mtune=native
- pg151_o3_native_lto.cx7a_gcp_c2s60 - Postgres 15.1, the cx7a_gcp_c2s60 config and the build used: -O3 -march=native -mtune=native and -flto
Contents
- Summary
- l.i0: load without secondary indexes
- l.x: create secondary indexes
- l.i1: continue load after secondary indexes created
- q100.1: range queries with 100 insert/s per client
- q500.1: range queries with 500 insert/s per client
- q1000.1: range queries with 1000 insert/s per client
Summary
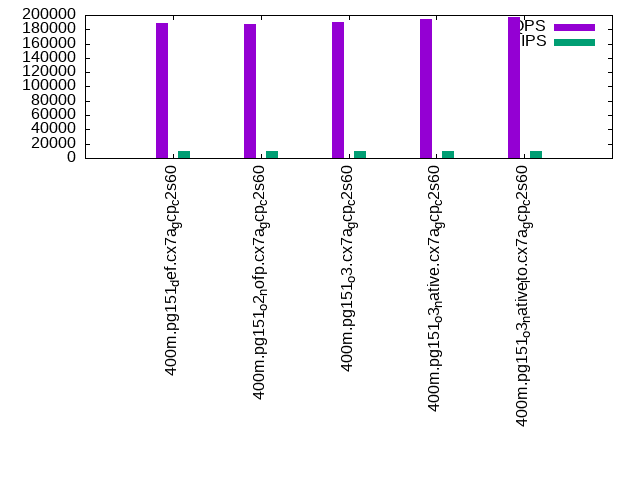
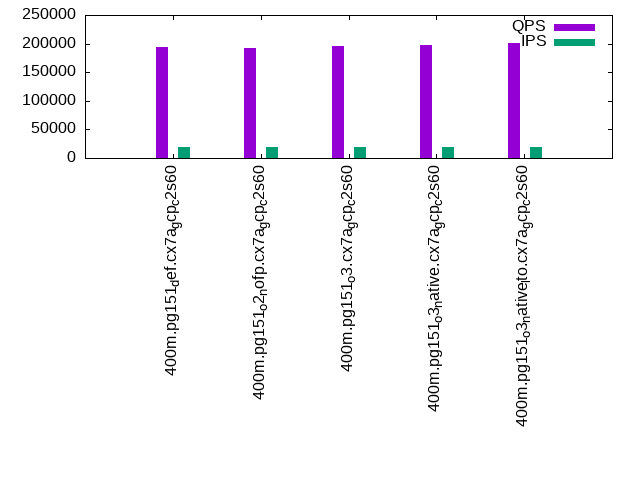
The numbers are inserts/s for l.i0 and l.i1, indexed docs (or rows) /s for l.x and queries/s for q*.2. The values are the average rate over the entire test for inserts (IPS) and queries (QPS). The range of values for IPS and QPS is split into 3 parts: bottom 25%, middle 50%, top 25%. Values in the bottom 25% have a red background, values in the top 25% have a green background and values in the middle have no color. A gray background is used for values that can be ignored because the DBMS did not sustain the target insert rate. Red backgrounds are not used when the minimum value is within 80% of the max value.
| dbms | l.i0 | l.x | l.i1 | q100.1 | q500.1 | q1000.1 |
|---|---|---|---|---|---|---|
| 400m.pg151_def.cx7a_gcp_c2s60 | 1058201 | 327414 | 387973 | 188814 | 188582 | 194475 |
| 400m.pg151_o2_nofp.cx7a_gcp_c2s60 | 1052632 | 326879 | 394477 | 184700 | 187236 | 191566 |
| 400m.pg151_o3.cx7a_gcp_c2s60 | 1092896 | 329300 | 393314 | 188759 | 190465 | 194991 |
| 400m.pg151_o3_native.cx7a_gcp_c2s60 | 1069519 | 337352 | 385356 | 193190 | 194181 | 196975 |
| 400m.pg151_o3_native_lto.cx7a_gcp_c2s60 | 1092896 | 333695 | 394477 | 195775 | 196554 | 201918 |
This table has relative throughput, throughput for the DBMS relative to the DBMS in the first line, using the absolute throughput from the previous table.
| dbms | l.i0 | l.x | l.i1 | q100.1 | q500.1 | q1000.1 |
|---|---|---|---|---|---|---|
| 400m.pg151_def.cx7a_gcp_c2s60 | 1.00 | 1.00 | 1.00 | 1.00 | 1.00 | 1.00 |
| 400m.pg151_o2_nofp.cx7a_gcp_c2s60 | 0.99 | 1.00 | 1.02 | 0.98 | 0.99 | 0.99 |
| 400m.pg151_o3.cx7a_gcp_c2s60 | 1.03 | 1.01 | 1.01 | 1.00 | 1.01 | 1.00 |
| 400m.pg151_o3_native.cx7a_gcp_c2s60 | 1.01 | 1.03 | 0.99 | 1.02 | 1.03 | 1.01 |
| 400m.pg151_o3_native_lto.cx7a_gcp_c2s60 | 1.03 | 1.02 | 1.02 | 1.04 | 1.04 | 1.04 |
This lists the average rate of inserts/s for the tests that do inserts concurrent with queries. For such tests the query rate is listed in the table above. The read+write tests are setup so that the insert rate should match the target rate every second. Cells that are not at least 95% of the target have a red background to indicate a failure to satisfy the target.
| dbms | q100.1 | q500.1 | q1000.1 |
|---|---|---|---|
| pg151_def.cx7a_gcp_c2s60 | 1976 | 9885 | 19769 |
| pg151_o2_nofp.cx7a_gcp_c2s60 | 1976 | 9885 | 19769 |
| pg151_o3.cx7a_gcp_c2s60 | 1976 | 9885 | 19769 |
| pg151_o3_native.cx7a_gcp_c2s60 | 1977 | 9885 | 19769 |
| pg151_o3_native_lto.cx7a_gcp_c2s60 | 1976 | 9890 | 19769 |
| target | 2000 | 10000 | 20000 |
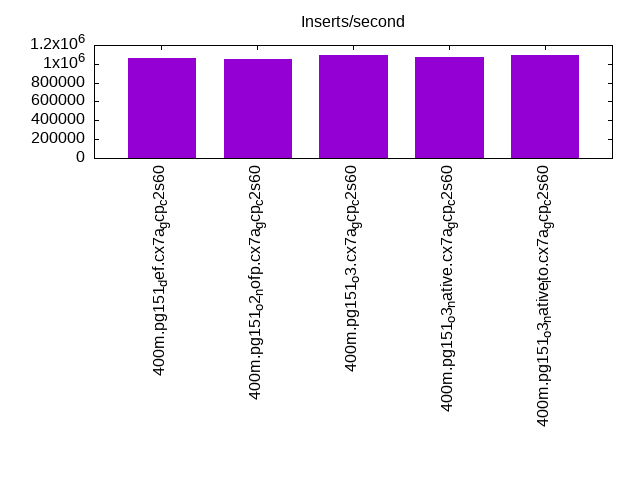
l.i0
l.i0: load without secondary indexes. Graphs for performance per 1-second interval are here.
Average throughput:
Insert response time histogram: each cell has the percentage of responses that take <= the time in the header and max is the max response time in seconds. For the max column values in the top 25% of the range have a red background and in the bottom 25% of the range have a green background. The red background is not used when the min value is within 80% of the max value.
| dbms | 256us | 1ms | 4ms | 16ms | 64ms | 256ms | 1s | 4s | 16s | gt | max |
|---|---|---|---|---|---|---|---|---|---|---|---|
| pg151_def.cx7a_gcp_c2s60 | 17.359 | 79.116 | 3.468 | 0.020 | 0.027 | 0.010 | 0.991 | ||||
| pg151_o2_nofp.cx7a_gcp_c2s60 | 15.731 | 80.523 | 3.661 | 0.046 | 0.030 | 0.009 | 0.615 | ||||
| pg151_o3.cx7a_gcp_c2s60 | 20.346 | 76.465 | 3.134 | 0.013 | 0.033 | 0.010 | 0.741 | ||||
| pg151_o3_native.cx7a_gcp_c2s60 | 19.622 | 76.740 | 3.584 | 0.017 | 0.026 | 0.011 | 0.750 | ||||
| pg151_o3_native_lto.cx7a_gcp_c2s60 | 24.912 | 71.498 | 3.535 | 0.016 | 0.029 | 0.011 | 0.610 |
Performance metrics for the DBMS listed above. Some are normalized by throughput, others are not. Legend for results is here.
ips	qps	rps	rmbps	wps	wmbps	rpq	rkbpq	wpi	wkbpi	csps	cpups	cspq	cpupq	dbgb1	dbgb2	rss	maxop	p50	p99	tag
1058201	0	0	0.0	1644.7	421.3	0.000	0.000	0.002	0.408	325574	57.5	0.308	16	43.0	117.3	NA	0.991	58735	18387	400m.pg151_def.cx7a_gcp_c2s60
1052632	0	0	0.0	1712.6	440.5	0.000	0.000	0.002	0.428	291249	57.5	0.277	16	43.0	122.2	0.0	0.615	59033	16090	400m.pg151_o2_nofp.cx7a_gcp_c2s60
1092896	0	0	0.0	1662.3	422.9	0.000	0.000	0.002	0.396	294405	58.0	0.269	16	43.0	115.2	NA	0.741	60333	15183	400m.pg151_o3.cx7a_gcp_c2s60
1069519	0	0	0.0	1626.3	421.3	0.000	0.000	0.002	0.403	328228	57.0	0.307	16	43.0	116.8	NA	0.750	59035	15389	400m.pg151_o3_native.cx7a_gcp_c2s60
1092896	0	0	0.0	1633.2	419.1	0.000	0.000	0.001	0.393	345431	57.0	0.316	16	43.0	115.1	NA	0.610	60333	19078	400m.pg151_o3_native_lto.cx7a_gcp_c2s60
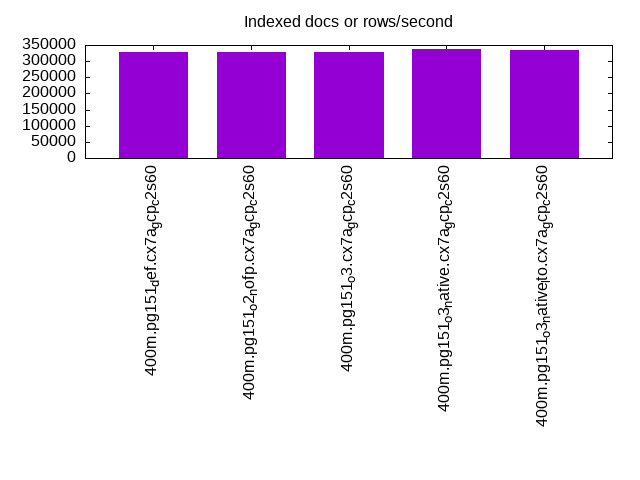
l.x
l.x: create secondary indexes.
Average throughput:
Performance metrics for the DBMS listed above. Some are normalized by throughput, others are not. Legend for results is here.
ips	qps	rps	rmbps	wps	wmbps	rpq	rkbpq	wpi	wkbpi	csps	cpups	cspq	cpupq	dbgb1	dbgb2	rss	maxop	p50	p99	tag
327414	0	0	0.0	414.9	97.0	0.000	0.000	0.001	0.303	1163	3.0	0.004	3	78.3	152.6	0.0	0.002	NA	NA	400m.pg151_def.cx7a_gcp_c2s60
326879	0	0	0.0	406.1	95.1	0.000	0.000	0.001	0.298	1197	3.0	0.004	3	78.3	157.5	0.0	0.002	NA	NA	400m.pg151_o2_nofp.cx7a_gcp_c2s60
329300	0	0	0.0	438.0	109.5	0.000	0.000	0.001	0.340	1550	3.1	0.005	3	78.3	152.3	0.0	0.014	NA	NA	400m.pg151_o3.cx7a_gcp_c2s60
337352	0	0	0.0	417.8	99.2	0.000	0.000	0.001	0.301	1185	3.0	0.004	3	78.3	152.7	0.0	0.025	NA	NA	400m.pg151_o3_native.cx7a_gcp_c2s60
333695	0	0	0.0	437.2	108.2	0.000	0.000	0.001	0.332	1078	3.0	0.003	3	78.3	152.4	0.0	0.019	NA	NA	400m.pg151_o3_native_lto.cx7a_gcp_c2s60
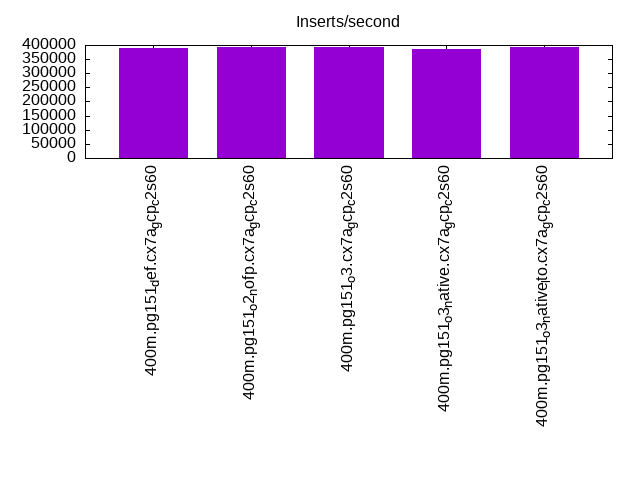
l.i1
l.i1: continue load after secondary indexes created. Graphs for performance per 1-second interval are here.
Average throughput:
Insert response time histogram: each cell has the percentage of responses that take <= the time in the header and max is the max response time in seconds. For the max column values in the top 25% of the range have a red background and in the bottom 25% of the range have a green background. The red background is not used when the min value is within 80% of the max value.
| dbms | 256us | 1ms | 4ms | 16ms | 64ms | 256ms | 1s | 4s | 16s | gt | max |
|---|---|---|---|---|---|---|---|---|---|---|---|
| pg151_def.cx7a_gcp_c2s60 | 94.531 | 4.663 | 0.759 | 0.035 | 0.011 | nonzero | 1.859 | ||||
| pg151_o2_nofp.cx7a_gcp_c2s60 | 94.679 | 4.629 | 0.649 | 0.028 | 0.014 | 0.001 | 1.581 | ||||
| pg151_o3.cx7a_gcp_c2s60 | 94.588 | 4.572 | 0.792 | 0.031 | 0.016 | nonzero | 1.540 | ||||
| pg151_o3_native.cx7a_gcp_c2s60 | 94.423 | 4.725 | 0.807 | 0.030 | 0.016 | 0.968 | |||||
| pg151_o3_native_lto.cx7a_gcp_c2s60 | 94.534 | 4.614 | 0.808 | 0.030 | 0.014 | 0.911 |
Performance metrics for the DBMS listed above. Some are normalized by throughput, others are not. Legend for results is here.
ips	qps	rps	rmbps	wps	wmbps	rpq	rkbpq	wpi	wkbpi	csps	cpups	cspq	cpupq	dbgb1	dbgb2	rss	maxop	p50	p99	tag
387973	0	1902	13.8	2482.5	455.1	0.005	0.036	0.006	1.201	295237	54.0	0.761	42	170.2	333.6	0.0	1.859	23175	1949	400m.pg151_def.cx7a_gcp_c2s60
394477	0	1759	12.9	2428.6	447.9	0.004	0.033	0.006	1.163	253781	55.4	0.643	42	170.2	327.0	NA	1.581	23482	2548	400m.pg151_o2_nofp.cx7a_gcp_c2s60
393314	0	2028	14.6	2412.0	455.2	0.005	0.038	0.006	1.185	264858	53.9	0.673	41	170.2	329.1	NA	1.540	23824	1998	400m.pg151_o3.cx7a_gcp_c2s60
385356	0	1665	12.0	2365.5	432.4	0.004	0.032	0.006	1.149	299730	53.2	0.778	41	170.2	326.8	NA	0.968	23275	1898	400m.pg151_o3_native.cx7a_gcp_c2s60
394477	0	1979	14.8	2424.2	444.5	0.005	0.039	0.006	1.154	301611	52.8	0.765	40	170.2	326.0	NA	0.911	24024	2048	400m.pg151_o3_native_lto.cx7a_gcp_c2s60
q100.1
q100.1: range queries with 100 insert/s per client. Graphs for performance per 1-second interval are here.
Average throughput:
Query response time histogram: each cell has the percentage of responses that take <= the time in the header and max is the max response time in seconds. For max values in the top 25% of the range have a red background and in the bottom 25% of the range have a green background. The red background is not used when the min value is within 80% of the max value.
| dbms | 256us | 1ms | 4ms | 16ms | 64ms | 256ms | 1s | 4s | 16s | gt | max |
|---|---|---|---|---|---|---|---|---|---|---|---|
| pg151_def.cx7a_gcp_c2s60 | 99.967 | 0.026 | 0.006 | 0.001 | nonzero | 0.026 | |||||
| pg151_o2_nofp.cx7a_gcp_c2s60 | 99.964 | 0.029 | 0.006 | 0.001 | nonzero | 0.025 | |||||
| pg151_o3.cx7a_gcp_c2s60 | 99.969 | 0.024 | 0.006 | 0.001 | nonzero | 0.024 | |||||
| pg151_o3_native.cx7a_gcp_c2s60 | 99.971 | 0.022 | 0.006 | 0.001 | nonzero | 0.026 | |||||
| pg151_o3_native_lto.cx7a_gcp_c2s60 | 99.974 | 0.019 | 0.006 | 0.001 | nonzero | 0.024 |
Insert response time histogram: each cell has the percentage of responses that take <= the time in the header and max is the max response time in seconds. For max values in the top 25% of the range have a red background and in the bottom 25% of the range have a green background. The red background is not used when the min value is within 80% of the max value.
| dbms | 256us | 1ms | 4ms | 16ms | 64ms | 256ms | 1s | 4s | 16s | gt | max |
|---|---|---|---|---|---|---|---|---|---|---|---|
| pg151_def.cx7a_gcp_c2s60 | 98.394 | 1.307 | 0.268 | 0.029 | 0.001 | 0.282 | |||||
| pg151_o2_nofp.cx7a_gcp_c2s60 | 97.382 | 2.221 | 0.397 | 0.039 | |||||||
| pg151_o3.cx7a_gcp_c2s60 | 98.547 | 1.261 | 0.192 | 0.035 | |||||||
| pg151_o3_native.cx7a_gcp_c2s60 | 97.988 | 1.699 | 0.307 | 0.007 | 0.069 | ||||||
| pg151_o3_native_lto.cx7a_gcp_c2s60 | 97.812 | 1.815 | 0.372 | 0.056 |
Performance metrics for the DBMS listed above. Some are normalized by throughput, others are not. Legend for results is here.
ips	qps	rps	rmbps	wps	wmbps	rpq	rkbpq	wpi	wkbpi	csps	cpups	cspq	cpupq	dbgb1	dbgb2	rss	maxop	p50	p99	tag
1976	188814	0	0.0	2462.2	68.5	0.000	0.000	1.246	35.522	671024	62.7	3.554	100	171.1	304.9	0.0	0.026	9353	8966	400m.pg151_def.cx7a_gcp_c2s60
1976	184700	1	0.0	2468.1	68.1	0.000	0.000	1.249	35.307	659067	62.8	3.568	102	171.1	304.8	0.0	0.025	9194	8890	400m.pg151_o2_nofp.cx7a_gcp_c2s60
1976	188759	1	0.0	2494.3	64.1	0.000	0.000	1.262	33.247	674281	62.7	3.572	100	171.1	302.4	0.0	0.024	9365	9046	400m.pg151_o3.cx7a_gcp_c2s60
1977	193190	1	0.0	2487.5	63.2	0.000	0.000	1.258	32.739	686573	62.7	3.554	97	171.1	300.0	0.0	0.026	9625	9222	400m.pg151_o3_native.cx7a_gcp_c2s60
1976	195775	1	0.0	2510.3	63.0	0.000	0.000	1.271	32.641	697644	62.9	3.564	96	171.1	310.9	0.0	0.024	9685	9318	400m.pg151_o3_native_lto.cx7a_gcp_c2s60
q500.1
q500.1: range queries with 500 insert/s per client. Graphs for performance per 1-second interval are here.
Average throughput:
Query response time histogram: each cell has the percentage of responses that take <= the time in the header and max is the max response time in seconds. For max values in the top 25% of the range have a red background and in the bottom 25% of the range have a green background. The red background is not used when the min value is within 80% of the max value.
| dbms | 256us | 1ms | 4ms | 16ms | 64ms | 256ms | 1s | 4s | 16s | gt | max |
|---|---|---|---|---|---|---|---|---|---|---|---|
| pg151_def.cx7a_gcp_c2s60 | 99.906 | 0.064 | 0.027 | 0.003 | nonzero | 0.030 | |||||
| pg151_o2_nofp.cx7a_gcp_c2s60 | 99.901 | 0.068 | 0.027 | 0.003 | nonzero | 0.030 | |||||
| pg151_o3.cx7a_gcp_c2s60 | 99.907 | 0.063 | 0.027 | 0.003 | nonzero | 0.034 | |||||
| pg151_o3_native.cx7a_gcp_c2s60 | 99.912 | 0.059 | 0.026 | 0.003 | nonzero | nonzero | 0.272 | ||||
| pg151_o3_native_lto.cx7a_gcp_c2s60 | 99.914 | 0.057 | 0.026 | 0.003 | nonzero | nonzero | 0.120 |
Insert response time histogram: each cell has the percentage of responses that take <= the time in the header and max is the max response time in seconds. For max values in the top 25% of the range have a red background and in the bottom 25% of the range have a green background. The red background is not used when the min value is within 80% of the max value.
| dbms | 256us | 1ms | 4ms | 16ms | 64ms | 256ms | 1s | 4s | 16s | gt | max |
|---|---|---|---|---|---|---|---|---|---|---|---|
| pg151_def.cx7a_gcp_c2s60 | 52.672 | 27.405 | 19.639 | 0.284 | 0.210 | ||||||
| pg151_o2_nofp.cx7a_gcp_c2s60 | 52.032 | 28.335 | 19.355 | 0.274 | 0.005 | 0.418 | |||||
| pg151_o3.cx7a_gcp_c2s60 | 52.909 | 27.675 | 19.168 | 0.249 | 0.190 | ||||||
| pg151_o3_native.cx7a_gcp_c2s60 | 52.710 | 27.735 | 19.282 | 0.267 | 0.006 | 0.386 | |||||
| pg151_o3_native_lto.cx7a_gcp_c2s60 | 52.579 | 27.501 | 19.656 | 0.264 | 0.171 |
Performance metrics for the DBMS listed above. Some are normalized by throughput, others are not. Legend for results is here.
ips	qps	rps	rmbps	wps	wmbps	rpq	rkbpq	wpi	wkbpi	csps	cpups	cspq	cpupq	dbgb1	dbgb2	rss	maxop	p50	p99	tag
9885	188582	0	0.0	4602.1	143.6	0.000	0.000	0.466	14.877	659668	63.8	3.498	101	176.0	260.9	0.0	0.030	9366	8950	400m.pg151_def.cx7a_gcp_c2s60
9885	187236	0	0.0	4603.4	143.2	0.000	0.000	0.466	14.836	653067	63.7	3.488	102	176.0	260.9	0.0	0.030	9238	8790	400m.pg151_o2_nofp.cx7a_gcp_c2s60
9885	190465	0	0.0	4557.9	142.0	0.000	0.000	0.461	14.715	664759	64.0	3.490	101	176.0	260.1	0.0	0.034	9401	8922	400m.pg151_o3.cx7a_gcp_c2s60
9885	194181	0	0.0	4541.7	141.0	0.000	0.000	0.459	14.611	676622	64.0	3.484	99	176.0	259.2	0.0	0.272	9637	9158	400m.pg151_o3_native.cx7a_gcp_c2s60
9890	196554	0	0.0	4560.7	141.6	0.000	0.000	0.461	14.659	686810	64.1	3.494	98	176.0	260.3	0.0	0.120	9813	9350	400m.pg151_o3_native_lto.cx7a_gcp_c2s60
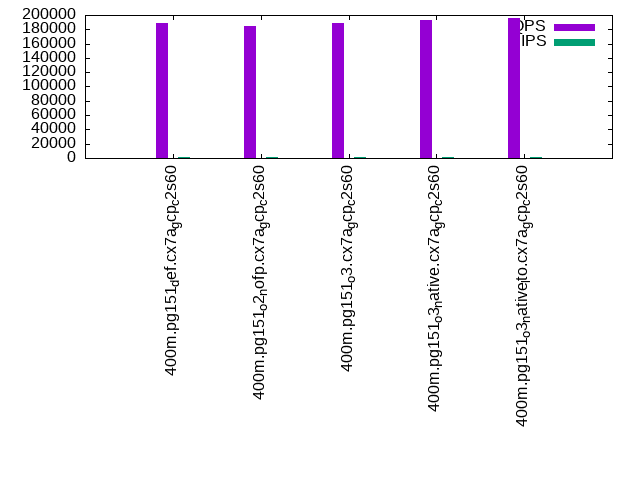
q1000.1
q1000.1: range queries with 1000 insert/s per client. Graphs for performance per 1-second interval are here.
Average throughput:
Query response time histogram: each cell has the percentage of responses that take <= the time in the header and max is the max response time in seconds. For max values in the top 25% of the range have a red background and in the bottom 25% of the range have a green background. The red background is not used when the min value is within 80% of the max value.
| dbms | 256us | 1ms | 4ms | 16ms | 64ms | 256ms | 1s | 4s | 16s | gt | max |
|---|---|---|---|---|---|---|---|---|---|---|---|
| pg151_def.cx7a_gcp_c2s60 | 99.854 | 0.104 | 0.038 | 0.004 | nonzero | 0.035 | |||||
| pg151_o2_nofp.cx7a_gcp_c2s60 | 99.847 | 0.109 | 0.039 | 0.004 | nonzero | 0.050 | |||||
| pg151_o3.cx7a_gcp_c2s60 | 99.853 | 0.105 | 0.038 | 0.004 | nonzero | 0.040 | |||||
| pg151_o3_native.cx7a_gcp_c2s60 | 99.856 | 0.101 | 0.038 | 0.004 | nonzero | 0.031 | |||||
| pg151_o3_native_lto.cx7a_gcp_c2s60 | 99.861 | 0.098 | 0.037 | 0.004 | nonzero | 0.054 |
Insert response time histogram: each cell has the percentage of responses that take <= the time in the header and max is the max response time in seconds. For max values in the top 25% of the range have a red background and in the bottom 25% of the range have a green background. The red background is not used when the min value is within 80% of the max value.
| dbms | 256us | 1ms | 4ms | 16ms | 64ms | 256ms | 1s | 4s | 16s | gt | max |
|---|---|---|---|---|---|---|---|---|---|---|---|
| pg151_def.cx7a_gcp_c2s60 | 60.405 | 26.994 | 12.380 | 0.222 | 0.184 | ||||||
| pg151_o2_nofp.cx7a_gcp_c2s60 | 59.772 | 27.751 | 12.250 | 0.228 | 0.217 | ||||||
| pg151_o3.cx7a_gcp_c2s60 | 60.159 | 27.043 | 12.567 | 0.231 | 0.177 | ||||||
| pg151_o3_native.cx7a_gcp_c2s60 | 60.793 | 26.644 | 12.328 | 0.235 | 0.195 | ||||||
| pg151_o3_native_lto.cx7a_gcp_c2s60 | 61.153 | 26.291 | 12.328 | 0.228 | 0.163 |
Performance metrics for the DBMS listed above. Some are normalized by throughput, others are not. Legend for results is here.
ips	qps	rps	rmbps	wps	wmbps	rpq	rkbpq	wpi	wkbpi	csps	cpups	cspq	cpupq	dbgb1	dbgb2	rss	maxop	p50	p99	tag
19769	194475	4	0.0	4724.8	203.0	0.000	0.000	0.239	10.516	654822	65.4	3.367	101	189.4	269.1	0.0	0.035	9653	8966	400m.pg151_def.cx7a_gcp_c2s60
19769	191566	0	0.0	4725.8	204.0	0.000	0.000	0.239	10.568	644840	65.5	3.366	103	189.4	269.1	0.0	0.050	9574	8889	400m.pg151_o2_nofp.cx7a_gcp_c2s60
19769	194991	0	0.0	4731.2	203.5	0.000	0.000	0.239	10.540	656586	65.4	3.367	101	189.4	268.7	0.0	0.040	9638	9014	400m.pg151_o3.cx7a_gcp_c2s60
19769	196975	0	0.0	4731.3	203.5	0.000	0.000	0.239	10.543	664868	65.2	3.375	99	189.4	268.3	0.0	0.031	9861	9190	400m.pg151_o3_native.cx7a_gcp_c2s60
19769	201918	0	0.0	4739.5	203.3	0.000	0.000	0.240	10.532	681698	65.2	3.376	97	189.4	268.9	0.0	0.054	10053	9398	400m.pg151_o3_native_lto.cx7a_gcp_c2s60
l.i0
l.i0: load without secondary indexes
Performance metrics for all DBMS, not just the ones listed above. Some are normalized by throughput, others are not. Legend for results is here.
ips	qps	rps	rmbps	wps	wmbps	rpq	rkbpq	wpi	wkbpi	csps	cpups	cspq	cpupq	dbgb1	dbgb2	rss	maxop	p50	p99	tag
1058201	0	0	0.0	1644.7	421.3	0.000	0.000	0.002	0.408	325574	57.5	0.308	16	43.0	117.3	NA	0.991	58735	18387	400m.pg151_def.cx7a_gcp_c2s60
1052632	0	0	0.0	1712.6	440.5	0.000	0.000	0.002	0.428	291249	57.5	0.277	16	43.0	122.2	0.0	0.615	59033	16090	400m.pg151_o2_nofp.cx7a_gcp_c2s60
1092896	0	0	0.0	1662.3	422.9	0.000	0.000	0.002	0.396	294405	58.0	0.269	16	43.0	115.2	NA	0.741	60333	15183	400m.pg151_o3.cx7a_gcp_c2s60
1069519	0	0	0.0	1626.3	421.3	0.000	0.000	0.002	0.403	328228	57.0	0.307	16	43.0	116.8	NA	0.750	59035	15389	400m.pg151_o3_native.cx7a_gcp_c2s60
1092896	0	0	0.0	1633.2	419.1	0.000	0.000	0.001	0.393	345431	57.0	0.316	16	43.0	115.1	NA	0.610	60333	19078	400m.pg151_o3_native_lto.cx7a_gcp_c2s60
l.x
l.x: create secondary indexes
Performance metrics for all DBMS, not just the ones listed above. Some are normalized by throughput, others are not. Legend for results is here.
ips	qps	rps	rmbps	wps	wmbps	rpq	rkbpq	wpi	wkbpi	csps	cpups	cspq	cpupq	dbgb1	dbgb2	rss	maxop	p50	p99	tag
327414	0	0	0.0	414.9	97.0	0.000	0.000	0.001	0.303	1163	3.0	0.004	3	78.3	152.6	0.0	0.002	NA	NA	400m.pg151_def.cx7a_gcp_c2s60
326879	0	0	0.0	406.1	95.1	0.000	0.000	0.001	0.298	1197	3.0	0.004	3	78.3	157.5	0.0	0.002	NA	NA	400m.pg151_o2_nofp.cx7a_gcp_c2s60
329300	0	0	0.0	438.0	109.5	0.000	0.000	0.001	0.340	1550	3.1	0.005	3	78.3	152.3	0.0	0.014	NA	NA	400m.pg151_o3.cx7a_gcp_c2s60
337352	0	0	0.0	417.8	99.2	0.000	0.000	0.001	0.301	1185	3.0	0.004	3	78.3	152.7	0.0	0.025	NA	NA	400m.pg151_o3_native.cx7a_gcp_c2s60
333695	0	0	0.0	437.2	108.2	0.000	0.000	0.001	0.332	1078	3.0	0.003	3	78.3	152.4	0.0	0.019	NA	NA	400m.pg151_o3_native_lto.cx7a_gcp_c2s60
l.i1
l.i1: continue load after secondary indexes created
Performance metrics for all DBMS, not just the ones listed above. Some are normalized by throughput, others are not. Legend for results is here.
ips	qps	rps	rmbps	wps	wmbps	rpq	rkbpq	wpi	wkbpi	csps	cpups	cspq	cpupq	dbgb1	dbgb2	rss	maxop	p50	p99	tag
387973	0	1902	13.8	2482.5	455.1	0.005	0.036	0.006	1.201	295237	54.0	0.761	42	170.2	333.6	0.0	1.859	23175	1949	400m.pg151_def.cx7a_gcp_c2s60
394477	0	1759	12.9	2428.6	447.9	0.004	0.033	0.006	1.163	253781	55.4	0.643	42	170.2	327.0	NA	1.581	23482	2548	400m.pg151_o2_nofp.cx7a_gcp_c2s60
393314	0	2028	14.6	2412.0	455.2	0.005	0.038	0.006	1.185	264858	53.9	0.673	41	170.2	329.1	NA	1.540	23824	1998	400m.pg151_o3.cx7a_gcp_c2s60
385356	0	1665	12.0	2365.5	432.4	0.004	0.032	0.006	1.149	299730	53.2	0.778	41	170.2	326.8	NA	0.968	23275	1898	400m.pg151_o3_native.cx7a_gcp_c2s60
394477	0	1979	14.8	2424.2	444.5	0.005	0.039	0.006	1.154	301611	52.8	0.765	40	170.2	326.0	NA	0.911	24024	2048	400m.pg151_o3_native_lto.cx7a_gcp_c2s60
q100.1
q100.1: range queries with 100 insert/s per client
Performance metrics for all DBMS, not just the ones listed above. Some are normalized by throughput, others are not. Legend for results is here.
ips	qps	rps	rmbps	wps	wmbps	rpq	rkbpq	wpi	wkbpi	csps	cpups	cspq	cpupq	dbgb1	dbgb2	rss	maxop	p50	p99	tag
1976	188814	0	0.0	2462.2	68.5	0.000	0.000	1.246	35.522	671024	62.7	3.554	100	171.1	304.9	0.0	0.026	9353	8966	400m.pg151_def.cx7a_gcp_c2s60
1976	184700	1	0.0	2468.1	68.1	0.000	0.000	1.249	35.307	659067	62.8	3.568	102	171.1	304.8	0.0	0.025	9194	8890	400m.pg151_o2_nofp.cx7a_gcp_c2s60
1976	188759	1	0.0	2494.3	64.1	0.000	0.000	1.262	33.247	674281	62.7	3.572	100	171.1	302.4	0.0	0.024	9365	9046	400m.pg151_o3.cx7a_gcp_c2s60
1977	193190	1	0.0	2487.5	63.2	0.000	0.000	1.258	32.739	686573	62.7	3.554	97	171.1	300.0	0.0	0.026	9625	9222	400m.pg151_o3_native.cx7a_gcp_c2s60
1976	195775	1	0.0	2510.3	63.0	0.000	0.000	1.271	32.641	697644	62.9	3.564	96	171.1	310.9	0.0	0.024	9685	9318	400m.pg151_o3_native_lto.cx7a_gcp_c2s60
q500.1
q500.1: range queries with 500 insert/s per client
Performance metrics for all DBMS, not just the ones listed above. Some are normalized by throughput, others are not. Legend for results is here.
ips	qps	rps	rmbps	wps	wmbps	rpq	rkbpq	wpi	wkbpi	csps	cpups	cspq	cpupq	dbgb1	dbgb2	rss	maxop	p50	p99	tag
9885	188582	0	0.0	4602.1	143.6	0.000	0.000	0.466	14.877	659668	63.8	3.498	101	176.0	260.9	0.0	0.030	9366	8950	400m.pg151_def.cx7a_gcp_c2s60
9885	187236	0	0.0	4603.4	143.2	0.000	0.000	0.466	14.836	653067	63.7	3.488	102	176.0	260.9	0.0	0.030	9238	8790	400m.pg151_o2_nofp.cx7a_gcp_c2s60
9885	190465	0	0.0	4557.9	142.0	0.000	0.000	0.461	14.715	664759	64.0	3.490	101	176.0	260.1	0.0	0.034	9401	8922	400m.pg151_o3.cx7a_gcp_c2s60
9885	194181	0	0.0	4541.7	141.0	0.000	0.000	0.459	14.611	676622	64.0	3.484	99	176.0	259.2	0.0	0.272	9637	9158	400m.pg151_o3_native.cx7a_gcp_c2s60
9890	196554	0	0.0	4560.7	141.6	0.000	0.000	0.461	14.659	686810	64.1	3.494	98	176.0	260.3	0.0	0.120	9813	9350	400m.pg151_o3_native_lto.cx7a_gcp_c2s60
q1000.1
q1000.1: range queries with 1000 insert/s per client
Performance metrics for all DBMS, not just the ones listed above. Some are normalized by throughput, others are not. Legend for results is here.
ips	qps	rps	rmbps	wps	wmbps	rpq	rkbpq	wpi	wkbpi	csps	cpups	cspq	cpupq	dbgb1	dbgb2	rss	maxop	p50	p99	tag
19769	194475	4	0.0	4724.8	203.0	0.000	0.000	0.239	10.516	654822	65.4	3.367	101	189.4	269.1	0.0	0.035	9653	8966	400m.pg151_def.cx7a_gcp_c2s60
19769	191566	0	0.0	4725.8	204.0	0.000	0.000	0.239	10.568	644840	65.5	3.366	103	189.4	269.1	0.0	0.050	9574	8889	400m.pg151_o2_nofp.cx7a_gcp_c2s60
19769	194991	0	0.0	4731.2	203.5	0.000	0.000	0.239	10.540	656586	65.4	3.367	101	189.4	268.7	0.0	0.040	9638	9014	400m.pg151_o3.cx7a_gcp_c2s60
19769	196975	0	0.0	4731.3	203.5	0.000	0.000	0.239	10.543	664868	65.2	3.375	99	189.4	268.3	0.0	0.031	9861	9190	400m.pg151_o3_native.cx7a_gcp_c2s60
19769	201918	0	0.0	4739.5	203.3	0.000	0.000	0.240	10.532	681698	65.2	3.376	97	189.4	268.9	0.0	0.054	10053	9398	400m.pg151_o3_native_lto.cx7a_gcp_c2s60
l.i0
- l.i0: load without secondary indexes
- Legend for results is here.
- Each entry lists the percentage of responses that fit in that bucket (slower than max time for previous bucket, faster than min time for next bucket).
Insert response time histogram
256us	1ms	4ms	16ms	64ms	256ms	1s	4s	16s	gt	max	tag
0.000	17.359	79.116	3.468	0.020	0.027	0.010	0.000	0.000	0.000	0.991	pg151_def.cx7a_gcp_c2s60
0.000	15.731	80.523	3.661	0.046	0.030	0.009	0.000	0.000	0.000	0.615	pg151_o2_nofp.cx7a_gcp_c2s60
0.000	20.346	76.465	3.134	0.013	0.033	0.010	0.000	0.000	0.000	0.741	pg151_o3.cx7a_gcp_c2s60
0.000	19.622	76.740	3.584	0.017	0.026	0.011	0.000	0.000	0.000	0.750	pg151_o3_native.cx7a_gcp_c2s60
0.000	24.912	71.498	3.535	0.016	0.029	0.011	0.000	0.000	0.000	0.610	pg151_o3_native_lto.cx7a_gcp_c2s60
l.x
- l.x: create secondary indexes
- Legend for results is here.
- Each entry lists the percentage of responses that fit in that bucket (slower than max time for previous bucket, faster than min time for next bucket).
TODO - determine whether there is data for create index response time
l.i1
- l.i1: continue load after secondary indexes created
- Legend for results is here.
- Each entry lists the percentage of responses that fit in that bucket (slower than max time for previous bucket, faster than min time for next bucket).
Insert response time histogram
256us	1ms	4ms	16ms	64ms	256ms	1s	4s	16s	gt	max	tag
0.000	0.000	94.531	4.663	0.759	0.035	0.011	nonzero	0.000	0.000	1.859	pg151_def.cx7a_gcp_c2s60
0.000	0.000	94.679	4.629	0.649	0.028	0.014	0.001	0.000	0.000	1.581	pg151_o2_nofp.cx7a_gcp_c2s60
0.000	0.000	94.588	4.572	0.792	0.031	0.016	nonzero	0.000	0.000	1.540	pg151_o3.cx7a_gcp_c2s60
0.000	0.000	94.423	4.725	0.807	0.030	0.016	0.000	0.000	0.000	0.968	pg151_o3_native.cx7a_gcp_c2s60
0.000	0.000	94.534	4.614	0.808	0.030	0.014	0.000	0.000	0.000	0.911	pg151_o3_native_lto.cx7a_gcp_c2s60
q100.1
- q100.1: range queries with 100 insert/s per client
- Legend for results is here.
- Each entry lists the percentage of responses that fit in that bucket (slower than max time for previous bucket, faster than min time for next bucket).
Query response time histogram
256us	1ms	4ms	16ms	64ms	256ms	1s	4s	16s	gt	max	tag
99.967	0.026	0.006	0.001	nonzero	0.000	0.000	0.000	0.000	0.000	0.026	pg151_def.cx7a_gcp_c2s60
99.964	0.029	0.006	0.001	nonzero	0.000	0.000	0.000	0.000	0.000	0.025	pg151_o2_nofp.cx7a_gcp_c2s60
99.969	0.024	0.006	0.001	nonzero	0.000	0.000	0.000	0.000	0.000	0.024	pg151_o3.cx7a_gcp_c2s60
99.971	0.022	0.006	0.001	nonzero	0.000	0.000	0.000	0.000	0.000	0.026	pg151_o3_native.cx7a_gcp_c2s60
99.974	0.019	0.006	0.001	nonzero	0.000	0.000	0.000	0.000	0.000	0.024	pg151_o3_native_lto.cx7a_gcp_c2s60
Insert response time histogram
256us	1ms	4ms	16ms	64ms	256ms	1s	4s	16s	gt	max	tag
0.000	0.000	98.394	1.307	0.268	0.029	0.001	0.000	0.000	0.000	0.282	pg151_def.cx7a_gcp_c2s60
0.000	0.000	97.382	2.221	0.397	0.000	0.000	0.000	0.000	0.000	0.039	pg151_o2_nofp.cx7a_gcp_c2s60
0.000	0.000	98.547	1.261	0.192	0.000	0.000	0.000	0.000	0.000	0.035	pg151_o3.cx7a_gcp_c2s60
0.000	0.000	97.988	1.699	0.307	0.007	0.000	0.000	0.000	0.000	0.069	pg151_o3_native.cx7a_gcp_c2s60
0.000	0.000	97.812	1.815	0.372	0.000	0.000	0.000	0.000	0.000	0.056	pg151_o3_native_lto.cx7a_gcp_c2s60
q500.1
- q500.1: range queries with 500 insert/s per client
- Legend for results is here.
- Each entry lists the percentage of responses that fit in that bucket (slower than max time for previous bucket, faster than min time for next bucket).
Query response time histogram
256us	1ms	4ms	16ms	64ms	256ms	1s	4s	16s	gt	max	tag
99.906	0.064	0.027	0.003	nonzero	0.000	0.000	0.000	0.000	0.000	0.030	pg151_def.cx7a_gcp_c2s60
99.901	0.068	0.027	0.003	nonzero	0.000	0.000	0.000	0.000	0.000	0.030	pg151_o2_nofp.cx7a_gcp_c2s60
99.907	0.063	0.027	0.003	nonzero	0.000	0.000	0.000	0.000	0.000	0.034	pg151_o3.cx7a_gcp_c2s60
99.912	0.059	0.026	0.003	nonzero	0.000	nonzero	0.000	0.000	0.000	0.272	pg151_o3_native.cx7a_gcp_c2s60
99.914	0.057	0.026	0.003	nonzero	nonzero	0.000	0.000	0.000	0.000	0.120	pg151_o3_native_lto.cx7a_gcp_c2s60
Insert response time histogram
256us	1ms	4ms	16ms	64ms	256ms	1s	4s	16s	gt	max	tag
0.000	0.000	52.672	27.405	19.639	0.284	0.000	0.000	0.000	0.000	0.210	pg151_def.cx7a_gcp_c2s60
0.000	0.000	52.032	28.335	19.355	0.274	0.005	0.000	0.000	0.000	0.418	pg151_o2_nofp.cx7a_gcp_c2s60
0.000	0.000	52.909	27.675	19.168	0.249	0.000	0.000	0.000	0.000	0.190	pg151_o3.cx7a_gcp_c2s60
0.000	0.000	52.710	27.735	19.282	0.267	0.006	0.000	0.000	0.000	0.386	pg151_o3_native.cx7a_gcp_c2s60
0.000	0.000	52.579	27.501	19.656	0.264	0.000	0.000	0.000	0.000	0.171	pg151_o3_native_lto.cx7a_gcp_c2s60
q1000.1
- q1000.1: range queries with 1000 insert/s per client
- Legend for results is here.
- Each entry lists the percentage of responses that fit in that bucket (slower than max time for previous bucket, faster than min time for next bucket).
Query response time histogram
256us	1ms	4ms	16ms	64ms	256ms	1s	4s	16s	gt	max	tag
99.854	0.104	0.038	0.004	nonzero	0.000	0.000	0.000	0.000	0.000	0.035	pg151_def.cx7a_gcp_c2s60
99.847	0.109	0.039	0.004	nonzero	0.000	0.000	0.000	0.000	0.000	0.050	pg151_o2_nofp.cx7a_gcp_c2s60
99.853	0.105	0.038	0.004	nonzero	0.000	0.000	0.000	0.000	0.000	0.040	pg151_o3.cx7a_gcp_c2s60
99.856	0.101	0.038	0.004	nonzero	0.000	0.000	0.000	0.000	0.000	0.031	pg151_o3_native.cx7a_gcp_c2s60
99.861	0.098	0.037	0.004	nonzero	0.000	0.000	0.000	0.000	0.000	0.054	pg151_o3_native_lto.cx7a_gcp_c2s60
Insert response time histogram
256us	1ms	4ms	16ms	64ms	256ms	1s	4s	16s	gt	max	tag
0.000	0.000	60.405	26.994	12.380	0.222	0.000	0.000	0.000	0.000	0.184	pg151_def.cx7a_gcp_c2s60
0.000	0.000	59.772	27.751	12.250	0.228	0.000	0.000	0.000	0.000	0.217	pg151_o2_nofp.cx7a_gcp_c2s60
0.000	0.000	60.159	27.043	12.567	0.231	0.000	0.000	0.000	0.000	0.177	pg151_o3.cx7a_gcp_c2s60
0.000	0.000	60.793	26.644	12.328	0.235	0.000	0.000	0.000	0.000	0.195	pg151_o3_native.cx7a_gcp_c2s60
0.000	0.000	61.153	26.291	12.328	0.228	0.000	0.000	0.000	0.000	0.163	pg151_o3_native_lto.cx7a_gcp_c2s60