Introduction
This is a report for the insert benchmark with 400M docs and 20 client(s). It is generated by scripts (bash, awk, sed) and Tufte might not be impressed. An overview of the insert benchmark is here and a short update is here. Below, by DBMS, I mean DBMS+version.config. An example is my8020.c10b40 where my means MySQL, 8020 is version 8.0.20 and c10b40 is the name for the configuration file.
The test server is c2-standard-60 from GCP with 30 cores, hyperthreads disabled, 240G RAM and 3T of NVMe (XFS with RAID0 over 8 devices). The benchmark was run with 20 clients and there were 1 or 2 connections per client (1 for queries, 1 for inserts). It uses 1 table. It loads 400M rows without secondary indexes, creates secondary indexes, loads another 400M rows per table then does 3 read+write tests for one hour each that do queries as fast as possible with 100, 500 and then 1000 writes/second/client concurrent with the queries. The database is cached by the OS but not by Postgres. Clients and the DBMS share one server. The per-database configs are in the per-database subdirectories here.
The tested DBMS are:
- pg151_def.cx7_gcp_c2s60_4g - Postgres 15.1, the cx7_gcp_c2s60_4g config and the build used: -O2
- pg151_o2_nofp.cx7_gcp_c2s60_4g - Postgres 15.1, the cx7_gcp_c2s60_4g config and the build used: -O2 -no-omit-frame-pointer
- pg151_o3.cx7_gcp_c2s60_4g - Postgres 15.1, the cx7_gcp_c2s60_4g config and the build used: -O3
- pg151_o3_native.cx7_gcp_c2s60_4g - Postgres 15.1, the cx7_gcp_c2s60_4g config and the build used: -O3 -march=native -mtune=native
- pg151_o3_native_lto.cx7_gcp_c2s60_4g - Postgres 15.1, the cx7_gcp_c2s60_4g config and the build used: -O3 -march=native -mtune=native and -flto
Contents
- Summary
- l.i0: load without secondary indexes
- l.x: create secondary indexes
- l.i1: continue load after secondary indexes created
- q100.1: range queries with 100 insert/s per client
- q500.1: range queries with 500 insert/s per client
- q1000.1: range queries with 1000 insert/s per client
Summary
The numbers are inserts/s for l.i0 and l.i1, indexed docs (or rows) /s for l.x and queries/s for q*.2. The values are the average rate over the entire test for inserts (IPS) and queries (QPS). The range of values for IPS and QPS is split into 3 parts: bottom 25%, middle 50%, top 25%. Values in the bottom 25% have a red background, values in the top 25% have a green background and values in the middle have no color. A gray background is used for values that can be ignored because the DBMS did not sustain the target insert rate. Red backgrounds are not used when the minimum value is within 80% of the max value.
| dbms | l.i0 | l.x | l.i1 | q100.1 | q500.1 | q1000.1 |
|---|---|---|---|---|---|---|
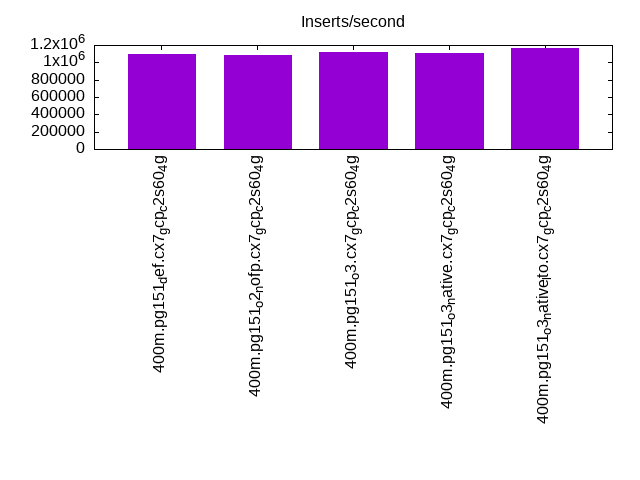
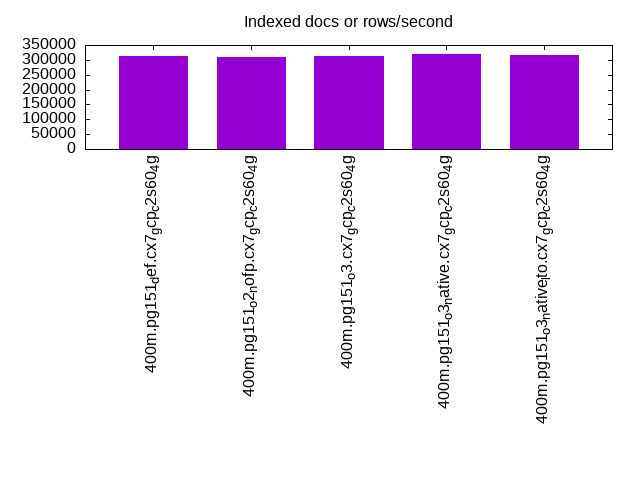
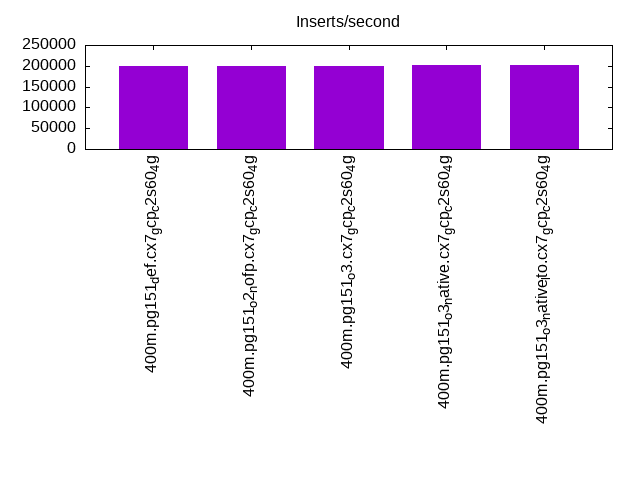
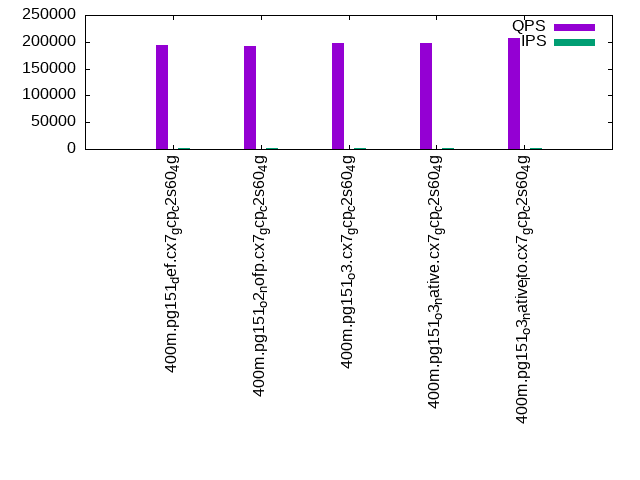
| 400m.pg151_def.cx7_gcp_c2s60_4g | 1095890 | 311604 | 199104 | 194955 | 203528 | 217935 |
| 400m.pg151_o2_nofp.cx7_gcp_c2s60_4g | 1081081 | 309435 | 199005 | 191325 | 201561 | 214672 |
| 400m.pg151_o3.cx7_gcp_c2s60_4g | 1120448 | 311362 | 199700 | 198333 | 207861 | 221283 |
| 400m.pg151_o3_native.cx7_gcp_c2s60_4g | 1101928 | 318805 | 201207 | 198610 | 208185 | 221331 |
| 400m.pg151_o3_native_lto.cx7_gcp_c2s60_4g | 1162791 | 316535 | 202224 | 206718 | 216467 | 230002 |
This table has relative throughput, throughput for the DBMS relative to the DBMS in the first line, using the absolute throughput from the previous table.
| dbms | l.i0 | l.x | l.i1 | q100.1 | q500.1 | q1000.1 |
|---|---|---|---|---|---|---|
| 400m.pg151_def.cx7_gcp_c2s60_4g | 1.00 | 1.00 | 1.00 | 1.00 | 1.00 | 1.00 |
| 400m.pg151_o2_nofp.cx7_gcp_c2s60_4g | 0.99 | 0.99 | 1.00 | 0.98 | 0.99 | 0.99 |
| 400m.pg151_o3.cx7_gcp_c2s60_4g | 1.02 | 1.00 | 1.00 | 1.02 | 1.02 | 1.02 |
| 400m.pg151_o3_native.cx7_gcp_c2s60_4g | 1.01 | 1.02 | 1.01 | 1.02 | 1.02 | 1.02 |
| 400m.pg151_o3_native_lto.cx7_gcp_c2s60_4g | 1.06 | 1.02 | 1.02 | 1.06 | 1.06 | 1.06 |
This lists the average rate of inserts/s for the tests that do inserts concurrent with queries. For such tests the query rate is listed in the table above. The read+write tests are setup so that the insert rate should match the target rate every second. Cells that are not at least 95% of the target have a red background to indicate a failure to satisfy the target.
| dbms | q100.1 | q500.1 | q1000.1 |
|---|---|---|---|
| pg151_def.cx7_gcp_c2s60_4g | 1976 | 9885 | 19769 |
| pg151_o2_nofp.cx7_gcp_c2s60_4g | 1976 | 9885 | 19769 |
| pg151_o3.cx7_gcp_c2s60_4g | 1976 | 9885 | 19769 |
| pg151_o3_native.cx7_gcp_c2s60_4g | 1976 | 9885 | 19780 |
| pg151_o3_native_lto.cx7_gcp_c2s60_4g | 1976 | 9885 | 19769 |
| target | 2000 | 10000 | 20000 |
l.i0
l.i0: load without secondary indexes. Graphs for performance per 1-second interval are here.
Average throughput:
Insert response time histogram: each cell has the percentage of responses that take <= the time in the header and max is the max response time in seconds. For the max column values in the top 25% of the range have a red background and in the bottom 25% of the range have a green background. The red background is not used when the min value is within 80% of the max value.
| dbms | 256us | 1ms | 4ms | 16ms | 64ms | 256ms | 1s | 4s | 16s | gt | max |
|---|---|---|---|---|---|---|---|---|---|---|---|
| pg151_def.cx7_gcp_c2s60_4g | 20.808 | 76.340 | 2.796 | 0.018 | 0.030 | 0.009 | 0.571 | ||||
| pg151_o2_nofp.cx7_gcp_c2s60_4g | 18.086 | 79.084 | 2.774 | 0.015 | 0.029 | 0.011 | 0.001 | 1.007 | |||
| pg151_o3.cx7_gcp_c2s60_4g | 23.465 | 73.936 | 2.537 | 0.021 | 0.031 | 0.010 | 0.468 | ||||
| pg151_o3_native.cx7_gcp_c2s60_4g | 22.885 | 74.239 | 2.813 | 0.024 | 0.030 | 0.009 | 0.661 | ||||
| pg151_o3_native_lto.cx7_gcp_c2s60_4g | 31.368 | 66.117 | 2.463 | 0.019 | 0.025 | 0.008 | 0.366 |
Performance metrics for the DBMS listed above. Some are normalized by throughput, others are not. Legend for results is here.
ips	qps	rps	rmbps	wps	wmbps	rpq	rkbpq	wpi	wkbpi	csps	cpups	cspq	cpupq	dbgb1	dbgb2	rss	maxop	p50	p99	tag
1095890	0	0	0.0	2202.3	464.8	0.000	0.000	0.002	0.434	318552	57.9	0.291	16	43.0	113.6	NA	0.571	60532	23784	400m.pg151_def.cx7_gcp_c2s60_4g
1081081	0	0	0.0	2176.1	461.7	0.000	0.000	0.002	0.437	299663	57.9	0.277	16	43.0	113.7	NA	1.007	59734	14983	400m.pg151_o2_nofp.cx7_gcp_c2s60_4g
1120448	0	0	0.0	2273.8	469.9	0.000	0.000	0.002	0.429	304714	58.4	0.272	16	43.0	112.4	NA	0.468	61758	24073	400m.pg151_o3.cx7_gcp_c2s60_4g
1101928	0	0	0.0	2266.5	462.9	0.000	0.000	0.002	0.430	320179	57.8	0.291	16	43.0	112.6	NA	0.661	60833	12791	400m.pg151_o3_native.cx7_gcp_c2s60_4g
1162791	0	0	0.0	2311.7	463.6	0.000	0.000	0.002	0.408	324905	58.7	0.279	15	43.0	112.4	0.0	0.366	63827	13885	400m.pg151_o3_native_lto.cx7_gcp_c2s60_4g
l.x
l.x: create secondary indexes.
Average throughput:
Performance metrics for the DBMS listed above. Some are normalized by throughput, others are not. Legend for results is here.
ips	qps	rps	rmbps	wps	wmbps	rpq	rkbpq	wpi	wkbpi	csps	cpups	cspq	cpupq	dbgb1	dbgb2	rss	maxop	p50	p99	tag
311604	0	0	0.0	521.1	119.0	0.000	0.000	0.002	0.391	2079	3.1	0.007	3	78.3	163.0	0.0	0.002	NA	NA	400m.pg151_def.cx7_gcp_c2s60_4g
309435	0	0	0.0	514.7	121.3	0.000	0.000	0.002	0.401	1953	3.1	0.006	3	78.3	162.4	0.0	0.002	NA	NA	400m.pg151_o2_nofp.cx7_gcp_c2s60_4g
311362	0	0	0.0	556.7	134.3	0.000	0.000	0.002	0.442	2333	3.1	0.007	3	78.3	163.6	0.0	0.002	NA	NA	400m.pg151_o3.cx7_gcp_c2s60_4g
318805	0	0	0.0	554.8	124.7	0.000	0.000	0.002	0.400	2228	3.2	0.007	3	78.3	163.3	0.0	0.002	NA	NA	400m.pg151_o3_native.cx7_gcp_c2s60_4g
316535	0	0	0.0	561.7	128.6	0.000	0.000	0.002	0.416	2088	3.2	0.007	3	78.3	164.9	0.0	0.002	NA	NA	400m.pg151_o3_native_lto.cx7_gcp_c2s60_4g
l.i1
l.i1: continue load after secondary indexes created. Graphs for performance per 1-second interval are here.
Average throughput:
Insert response time histogram: each cell has the percentage of responses that take <= the time in the header and max is the max response time in seconds. For the max column values in the top 25% of the range have a red background and in the bottom 25% of the range have a green background. The red background is not used when the min value is within 80% of the max value.
| dbms | 256us | 1ms | 4ms | 16ms | 64ms | 256ms | 1s | 4s | 16s | gt | max |
|---|---|---|---|---|---|---|---|---|---|---|---|
| pg151_def.cx7_gcp_c2s60_4g | 85.095 | 11.965 | 2.224 | 0.690 | 0.026 | 0.629 | |||||
| pg151_o2_nofp.cx7_gcp_c2s60_4g | 84.665 | 12.436 | 2.226 | 0.642 | 0.030 | 0.935 | |||||
| pg151_o3.cx7_gcp_c2s60_4g | 85.499 | 11.546 | 2.243 | 0.687 | 0.025 | nonzero | 1.268 | ||||
| pg151_o3_native.cx7_gcp_c2s60_4g | 85.870 | 11.070 | 2.360 | 0.673 | 0.027 | 0.837 | |||||
| pg151_o3_native_lto.cx7_gcp_c2s60_4g | 87.176 | 9.691 | 2.396 | 0.711 | 0.026 | 0.648 |
Performance metrics for the DBMS listed above. Some are normalized by throughput, others are not. Legend for results is here.
ips	qps	rps	rmbps	wps	wmbps	rpq	rkbpq	wpi	wkbpi	csps	cpups	cspq	cpupq	dbgb1	dbgb2	rss	maxop	p50	p99	tag
199104	0	0	0.0	41295.9	1284.5	0.000	0.000	0.207	6.606	180412	44.1	0.906	66	170.2	288.9	NA	0.629	10688	1299	400m.pg151_def.cx7_gcp_c2s60_4g
199005	0	0	0.0	41177.3	1283.0	0.000	0.000	0.207	6.602	180064	44.7	0.905	67	170.2	289.9	NA	0.935	10688	1348	400m.pg151_o2_nofp.cx7_gcp_c2s60_4g
199700	0	0	0.0	41224.2	1280.6	0.000	0.000	0.206	6.567	182845	44.3	0.916	67	170.2	286.9	NA	1.268	10738	1049	400m.pg151_o3.cx7_gcp_c2s60_4g
201207	0	0	0.0	40829.0	1273.9	0.000	0.000	0.203	6.483	189830	43.6	0.943	65	170.2	286.4	NA	0.837	10893	1349	400m.pg151_o3_native.cx7_gcp_c2s60_4g
202224	0	0	0.0	40306.4	1272.0	0.000	0.000	0.199	6.441	191698	43.0	0.948	64	170.2	287.1	NA	0.648	10838	1199	400m.pg151_o3_native_lto.cx7_gcp_c2s60_4g
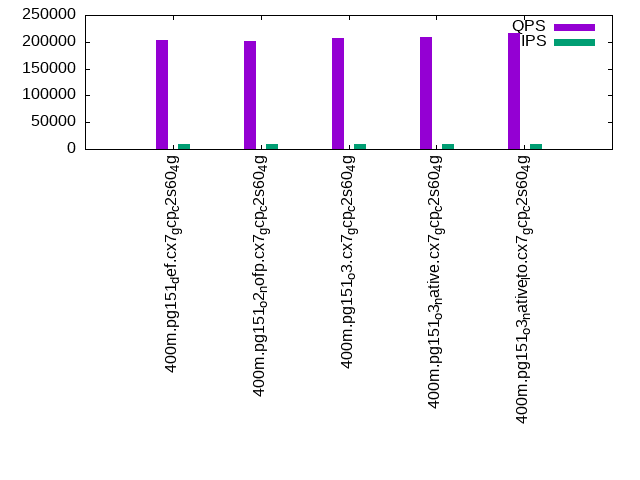
q100.1
q100.1: range queries with 100 insert/s per client. Graphs for performance per 1-second interval are here.
Average throughput:
Query response time histogram: each cell has the percentage of responses that take <= the time in the header and max is the max response time in seconds. For max values in the top 25% of the range have a red background and in the bottom 25% of the range have a green background. The red background is not used when the min value is within 80% of the max value.
| dbms | 256us | 1ms | 4ms | 16ms | 64ms | 256ms | 1s | 4s | 16s | gt | max |
|---|---|---|---|---|---|---|---|---|---|---|---|
| pg151_def.cx7_gcp_c2s60_4g | 99.973 | 0.020 | 0.006 | 0.001 | nonzero | 0.024 | |||||
| pg151_o2_nofp.cx7_gcp_c2s60_4g | 99.970 | 0.023 | 0.006 | 0.001 | nonzero | 0.021 | |||||
| pg151_o3.cx7_gcp_c2s60_4g | 99.976 | 0.017 | 0.006 | 0.001 | nonzero | 0.023 | |||||
| pg151_o3_native.cx7_gcp_c2s60_4g | 99.975 | 0.018 | 0.006 | 0.001 | nonzero | 0.042 | |||||
| pg151_o3_native_lto.cx7_gcp_c2s60_4g | 99.978 | 0.015 | 0.006 | 0.001 | nonzero | 0.024 |
Insert response time histogram: each cell has the percentage of responses that take <= the time in the header and max is the max response time in seconds. For max values in the top 25% of the range have a red background and in the bottom 25% of the range have a green background. The red background is not used when the min value is within 80% of the max value.
| dbms | 256us | 1ms | 4ms | 16ms | 64ms | 256ms | 1s | 4s | 16s | gt | max |
|---|---|---|---|---|---|---|---|---|---|---|---|
| pg151_def.cx7_gcp_c2s60_4g | 97.746 | 2.104 | 0.129 | 0.021 | 0.160 | ||||||
| pg151_o2_nofp.cx7_gcp_c2s60_4g | 97.801 | 2.033 | 0.129 | 0.018 | 0.018 | 0.312 | |||||
| pg151_o3.cx7_gcp_c2s60_4g | 97.578 | 2.242 | 0.181 | 0.056 | |||||||
| pg151_o3_native.cx7_gcp_c2s60_4g | 96.685 | 2.796 | 0.517 | 0.003 | 0.065 | ||||||
| pg151_o3_native_lto.cx7_gcp_c2s60_4g | 98.401 | 1.499 | 0.088 | 0.001 | 0.011 | 0.318 |
Performance metrics for the DBMS listed above. Some are normalized by throughput, others are not. Legend for results is here.
ips	qps	rps	rmbps	wps	wmbps	rpq	rkbpq	wpi	wkbpi	csps	cpups	cspq	cpupq	dbgb1	dbgb2	rss	maxop	p50	p99	tag
1976	194955	3	0.0	4000.3	50.5	0.000	0.000	2.025	26.168	696682	62.7	3.574	96	171.1	249.6	0.0	0.024	9752	9414	400m.pg151_def.cx7_gcp_c2s60_4g
1976	191325	3	0.0	4084.1	51.8	0.000	0.000	2.067	26.845	685137	63.0	3.581	99	171.1	251.1	0.0	0.021	9573	9274	400m.pg151_o2_nofp.cx7_gcp_c2s60_4g
1976	198333	1	0.0	4013.6	50.8	0.000	0.000	2.031	26.307	708456	62.5	3.572	95	171.1	252.8	0.0	0.023	9861	9546	400m.pg151_o3.cx7_gcp_c2s60_4g
1976	198610	3	0.0	4021.2	51.6	0.000	0.000	2.035	26.724	709758	62.5	3.574	94	171.1	264.1	0.0	0.042	9909	9573	400m.pg151_o3_native.cx7_gcp_c2s60_4g
1976	206718	2	0.0	4032.1	52.1	0.000	0.000	2.041	27.013	737779	62.5	3.569	91	171.1	267.8	0.0	0.024	10197	9866	400m.pg151_o3_native_lto.cx7_gcp_c2s60_4g
q500.1
q500.1: range queries with 500 insert/s per client. Graphs for performance per 1-second interval are here.
Average throughput:
Query response time histogram: each cell has the percentage of responses that take <= the time in the header and max is the max response time in seconds. For max values in the top 25% of the range have a red background and in the bottom 25% of the range have a green background. The red background is not used when the min value is within 80% of the max value.
| dbms | 256us | 1ms | 4ms | 16ms | 64ms | 256ms | 1s | 4s | 16s | gt | max |
|---|---|---|---|---|---|---|---|---|---|---|---|
| pg151_def.cx7_gcp_c2s60_4g | 99.879 | 0.087 | 0.031 | 0.002 | nonzero | 0.027 | |||||
| pg151_o2_nofp.cx7_gcp_c2s60_4g | 99.870 | 0.095 | 0.033 | 0.002 | nonzero | 0.023 | |||||
| pg151_o3.cx7_gcp_c2s60_4g | 99.881 | 0.086 | 0.031 | 0.002 | nonzero | 0.028 | |||||
| pg151_o3_native.cx7_gcp_c2s60_4g | 99.880 | 0.087 | 0.031 | 0.002 | nonzero | nonzero | 0.119 | ||||
| pg151_o3_native_lto.cx7_gcp_c2s60_4g | 99.889 | 0.080 | 0.029 | 0.002 | nonzero | 0.027 |
Insert response time histogram: each cell has the percentage of responses that take <= the time in the header and max is the max response time in seconds. For max values in the top 25% of the range have a red background and in the bottom 25% of the range have a green background. The red background is not used when the min value is within 80% of the max value.
| dbms | 256us | 1ms | 4ms | 16ms | 64ms | 256ms | 1s | 4s | 16s | gt | max |
|---|---|---|---|---|---|---|---|---|---|---|---|
| pg151_def.cx7_gcp_c2s60_4g | 45.869 | 40.045 | 14.016 | 0.071 | 0.145 | ||||||
| pg151_o2_nofp.cx7_gcp_c2s60_4g | 44.721 | 41.182 | 14.042 | 0.055 | 0.122 | ||||||
| pg151_o3.cx7_gcp_c2s60_4g | 45.136 | 41.237 | 13.573 | 0.054 | 0.154 | ||||||
| pg151_o3_native.cx7_gcp_c2s60_4g | 45.612 | 40.340 | 13.980 | 0.069 | 0.162 | ||||||
| pg151_o3_native_lto.cx7_gcp_c2s60_4g | 44.827 | 40.126 | 14.984 | 0.063 | 0.251 |
Performance metrics for the DBMS listed above. Some are normalized by throughput, others are not. Legend for results is here.
ips	qps	rps	rmbps	wps	wmbps	rpq	rkbpq	wpi	wkbpi	csps	cpups	cspq	cpupq	dbgb1	dbgb2	rss	maxop	p50	p99	tag
9885	203528	0	0.0	19508.2	221.7	0.000	0.000	1.974	22.966	689849	64.6	3.389	95	176.0	241.3	0.0	0.027	10053	9302	400m.pg151_def.cx7_gcp_c2s60_4g
9885	201561	0	0.0	19513.1	222.2	0.000	0.000	1.974	23.018	682466	64.7	3.386	96	176.0	242.0	0.0	0.023	9877	9101	400m.pg151_o2_nofp.cx7_gcp_c2s60_4g
9885	207861	0	0.0	19515.0	221.4	0.000	0.000	1.974	22.936	704115	64.3	3.387	93	176.0	242.8	0.0	0.028	10213	9477	400m.pg151_o3.cx7_gcp_c2s60_4g
9885	208185	0	0.0	19516.8	221.6	0.000	0.000	1.974	22.956	705618	64.3	3.389	93	176.0	244.0	0.0	0.119	10277	9477	400m.pg151_o3_native.cx7_gcp_c2s60_4g
9885	216467	0	0.0	19518.5	222.8	0.000	0.000	1.975	23.078	731604	64.3	3.380	89	176.0	247.4	0.0	0.027	10532	9738	400m.pg151_o3_native_lto.cx7_gcp_c2s60_4g
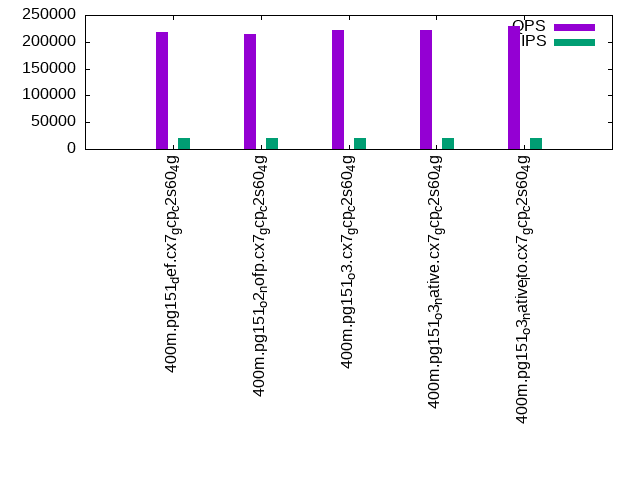
q1000.1
q1000.1: range queries with 1000 insert/s per client. Graphs for performance per 1-second interval are here.
Average throughput:
Query response time histogram: each cell has the percentage of responses that take <= the time in the header and max is the max response time in seconds. For max values in the top 25% of the range have a red background and in the bottom 25% of the range have a green background. The red background is not used when the min value is within 80% of the max value.
| dbms | 256us | 1ms | 4ms | 16ms | 64ms | 256ms | 1s | 4s | 16s | gt | max |
|---|---|---|---|---|---|---|---|---|---|---|---|
| pg151_def.cx7_gcp_c2s60_4g | 99.778 | 0.172 | 0.048 | 0.003 | nonzero | nonzero | 0.145 | ||||
| pg151_o2_nofp.cx7_gcp_c2s60_4g | 99.757 | 0.189 | 0.051 | 0.003 | nonzero | nonzero | 0.071 | ||||
| pg151_o3.cx7_gcp_c2s60_4g | 99.776 | 0.174 | 0.047 | 0.003 | nonzero | 0.040 | |||||
| pg151_o3_native.cx7_gcp_c2s60_4g | 99.773 | 0.177 | 0.046 | 0.003 | nonzero | nonzero | 0.066 | ||||
| pg151_o3_native_lto.cx7_gcp_c2s60_4g | 99.783 | 0.169 | 0.045 | 0.003 | nonzero | 0.050 |
Insert response time histogram: each cell has the percentage of responses that take <= the time in the header and max is the max response time in seconds. For max values in the top 25% of the range have a red background and in the bottom 25% of the range have a green background. The red background is not used when the min value is within 80% of the max value.
| dbms | 256us | 1ms | 4ms | 16ms | 64ms | 256ms | 1s | 4s | 16s | gt | max |
|---|---|---|---|---|---|---|---|---|---|---|---|
| pg151_def.cx7_gcp_c2s60_4g | 44.407 | 46.319 | 9.069 | 0.203 | 0.003 | 0.316 | |||||
| pg151_o2_nofp.cx7_gcp_c2s60_4g | 43.125 | 47.552 | 9.094 | 0.229 | nonzero | 0.293 | |||||
| pg151_o3.cx7_gcp_c2s60_4g | 43.153 | 47.321 | 9.308 | 0.216 | 0.002 | 0.407 | |||||
| pg151_o3_native.cx7_gcp_c2s60_4g | 44.494 | 46.500 | 8.816 | 0.189 | 0.001 | 0.370 | |||||
| pg151_o3_native_lto.cx7_gcp_c2s60_4g | 44.460 | 46.598 | 8.746 | 0.195 | 0.217 |
Performance metrics for the DBMS listed above. Some are normalized by throughput, others are not. Legend for results is here.
ips	qps	rps	rmbps	wps	wmbps	rpq	rkbpq	wpi	wkbpi	csps	cpups	cspq	cpupq	dbgb1	dbgb2	rss	maxop	p50	p99	tag
19769	217935	0	0.0	38128.6	397.8	0.000	0.000	1.929	20.606	689255	66.9	3.163	92	189.4	261.4	0.0	0.145	10661	9357	400m.pg151_def.cx7_gcp_c2s60_4g
19769	214672	0	0.0	38089.5	397.5	0.000	0.000	1.927	20.587	680269	66.7	3.169	93	189.4	261.4	0.0	0.071	10500	9254	400m.pg151_o2_nofp.cx7_gcp_c2s60_4g
19769	221283	0	0.0	38114.9	397.1	0.000	0.000	1.928	20.571	700496	66.7	3.166	90	189.4	261.4	0.0	0.040	10916	9637	400m.pg151_o3.cx7_gcp_c2s60_4g
19780	221331	0	0.0	38210.9	396.6	0.000	0.000	1.932	20.531	702013	66.7	3.172	90	189.4	261.4	0.0	0.066	10932	9637	400m.pg151_o3_native.cx7_gcp_c2s60_4g
19769	230002	0	0.0	38217.0	393.9	0.000	0.000	1.933	20.402	730673	66.4	3.177	87	189.4	261.4	0.0	0.050	11268	9861	400m.pg151_o3_native_lto.cx7_gcp_c2s60_4g
l.i0
l.i0: load without secondary indexes
Performance metrics for all DBMS, not just the ones listed above. Some are normalized by throughput, others are not. Legend for results is here.
ips	qps	rps	rmbps	wps	wmbps	rpq	rkbpq	wpi	wkbpi	csps	cpups	cspq	cpupq	dbgb1	dbgb2	rss	maxop	p50	p99	tag
1095890	0	0	0.0	2202.3	464.8	0.000	0.000	0.002	0.434	318552	57.9	0.291	16	43.0	113.6	NA	0.571	60532	23784	400m.pg151_def.cx7_gcp_c2s60_4g
1081081	0	0	0.0	2176.1	461.7	0.000	0.000	0.002	0.437	299663	57.9	0.277	16	43.0	113.7	NA	1.007	59734	14983	400m.pg151_o2_nofp.cx7_gcp_c2s60_4g
1120448	0	0	0.0	2273.8	469.9	0.000	0.000	0.002	0.429	304714	58.4	0.272	16	43.0	112.4	NA	0.468	61758	24073	400m.pg151_o3.cx7_gcp_c2s60_4g
1101928	0	0	0.0	2266.5	462.9	0.000	0.000	0.002	0.430	320179	57.8	0.291	16	43.0	112.6	NA	0.661	60833	12791	400m.pg151_o3_native.cx7_gcp_c2s60_4g
1162791	0	0	0.0	2311.7	463.6	0.000	0.000	0.002	0.408	324905	58.7	0.279	15	43.0	112.4	0.0	0.366	63827	13885	400m.pg151_o3_native_lto.cx7_gcp_c2s60_4g
l.x
l.x: create secondary indexes
Performance metrics for all DBMS, not just the ones listed above. Some are normalized by throughput, others are not. Legend for results is here.
ips	qps	rps	rmbps	wps	wmbps	rpq	rkbpq	wpi	wkbpi	csps	cpups	cspq	cpupq	dbgb1	dbgb2	rss	maxop	p50	p99	tag
311604	0	0	0.0	521.1	119.0	0.000	0.000	0.002	0.391	2079	3.1	0.007	3	78.3	163.0	0.0	0.002	NA	NA	400m.pg151_def.cx7_gcp_c2s60_4g
309435	0	0	0.0	514.7	121.3	0.000	0.000	0.002	0.401	1953	3.1	0.006	3	78.3	162.4	0.0	0.002	NA	NA	400m.pg151_o2_nofp.cx7_gcp_c2s60_4g
311362	0	0	0.0	556.7	134.3	0.000	0.000	0.002	0.442	2333	3.1	0.007	3	78.3	163.6	0.0	0.002	NA	NA	400m.pg151_o3.cx7_gcp_c2s60_4g
318805	0	0	0.0	554.8	124.7	0.000	0.000	0.002	0.400	2228	3.2	0.007	3	78.3	163.3	0.0	0.002	NA	NA	400m.pg151_o3_native.cx7_gcp_c2s60_4g
316535	0	0	0.0	561.7	128.6	0.000	0.000	0.002	0.416	2088	3.2	0.007	3	78.3	164.9	0.0	0.002	NA	NA	400m.pg151_o3_native_lto.cx7_gcp_c2s60_4g
l.i1
l.i1: continue load after secondary indexes created
Performance metrics for all DBMS, not just the ones listed above. Some are normalized by throughput, others are not. Legend for results is here.
ips	qps	rps	rmbps	wps	wmbps	rpq	rkbpq	wpi	wkbpi	csps	cpups	cspq	cpupq	dbgb1	dbgb2	rss	maxop	p50	p99	tag
199104	0	0	0.0	41295.9	1284.5	0.000	0.000	0.207	6.606	180412	44.1	0.906	66	170.2	288.9	NA	0.629	10688	1299	400m.pg151_def.cx7_gcp_c2s60_4g
199005	0	0	0.0	41177.3	1283.0	0.000	0.000	0.207	6.602	180064	44.7	0.905	67	170.2	289.9	NA	0.935	10688	1348	400m.pg151_o2_nofp.cx7_gcp_c2s60_4g
199700	0	0	0.0	41224.2	1280.6	0.000	0.000	0.206	6.567	182845	44.3	0.916	67	170.2	286.9	NA	1.268	10738	1049	400m.pg151_o3.cx7_gcp_c2s60_4g
201207	0	0	0.0	40829.0	1273.9	0.000	0.000	0.203	6.483	189830	43.6	0.943	65	170.2	286.4	NA	0.837	10893	1349	400m.pg151_o3_native.cx7_gcp_c2s60_4g
202224	0	0	0.0	40306.4	1272.0	0.000	0.000	0.199	6.441	191698	43.0	0.948	64	170.2	287.1	NA	0.648	10838	1199	400m.pg151_o3_native_lto.cx7_gcp_c2s60_4g
q100.1
q100.1: range queries with 100 insert/s per client
Performance metrics for all DBMS, not just the ones listed above. Some are normalized by throughput, others are not. Legend for results is here.
ips	qps	rps	rmbps	wps	wmbps	rpq	rkbpq	wpi	wkbpi	csps	cpups	cspq	cpupq	dbgb1	dbgb2	rss	maxop	p50	p99	tag
1976	194955	3	0.0	4000.3	50.5	0.000	0.000	2.025	26.168	696682	62.7	3.574	96	171.1	249.6	0.0	0.024	9752	9414	400m.pg151_def.cx7_gcp_c2s60_4g
1976	191325	3	0.0	4084.1	51.8	0.000	0.000	2.067	26.845	685137	63.0	3.581	99	171.1	251.1	0.0	0.021	9573	9274	400m.pg151_o2_nofp.cx7_gcp_c2s60_4g
1976	198333	1	0.0	4013.6	50.8	0.000	0.000	2.031	26.307	708456	62.5	3.572	95	171.1	252.8	0.0	0.023	9861	9546	400m.pg151_o3.cx7_gcp_c2s60_4g
1976	198610	3	0.0	4021.2	51.6	0.000	0.000	2.035	26.724	709758	62.5	3.574	94	171.1	264.1	0.0	0.042	9909	9573	400m.pg151_o3_native.cx7_gcp_c2s60_4g
1976	206718	2	0.0	4032.1	52.1	0.000	0.000	2.041	27.013	737779	62.5	3.569	91	171.1	267.8	0.0	0.024	10197	9866	400m.pg151_o3_native_lto.cx7_gcp_c2s60_4g
q500.1
q500.1: range queries with 500 insert/s per client
Performance metrics for all DBMS, not just the ones listed above. Some are normalized by throughput, others are not. Legend for results is here.
ips	qps	rps	rmbps	wps	wmbps	rpq	rkbpq	wpi	wkbpi	csps	cpups	cspq	cpupq	dbgb1	dbgb2	rss	maxop	p50	p99	tag
9885	203528	0	0.0	19508.2	221.7	0.000	0.000	1.974	22.966	689849	64.6	3.389	95	176.0	241.3	0.0	0.027	10053	9302	400m.pg151_def.cx7_gcp_c2s60_4g
9885	201561	0	0.0	19513.1	222.2	0.000	0.000	1.974	23.018	682466	64.7	3.386	96	176.0	242.0	0.0	0.023	9877	9101	400m.pg151_o2_nofp.cx7_gcp_c2s60_4g
9885	207861	0	0.0	19515.0	221.4	0.000	0.000	1.974	22.936	704115	64.3	3.387	93	176.0	242.8	0.0	0.028	10213	9477	400m.pg151_o3.cx7_gcp_c2s60_4g
9885	208185	0	0.0	19516.8	221.6	0.000	0.000	1.974	22.956	705618	64.3	3.389	93	176.0	244.0	0.0	0.119	10277	9477	400m.pg151_o3_native.cx7_gcp_c2s60_4g
9885	216467	0	0.0	19518.5	222.8	0.000	0.000	1.975	23.078	731604	64.3	3.380	89	176.0	247.4	0.0	0.027	10532	9738	400m.pg151_o3_native_lto.cx7_gcp_c2s60_4g
q1000.1
q1000.1: range queries with 1000 insert/s per client
Performance metrics for all DBMS, not just the ones listed above. Some are normalized by throughput, others are not. Legend for results is here.
ips	qps	rps	rmbps	wps	wmbps	rpq	rkbpq	wpi	wkbpi	csps	cpups	cspq	cpupq	dbgb1	dbgb2	rss	maxop	p50	p99	tag
19769	217935	0	0.0	38128.6	397.8	0.000	0.000	1.929	20.606	689255	66.9	3.163	92	189.4	261.4	0.0	0.145	10661	9357	400m.pg151_def.cx7_gcp_c2s60_4g
19769	214672	0	0.0	38089.5	397.5	0.000	0.000	1.927	20.587	680269	66.7	3.169	93	189.4	261.4	0.0	0.071	10500	9254	400m.pg151_o2_nofp.cx7_gcp_c2s60_4g
19769	221283	0	0.0	38114.9	397.1	0.000	0.000	1.928	20.571	700496	66.7	3.166	90	189.4	261.4	0.0	0.040	10916	9637	400m.pg151_o3.cx7_gcp_c2s60_4g
19780	221331	0	0.0	38210.9	396.6	0.000	0.000	1.932	20.531	702013	66.7	3.172	90	189.4	261.4	0.0	0.066	10932	9637	400m.pg151_o3_native.cx7_gcp_c2s60_4g
19769	230002	0	0.0	38217.0	393.9	0.000	0.000	1.933	20.402	730673	66.4	3.177	87	189.4	261.4	0.0	0.050	11268	9861	400m.pg151_o3_native_lto.cx7_gcp_c2s60_4g
l.i0
- l.i0: load without secondary indexes
- Legend for results is here.
- Each entry lists the percentage of responses that fit in that bucket (slower than max time for previous bucket, faster than min time for next bucket).
Insert response time histogram
256us	1ms	4ms	16ms	64ms	256ms	1s	4s	16s	gt	max	tag
0.000	20.808	76.340	2.796	0.018	0.030	0.009	0.000	0.000	0.000	0.571	pg151_def.cx7_gcp_c2s60_4g
0.000	18.086	79.084	2.774	0.015	0.029	0.011	0.001	0.000	0.000	1.007	pg151_o2_nofp.cx7_gcp_c2s60_4g
0.000	23.465	73.936	2.537	0.021	0.031	0.010	0.000	0.000	0.000	0.468	pg151_o3.cx7_gcp_c2s60_4g
0.000	22.885	74.239	2.813	0.024	0.030	0.009	0.000	0.000	0.000	0.661	pg151_o3_native.cx7_gcp_c2s60_4g
0.000	31.368	66.117	2.463	0.019	0.025	0.008	0.000	0.000	0.000	0.366	pg151_o3_native_lto.cx7_gcp_c2s60_4g
l.x
- l.x: create secondary indexes
- Legend for results is here.
- Each entry lists the percentage of responses that fit in that bucket (slower than max time for previous bucket, faster than min time for next bucket).
TODO - determine whether there is data for create index response time
l.i1
- l.i1: continue load after secondary indexes created
- Legend for results is here.
- Each entry lists the percentage of responses that fit in that bucket (slower than max time for previous bucket, faster than min time for next bucket).
Insert response time histogram
256us	1ms	4ms	16ms	64ms	256ms	1s	4s	16s	gt	max	tag
0.000	0.000	85.095	11.965	2.224	0.690	0.026	0.000	0.000	0.000	0.629	pg151_def.cx7_gcp_c2s60_4g
0.000	0.000	84.665	12.436	2.226	0.642	0.030	0.000	0.000	0.000	0.935	pg151_o2_nofp.cx7_gcp_c2s60_4g
0.000	0.000	85.499	11.546	2.243	0.687	0.025	nonzero	0.000	0.000	1.268	pg151_o3.cx7_gcp_c2s60_4g
0.000	0.000	85.870	11.070	2.360	0.673	0.027	0.000	0.000	0.000	0.837	pg151_o3_native.cx7_gcp_c2s60_4g
0.000	0.000	87.176	9.691	2.396	0.711	0.026	0.000	0.000	0.000	0.648	pg151_o3_native_lto.cx7_gcp_c2s60_4g
q100.1
- q100.1: range queries with 100 insert/s per client
- Legend for results is here.
- Each entry lists the percentage of responses that fit in that bucket (slower than max time for previous bucket, faster than min time for next bucket).
Query response time histogram
256us	1ms	4ms	16ms	64ms	256ms	1s	4s	16s	gt	max	tag
99.973	0.020	0.006	0.001	nonzero	0.000	0.000	0.000	0.000	0.000	0.024	pg151_def.cx7_gcp_c2s60_4g
99.970	0.023	0.006	0.001	nonzero	0.000	0.000	0.000	0.000	0.000	0.021	pg151_o2_nofp.cx7_gcp_c2s60_4g
99.976	0.017	0.006	0.001	nonzero	0.000	0.000	0.000	0.000	0.000	0.023	pg151_o3.cx7_gcp_c2s60_4g
99.975	0.018	0.006	0.001	nonzero	0.000	0.000	0.000	0.000	0.000	0.042	pg151_o3_native.cx7_gcp_c2s60_4g
99.978	0.015	0.006	0.001	nonzero	0.000	0.000	0.000	0.000	0.000	0.024	pg151_o3_native_lto.cx7_gcp_c2s60_4g
Insert response time histogram
256us	1ms	4ms	16ms	64ms	256ms	1s	4s	16s	gt	max	tag
0.000	0.000	97.746	2.104	0.129	0.021	0.000	0.000	0.000	0.000	0.160	pg151_def.cx7_gcp_c2s60_4g
0.000	0.000	97.801	2.033	0.129	0.018	0.018	0.000	0.000	0.000	0.312	pg151_o2_nofp.cx7_gcp_c2s60_4g
0.000	0.000	97.578	2.242	0.181	0.000	0.000	0.000	0.000	0.000	0.056	pg151_o3.cx7_gcp_c2s60_4g
0.000	0.000	96.685	2.796	0.517	0.003	0.000	0.000	0.000	0.000	0.065	pg151_o3_native.cx7_gcp_c2s60_4g
0.000	0.000	98.401	1.499	0.088	0.001	0.011	0.000	0.000	0.000	0.318	pg151_o3_native_lto.cx7_gcp_c2s60_4g
q500.1
- q500.1: range queries with 500 insert/s per client
- Legend for results is here.
- Each entry lists the percentage of responses that fit in that bucket (slower than max time for previous bucket, faster than min time for next bucket).
Query response time histogram
256us	1ms	4ms	16ms	64ms	256ms	1s	4s	16s	gt	max	tag
99.879	0.087	0.031	0.002	nonzero	0.000	0.000	0.000	0.000	0.000	0.027	pg151_def.cx7_gcp_c2s60_4g
99.870	0.095	0.033	0.002	nonzero	0.000	0.000	0.000	0.000	0.000	0.023	pg151_o2_nofp.cx7_gcp_c2s60_4g
99.881	0.086	0.031	0.002	nonzero	0.000	0.000	0.000	0.000	0.000	0.028	pg151_o3.cx7_gcp_c2s60_4g
99.880	0.087	0.031	0.002	nonzero	nonzero	0.000	0.000	0.000	0.000	0.119	pg151_o3_native.cx7_gcp_c2s60_4g
99.889	0.080	0.029	0.002	nonzero	0.000	0.000	0.000	0.000	0.000	0.027	pg151_o3_native_lto.cx7_gcp_c2s60_4g
Insert response time histogram
256us	1ms	4ms	16ms	64ms	256ms	1s	4s	16s	gt	max	tag
0.000	0.000	45.869	40.045	14.016	0.071	0.000	0.000	0.000	0.000	0.145	pg151_def.cx7_gcp_c2s60_4g
0.000	0.000	44.721	41.182	14.042	0.055	0.000	0.000	0.000	0.000	0.122	pg151_o2_nofp.cx7_gcp_c2s60_4g
0.000	0.000	45.136	41.237	13.573	0.054	0.000	0.000	0.000	0.000	0.154	pg151_o3.cx7_gcp_c2s60_4g
0.000	0.000	45.612	40.340	13.980	0.069	0.000	0.000	0.000	0.000	0.162	pg151_o3_native.cx7_gcp_c2s60_4g
0.000	0.000	44.827	40.126	14.984	0.063	0.000	0.000	0.000	0.000	0.251	pg151_o3_native_lto.cx7_gcp_c2s60_4g
q1000.1
- q1000.1: range queries with 1000 insert/s per client
- Legend for results is here.
- Each entry lists the percentage of responses that fit in that bucket (slower than max time for previous bucket, faster than min time for next bucket).
Query response time histogram
256us	1ms	4ms	16ms	64ms	256ms	1s	4s	16s	gt	max	tag
99.778	0.172	0.048	0.003	nonzero	nonzero	0.000	0.000	0.000	0.000	0.145	pg151_def.cx7_gcp_c2s60_4g
99.757	0.189	0.051	0.003	nonzero	nonzero	0.000	0.000	0.000	0.000	0.071	pg151_o2_nofp.cx7_gcp_c2s60_4g
99.776	0.174	0.047	0.003	nonzero	0.000	0.000	0.000	0.000	0.000	0.040	pg151_o3.cx7_gcp_c2s60_4g
99.773	0.177	0.046	0.003	nonzero	nonzero	0.000	0.000	0.000	0.000	0.066	pg151_o3_native.cx7_gcp_c2s60_4g
99.783	0.169	0.045	0.003	nonzero	0.000	0.000	0.000	0.000	0.000	0.050	pg151_o3_native_lto.cx7_gcp_c2s60_4g
Insert response time histogram
256us	1ms	4ms	16ms	64ms	256ms	1s	4s	16s	gt	max	tag
0.000	0.000	44.407	46.319	9.069	0.203	0.003	0.000	0.000	0.000	0.316	pg151_def.cx7_gcp_c2s60_4g
0.000	0.000	43.125	47.552	9.094	0.229	nonzero	0.000	0.000	0.000	0.293	pg151_o2_nofp.cx7_gcp_c2s60_4g
0.000	0.000	43.153	47.321	9.308	0.216	0.002	0.000	0.000	0.000	0.407	pg151_o3.cx7_gcp_c2s60_4g
0.000	0.000	44.494	46.500	8.816	0.189	0.001	0.000	0.000	0.000	0.370	pg151_o3_native.cx7_gcp_c2s60_4g
0.000	0.000	44.460	46.598	8.746	0.195	0.000	0.000	0.000	0.000	0.217	pg151_o3_native_lto.cx7_gcp_c2s60_4g