Introduction
This is a report for the insert benchmark with 400M docs and 20 client(s). It is generated by scripts (bash, awk, sed) and Tufte might not be impressed. An overview of the insert benchmark is here and a short update is here. Below, by DBMS, I mean DBMS+version.config. An example is my8020.c10b40 where my means MySQL, 8020 is version 8.0.20 and c10b40 is the name for the configuration file.
The test server is c2-standard-60 from GCP with 30 cores, hyperthreads disabled, 240G RAM and 3T of NVMe (XFS with RAID0 over 8 devices). The benchmark was run with 20 clients and there were 1 or 2 connections per client (1 for queries, 1 for inserts). It uses 20 tables with a client per table. It loads 20M rows per table without secondary indexes, creates secondary indexes, loads another 20M rows per table then does 3 read+write tests for one hour each that do queries as fast as possible with 100, 500 and then 1000 writes/second/client concurrent with the queries. The database is cached by the storage engine and the only IO is for writes. Clients and the DBMS share one server. The per-database configs are in the per-database subdirectories here.
The tested DBMS are:
- pg151_def.cx7a_gcp_c2s60 - Postgres 15.1, the cx7a_gcp_c2s60 config and the build used: -O2
- pg151_o2_nofp.cx7a_gcp_c2s60 - Postgres 15.1, the cx7a_gcp_c2s60 config and the build used: -O2 -no-omit-frame-pointer
- pg151_o3.cx7a_gcp_c2s60 - Postgres 15.1, the cx7a_gcp_c2s60 config and the build used: -O3
- pg151_o3_native.cx7a_gcp_c2s60 - Postgres 15.1, the cx7a_gcp_c2s60 config and the build used: -O3 -march=native -mtune=native
- pg151_o3_native_lto.cx7a_gcp_c2s60 - Postgres 15.1, the cx7a_gcp_c2s60 config and the build used: -O3 -march=native -mtune=native and -flto
Contents
- Summary
- l.i0: load without secondary indexes
- l.x: create secondary indexes
- l.i1: continue load after secondary indexes created
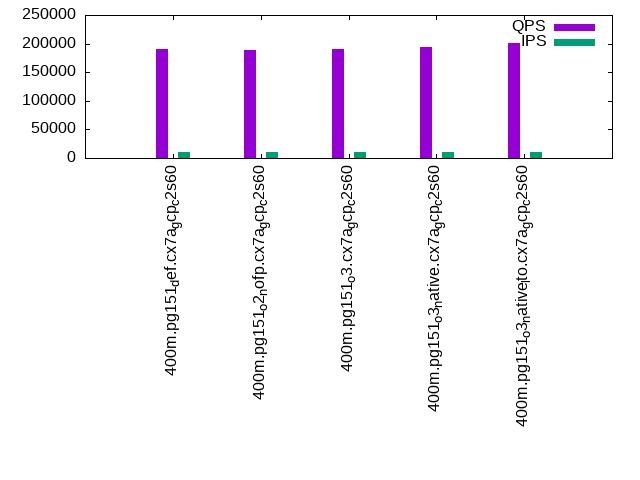
- q100.1: range queries with 100 insert/s per client
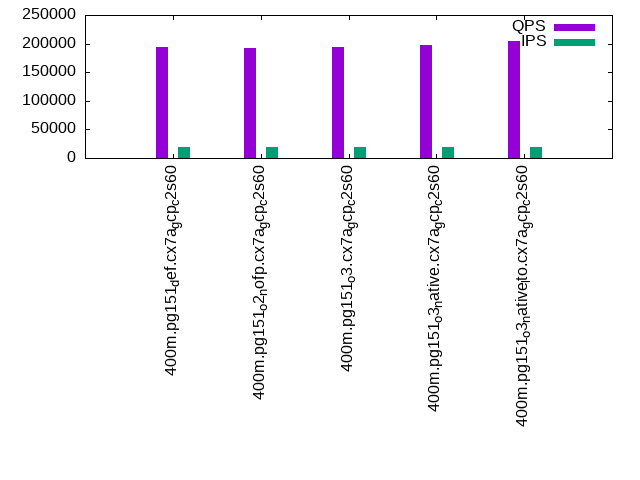
- q500.1: range queries with 500 insert/s per client
- q1000.1: range queries with 1000 insert/s per client
Summary
The numbers are inserts/s for l.i0 and l.i1, indexed docs (or rows) /s for l.x and queries/s for q*.2. The values are the average rate over the entire test for inserts (IPS) and queries (QPS). The range of values for IPS and QPS is split into 3 parts: bottom 25%, middle 50%, top 25%. Values in the bottom 25% have a red background, values in the top 25% have a green background and values in the middle have no color. A gray background is used for values that can be ignored because the DBMS did not sustain the target insert rate. Red backgrounds are not used when the minimum value is within 80% of the max value.
| dbms | l.i0 | l.x | l.i1 | q100.1 | q500.1 | q1000.1 |
|---|---|---|---|---|---|---|
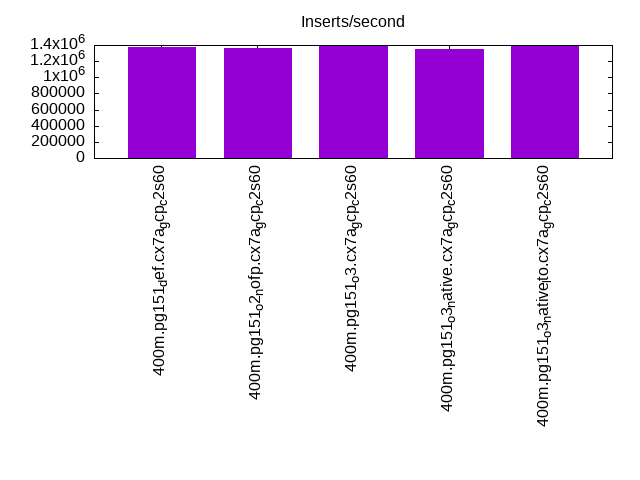
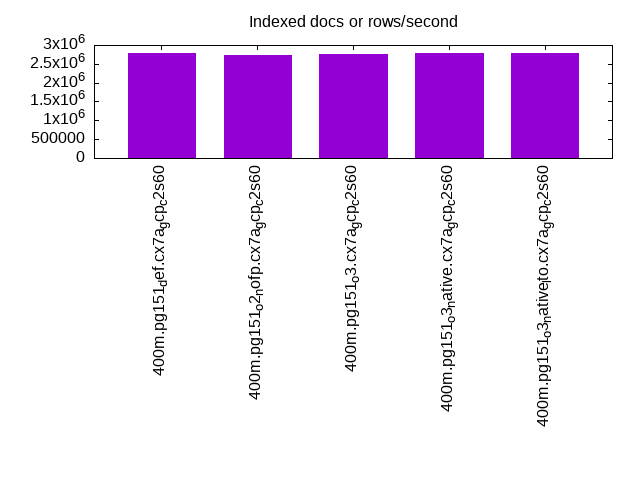
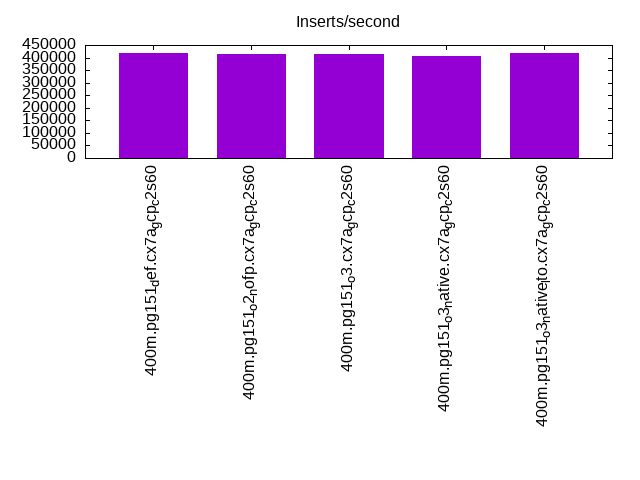
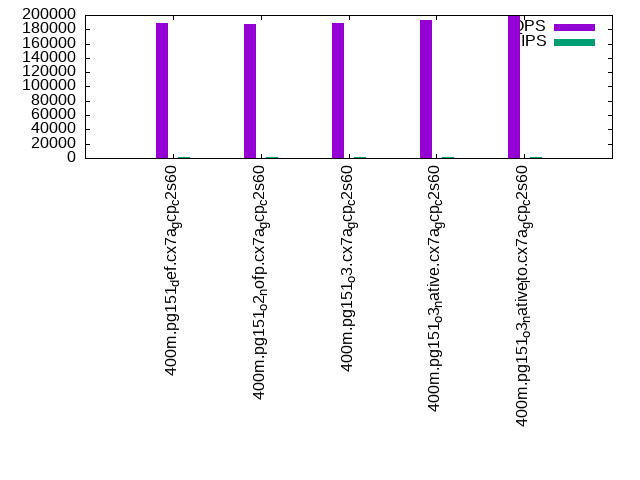
| 400m.pg151_def.cx7a_gcp_c2s60 | 1379310 | 2778472 | 417973 | 189206 | 191359 | 194148 |
| 400m.pg151_o2_nofp.cx7a_gcp_c2s60 | 1360544 | 2740411 | 414079 | 186923 | 189093 | 192099 |
| 400m.pg151_o3.cx7a_gcp_c2s60 | 1388889 | 2759310 | 415369 | 189346 | 191050 | 194306 |
| 400m.pg151_o3_native.cx7a_gcp_c2s60 | 1346801 | 2797902 | 406091 | 192452 | 193368 | 197769 |
| 400m.pg151_o3_native_lto.cx7a_gcp_c2s60 | 1393728 | 2778472 | 416233 | 197942 | 200354 | 203691 |
This table has relative throughput, throughput for the DBMS relative to the DBMS in the first line, using the absolute throughput from the previous table.
| dbms | l.i0 | l.x | l.i1 | q100.1 | q500.1 | q1000.1 |
|---|---|---|---|---|---|---|
| 400m.pg151_def.cx7a_gcp_c2s60 | 1.00 | 1.00 | 1.00 | 1.00 | 1.00 | 1.00 |
| 400m.pg151_o2_nofp.cx7a_gcp_c2s60 | 0.99 | 0.99 | 0.99 | 0.99 | 0.99 | 0.99 |
| 400m.pg151_o3.cx7a_gcp_c2s60 | 1.01 | 0.99 | 0.99 | 1.00 | 1.00 | 1.00 |
| 400m.pg151_o3_native.cx7a_gcp_c2s60 | 0.98 | 1.01 | 0.97 | 1.02 | 1.01 | 1.02 |
| 400m.pg151_o3_native_lto.cx7a_gcp_c2s60 | 1.01 | 1.00 | 1.00 | 1.05 | 1.05 | 1.05 |
This lists the average rate of inserts/s for the tests that do inserts concurrent with queries. For such tests the query rate is listed in the table above. The read+write tests are setup so that the insert rate should match the target rate every second. Cells that are not at least 95% of the target have a red background to indicate a failure to satisfy the target.
| dbms | q100.1 | q500.1 | q1000.1 |
|---|---|---|---|
| pg151_def.cx7a_gcp_c2s60 | 1976 | 9885 | 19769 |
| pg151_o2_nofp.cx7a_gcp_c2s60 | 1976 | 9885 | 19769 |
| pg151_o3.cx7a_gcp_c2s60 | 1976 | 9885 | 19769 |
| pg151_o3_native.cx7a_gcp_c2s60 | 1976 | 9885 | 19769 |
| pg151_o3_native_lto.cx7a_gcp_c2s60 | 1976 | 9885 | 19769 |
| target | 2000 | 10000 | 20000 |
l.i0
l.i0: load without secondary indexes. Graphs for performance per 1-second interval are here.
Average throughput:
Insert response time histogram: each cell has the percentage of responses that take <= the time in the header and max is the max response time in seconds. For the max column values in the top 25% of the range have a red background and in the bottom 25% of the range have a green background. The red background is not used when the min value is within 80% of the max value.
| dbms | 256us | 1ms | 4ms | 16ms | 64ms | 256ms | 1s | 4s | 16s | gt | max |
|---|---|---|---|---|---|---|---|---|---|---|---|
| pg151_def.cx7a_gcp_c2s60 | 59.201 | 39.831 | 0.914 | 0.026 | 0.021 | 0.008 | 0.710 | ||||
| pg151_o2_nofp.cx7a_gcp_c2s60 | 57.818 | 41.213 | 0.918 | 0.019 | 0.024 | 0.009 | 0.632 | ||||
| pg151_o3.cx7a_gcp_c2s60 | 59.411 | 39.646 | 0.895 | 0.018 | 0.022 | 0.008 | 0.592 | ||||
| pg151_o3_native.cx7a_gcp_c2s60 | 55.631 | 43.448 | 0.868 | 0.023 | 0.022 | 0.009 | 0.921 | ||||
| pg151_o3_native_lto.cx7a_gcp_c2s60 | 57.634 | 41.520 | 0.796 | 0.022 | 0.019 | 0.009 | 0.001 | 1.104 |
Performance metrics for the DBMS listed above. Some are normalized by throughput, others are not. Legend for results is here.
ips	qps	rps	rmbps	wps	wmbps	rpq	rkbpq	wpi	wkbpi	csps	cpups	cspq	cpupq	dbgb1	dbgb2	rss	maxop	p50	p99	tag
1379310	0	0	0.0	1753.1	464.4	0.000	0.000	0.001	0.345	225502	60.7	0.163	13	38.3	103.4	0.0	0.710	76980	23774	400m.pg151_def.cx7a_gcp_c2s60
1360544	0	0	0.0	1777.3	460.6	0.000	0.000	0.001	0.347	229241	60.6	0.168	13	38.3	103.6	NA	0.632	76346	21576	400m.pg151_o2_nofp.cx7a_gcp_c2s60
1388889	0	0	0.0	1806.6	472.2	0.000	0.000	0.001	0.348	229343	61.0	0.165	13	38.3	103.4	0.0	0.592	78114	24772	400m.pg151_o3.cx7a_gcp_c2s60
1346801	0	0	0.0	1790.5	460.8	0.000	0.000	0.001	0.350	259753	59.7	0.193	13	38.3	104.1	NA	0.921	75418	20480	400m.pg151_o3_native.cx7a_gcp_c2s60
1393728	0	0	0.0	1787.3	468.2	0.000	0.000	0.001	0.344	257420	60.1	0.185	13	38.3	103.4	0.0	1.104	77915	19286	400m.pg151_o3_native_lto.cx7a_gcp_c2s60
l.x
l.x: create secondary indexes.
Average throughput:
Performance metrics for the DBMS listed above. Some are normalized by throughput, others are not. Legend for results is here.
ips	qps	rps	rmbps	wps	wmbps	rpq	rkbpq	wpi	wkbpi	csps	cpups	cspq	cpupq	dbgb1	dbgb2	rss	maxop	p50	p99	tag
2778472	0	0	0.0	3150.2	831.0	0.000	0.000	0.001	0.306	110931	27.0	0.040	3	73.5	172.1	0.0	0.092	NA	NA	400m.pg151_def.cx7a_gcp_c2s60
2740411	0	0	0.0	3137.4	822.6	0.000	0.000	0.001	0.307	110036	26.5	0.040	3	73.5	172.9	0.0	0.119	NA	NA	400m.pg151_o2_nofp.cx7a_gcp_c2s60
2759310	0	0	0.0	3105.6	806.8	0.000	0.000	0.001	0.299	107887	26.3	0.039	3	73.5	171.6	0.0	0.092	NA	NA	400m.pg151_o3.cx7a_gcp_c2s60
2797902	0	0	0.0	3122.9	826.4	0.000	0.000	0.001	0.302	111720	26.4	0.040	3	73.5	173.2	0.0	0.039	NA	NA	400m.pg151_o3_native.cx7a_gcp_c2s60
2778472	0	0	0.0	3129.8	810.7	0.000	0.000	0.001	0.299	110496	26.0	0.040	3	73.5	171.7	0.0	0.175	NA	NA	400m.pg151_o3_native_lto.cx7a_gcp_c2s60
l.i1
l.i1: continue load after secondary indexes created. Graphs for performance per 1-second interval are here.
Average throughput:
Insert response time histogram: each cell has the percentage of responses that take <= the time in the header and max is the max response time in seconds. For the max column values in the top 25% of the range have a red background and in the bottom 25% of the range have a green background. The red background is not used when the min value is within 80% of the max value.
| dbms | 256us | 1ms | 4ms | 16ms | 64ms | 256ms | 1s | 4s | 16s | gt | max |
|---|---|---|---|---|---|---|---|---|---|---|---|
| pg151_def.cx7a_gcp_c2s60 | nonzero | 96.375 | 2.520 | 1.059 | 0.028 | 0.018 | nonzero | 1.119 | |||
| pg151_o2_nofp.cx7a_gcp_c2s60 | 96.420 | 2.459 | 1.074 | 0.034 | 0.013 | nonzero | 1.050 | ||||
| pg151_o3.cx7a_gcp_c2s60 | nonzero | 96.301 | 2.542 | 1.112 | 0.033 | 0.012 | nonzero | 1.153 | |||
| pg151_o3_native.cx7a_gcp_c2s60 | nonzero | 96.216 | 2.639 | 1.095 | 0.037 | 0.012 | nonzero | 1.042 | |||
| pg151_o3_native_lto.cx7a_gcp_c2s60 | 0.003 | 96.248 | 2.610 | 1.092 | 0.036 | 0.011 | nonzero | 1.045 |
Performance metrics for the DBMS listed above. Some are normalized by throughput, others are not. Legend for results is here.
ips	qps	rps	rmbps	wps	wmbps	rpq	rkbpq	wpi	wkbpi	csps	cpups	cspq	cpupq	dbgb1	dbgb2	rss	maxop	p50	p99	tag
417973	0	2428	16.1	4686.7	541.6	0.006	0.040	0.011	1.327	283378	53.6	0.678	38	163.3	347.0	NA	1.119	25872	1998	400m.pg151_def.cx7a_gcp_c2s60
414079	0	2279	16.0	4700.2	536.3	0.006	0.040	0.011	1.326	268674	54.4	0.649	39	163.3	347.9	0.0	1.050	25572	2049	400m.pg151_o2_nofp.cx7a_gcp_c2s60
415369	0	2297	17.0	4759.2	547.3	0.006	0.042	0.011	1.349	289812	53.5	0.698	39	163.3	347.7	NA	1.153	25772	1948	400m.pg151_o3.cx7a_gcp_c2s60
406091	0	2516	15.9	4959.8	536.1	0.006	0.040	0.012	1.352	331435	52.8	0.816	39	163.3	348.1	0.0	1.042	25022	1748	400m.pg151_o3_native.cx7a_gcp_c2s60
416233	0	2745	16.6	4710.3	546.7	0.007	0.041	0.011	1.345	313216	52.4	0.753	38	163.3	348.6	0.0	1.045	25871	2198	400m.pg151_o3_native_lto.cx7a_gcp_c2s60
q100.1
q100.1: range queries with 100 insert/s per client. Graphs for performance per 1-second interval are here.
Average throughput:
Query response time histogram: each cell has the percentage of responses that take <= the time in the header and max is the max response time in seconds. For max values in the top 25% of the range have a red background and in the bottom 25% of the range have a green background. The red background is not used when the min value is within 80% of the max value.
| dbms | 256us | 1ms | 4ms | 16ms | 64ms | 256ms | 1s | 4s | 16s | gt | max |
|---|---|---|---|---|---|---|---|---|---|---|---|
| pg151_def.cx7a_gcp_c2s60 | 99.905 | 0.088 | 0.006 | 0.001 | nonzero | 0.027 | |||||
| pg151_o2_nofp.cx7a_gcp_c2s60 | 99.901 | 0.091 | 0.006 | 0.001 | nonzero | 0.026 | |||||
| pg151_o3.cx7a_gcp_c2s60 | 99.905 | 0.087 | 0.006 | 0.001 | nonzero | nonzero | 0.074 | ||||
| pg151_o3_native.cx7a_gcp_c2s60 | 99.909 | 0.083 | 0.006 | 0.001 | nonzero | 0.027 | |||||
| pg151_o3_native_lto.cx7a_gcp_c2s60 | 99.917 | 0.076 | 0.006 | 0.001 | nonzero | nonzero | 0.201 |
Insert response time histogram: each cell has the percentage of responses that take <= the time in the header and max is the max response time in seconds. For max values in the top 25% of the range have a red background and in the bottom 25% of the range have a green background. The red background is not used when the min value is within 80% of the max value.
| dbms | 256us | 1ms | 4ms | 16ms | 64ms | 256ms | 1s | 4s | 16s | gt | max |
|---|---|---|---|---|---|---|---|---|---|---|---|
| pg151_def.cx7a_gcp_c2s60 | 95.414 | 3.919 | 0.651 | 0.015 | 0.131 | ||||||
| pg151_o2_nofp.cx7a_gcp_c2s60 | 95.415 | 3.740 | 0.819 | 0.025 | 0.197 | ||||||
| pg151_o3.cx7a_gcp_c2s60 | 93.342 | 5.244 | 1.382 | 0.017 | 0.015 | 0.305 | |||||
| pg151_o3_native.cx7a_gcp_c2s60 | 92.468 | 5.847 | 1.685 | 0.059 | |||||||
| pg151_o3_native_lto.cx7a_gcp_c2s60 | 95.233 | 4.078 | 0.689 | 0.036 |
Performance metrics for the DBMS listed above. Some are normalized by throughput, others are not. Legend for results is here.
ips	qps	rps	rmbps	wps	wmbps	rpq	rkbpq	wpi	wkbpi	csps	cpups	cspq	cpupq	dbgb1	dbgb2	rss	maxop	p50	p99	tag
1976	189206	170	1.6	3453.6	82.2	0.001	0.009	1.748	42.610	673627	62.6	3.560	99	163.9	318.2	0.0	0.027	9445	9046	400m.pg151_def.cx7a_gcp_c2s60
1976	186923	165	1.5	3465.4	81.5	0.001	0.008	1.754	42.227	667522	63.0	3.571	101	163.9	320.3	0.0	0.026	9321	8949	400m.pg151_o2_nofp.cx7a_gcp_c2s60
1976	189346	164	1.6	3460.2	82.8	0.001	0.008	1.751	42.930	675923	62.7	3.570	99	163.9	321.4	0.0	0.074	9398	9046	400m.pg151_o3.cx7a_gcp_c2s60
1976	192452	160	1.4	3420.1	82.7	0.001	0.008	1.731	42.868	685853	62.7	3.564	98	163.9	311.9	0.0	0.027	9525	9158	400m.pg151_o3_native.cx7a_gcp_c2s60
1976	197942	168	1.6	3460.3	82.0	0.001	0.008	1.751	42.479	704632	63.0	3.560	95	163.9	320.1	0.0	0.201	9797	9414	400m.pg151_o3_native_lto.cx7a_gcp_c2s60
q500.1
q500.1: range queries with 500 insert/s per client. Graphs for performance per 1-second interval are here.
Average throughput:
Query response time histogram: each cell has the percentage of responses that take <= the time in the header and max is the max response time in seconds. For max values in the top 25% of the range have a red background and in the bottom 25% of the range have a green background. The red background is not used when the min value is within 80% of the max value.
| dbms | 256us | 1ms | 4ms | 16ms | 64ms | 256ms | 1s | 4s | 16s | gt | max |
|---|---|---|---|---|---|---|---|---|---|---|---|
| pg151_def.cx7a_gcp_c2s60 | 99.904 | 0.063 | 0.029 | 0.004 | nonzero | 0.047 | |||||
| pg151_o2_nofp.cx7a_gcp_c2s60 | 99.899 | 0.067 | 0.030 | 0.004 | nonzero | 0.043 | |||||
| pg151_o3.cx7a_gcp_c2s60 | 99.901 | 0.066 | 0.029 | 0.004 | nonzero | 0.052 | |||||
| pg151_o3_native.cx7a_gcp_c2s60 | 99.905 | 0.062 | 0.029 | 0.004 | nonzero | nonzero | 0.069 | ||||
| pg151_o3_native_lto.cx7a_gcp_c2s60 | 99.912 | 0.056 | 0.028 | 0.004 | nonzero | 0.049 |
Insert response time histogram: each cell has the percentage of responses that take <= the time in the header and max is the max response time in seconds. For max values in the top 25% of the range have a red background and in the bottom 25% of the range have a green background. The red background is not used when the min value is within 80% of the max value.
| dbms | 256us | 1ms | 4ms | 16ms | 64ms | 256ms | 1s | 4s | 16s | gt | max |
|---|---|---|---|---|---|---|---|---|---|---|---|
| pg151_def.cx7a_gcp_c2s60 | 44.712 | 25.267 | 28.882 | 1.139 | 0.233 | ||||||
| pg151_o2_nofp.cx7a_gcp_c2s60 | 44.531 | 25.522 | 28.791 | 1.156 | nonzero | 0.273 | |||||
| pg151_o3.cx7a_gcp_c2s60 | 44.551 | 25.048 | 29.167 | 1.229 | 0.006 | 0.485 | |||||
| pg151_o3_native.cx7a_gcp_c2s60 | 45.206 | 25.333 | 28.340 | 1.121 | 0.172 | ||||||
| pg151_o3_native_lto.cx7a_gcp_c2s60 | 45.118 | 24.665 | 28.994 | 1.223 | 0.230 |
Performance metrics for the DBMS listed above. Some are normalized by throughput, others are not. Legend for results is here.
ips	qps	rps	rmbps	wps	wmbps	rpq	rkbpq	wpi	wkbpi	csps	cpups	cspq	cpupq	dbgb1	dbgb2	rss	maxop	p50	p99	tag
9885	191359	2	0.0	6397.3	194.3	0.000	0.000	0.647	20.126	668864	64.0	3.495	100	167.4	274.2	0.0	0.047	9398	8906	400m.pg151_def.cx7a_gcp_c2s60
9885	189093	6	0.1	6335.0	192.4	0.000	0.000	0.641	19.933	660874	63.9	3.495	101	167.5	271.6	0.0	0.043	9462	8998	400m.pg151_o2_nofp.cx7a_gcp_c2s60
9885	191050	18	0.1	6394.4	195.0	0.000	0.001	0.647	20.204	668357	64.1	3.498	101	167.4	272.1	0.0	0.052	9477	8982	400m.pg151_o3.cx7a_gcp_c2s60
9885	193368	11	0.1	6137.0	189.5	0.000	0.000	0.621	19.634	676563	64.1	3.499	99	167.4	270.6	0.0	0.069	9557	9062	400m.pg151_o3_native.cx7a_gcp_c2s60
9885	200354	6	0.1	6400.4	194.1	0.000	0.000	0.648	20.103	698395	63.9	3.486	96	167.4	274.9	0.0	0.049	9877	9350	400m.pg151_o3_native_lto.cx7a_gcp_c2s60
q1000.1
q1000.1: range queries with 1000 insert/s per client. Graphs for performance per 1-second interval are here.
Average throughput:
Query response time histogram: each cell has the percentage of responses that take <= the time in the header and max is the max response time in seconds. For max values in the top 25% of the range have a red background and in the bottom 25% of the range have a green background. The red background is not used when the min value is within 80% of the max value.
| dbms | 256us | 1ms | 4ms | 16ms | 64ms | 256ms | 1s | 4s | 16s | gt | max |
|---|---|---|---|---|---|---|---|---|---|---|---|
| pg151_def.cx7a_gcp_c2s60 | 99.837 | 0.111 | 0.044 | 0.007 | nonzero | nonzero | 0.075 | ||||
| pg151_o2_nofp.cx7a_gcp_c2s60 | 99.831 | 0.116 | 0.045 | 0.007 | nonzero | 0.044 | |||||
| pg151_o3.cx7a_gcp_c2s60 | 99.834 | 0.113 | 0.045 | 0.007 | nonzero | nonzero | 0.078 | ||||
| pg151_o3_native.cx7a_gcp_c2s60 | 99.839 | 0.109 | 0.044 | 0.007 | nonzero | nonzero | 0.145 | ||||
| pg151_o3_native_lto.cx7a_gcp_c2s60 | 99.850 | 0.101 | 0.042 | 0.007 | nonzero | 0.058 |
Insert response time histogram: each cell has the percentage of responses that take <= the time in the header and max is the max response time in seconds. For max values in the top 25% of the range have a red background and in the bottom 25% of the range have a green background. The red background is not used when the min value is within 80% of the max value.
| dbms | 256us | 1ms | 4ms | 16ms | 64ms | 256ms | 1s | 4s | 16s | gt | max |
|---|---|---|---|---|---|---|---|---|---|---|---|
| pg151_def.cx7a_gcp_c2s60 | 57.336 | 22.654 | 19.230 | 0.780 | 0.217 | ||||||
| pg151_o2_nofp.cx7a_gcp_c2s60 | 57.521 | 23.286 | 18.441 | 0.751 | 0.211 | ||||||
| pg151_o3.cx7a_gcp_c2s60 | 57.302 | 22.813 | 19.041 | 0.845 | 0.210 | ||||||
| pg151_o3_native.cx7a_gcp_c2s60 | 56.685 | 23.197 | 19.285 | 0.834 | 0.210 | ||||||
| pg151_o3_native_lto.cx7a_gcp_c2s60 | 57.634 | 22.750 | 18.822 | 0.794 | 0.199 |
Performance metrics for the DBMS listed above. Some are normalized by throughput, others are not. Legend for results is here.
ips	qps	rps	rmbps	wps	wmbps	rpq	rkbpq	wpi	wkbpi	csps	cpups	cspq	cpupq	dbgb1	dbgb2	rss	maxop	p50	p99	tag
19769	194148	52	0.4	6294.3	264.3	0.000	0.002	0.318	13.693	659049	65.1	3.395	101	179.6	280.0	0.0	0.075	9669	8842	400m.pg151_def.cx7a_gcp_c2s60
19769	192099	53	0.4	6302.3	264.2	0.000	0.002	0.319	13.685	650902	65.3	3.388	102	179.6	280.3	0.0	0.044	9546	8701	400m.pg151_o2_nofp.cx7a_gcp_c2s60
19769	194306	76	0.6	6291.9	263.1	0.000	0.003	0.318	13.627	659582	65.1	3.395	101	179.6	280.7	0.0	0.078	9674	8859	400m.pg151_o3.cx7a_gcp_c2s60
19769	197769	69	0.5	6347.5	268.9	0.000	0.003	0.321	13.927	671159	65.2	3.394	99	179.6	279.6	0.0	0.145	9909	9014	400m.pg151_o3_native.cx7a_gcp_c2s60
19769	203691	63	0.5	6290.9	263.1	0.000	0.002	0.318	13.627	690673	65.2	3.391	96	179.6	280.4	0.0	0.058	10053	9163	400m.pg151_o3_native_lto.cx7a_gcp_c2s60
l.i0
l.i0: load without secondary indexes
Performance metrics for all DBMS, not just the ones listed above. Some are normalized by throughput, others are not. Legend for results is here.
ips	qps	rps	rmbps	wps	wmbps	rpq	rkbpq	wpi	wkbpi	csps	cpups	cspq	cpupq	dbgb1	dbgb2	rss	maxop	p50	p99	tag
1379310	0	0	0.0	1753.1	464.4	0.000	0.000	0.001	0.345	225502	60.7	0.163	13	38.3	103.4	0.0	0.710	76980	23774	400m.pg151_def.cx7a_gcp_c2s60
1360544	0	0	0.0	1777.3	460.6	0.000	0.000	0.001	0.347	229241	60.6	0.168	13	38.3	103.6	NA	0.632	76346	21576	400m.pg151_o2_nofp.cx7a_gcp_c2s60
1388889	0	0	0.0	1806.6	472.2	0.000	0.000	0.001	0.348	229343	61.0	0.165	13	38.3	103.4	0.0	0.592	78114	24772	400m.pg151_o3.cx7a_gcp_c2s60
1346801	0	0	0.0	1790.5	460.8	0.000	0.000	0.001	0.350	259753	59.7	0.193	13	38.3	104.1	NA	0.921	75418	20480	400m.pg151_o3_native.cx7a_gcp_c2s60
1393728	0	0	0.0	1787.3	468.2	0.000	0.000	0.001	0.344	257420	60.1	0.185	13	38.3	103.4	0.0	1.104	77915	19286	400m.pg151_o3_native_lto.cx7a_gcp_c2s60
l.x
l.x: create secondary indexes
Performance metrics for all DBMS, not just the ones listed above. Some are normalized by throughput, others are not. Legend for results is here.
ips	qps	rps	rmbps	wps	wmbps	rpq	rkbpq	wpi	wkbpi	csps	cpups	cspq	cpupq	dbgb1	dbgb2	rss	maxop	p50	p99	tag
2778472	0	0	0.0	3150.2	831.0	0.000	0.000	0.001	0.306	110931	27.0	0.040	3	73.5	172.1	0.0	0.092	NA	NA	400m.pg151_def.cx7a_gcp_c2s60
2740411	0	0	0.0	3137.4	822.6	0.000	0.000	0.001	0.307	110036	26.5	0.040	3	73.5	172.9	0.0	0.119	NA	NA	400m.pg151_o2_nofp.cx7a_gcp_c2s60
2759310	0	0	0.0	3105.6	806.8	0.000	0.000	0.001	0.299	107887	26.3	0.039	3	73.5	171.6	0.0	0.092	NA	NA	400m.pg151_o3.cx7a_gcp_c2s60
2797902	0	0	0.0	3122.9	826.4	0.000	0.000	0.001	0.302	111720	26.4	0.040	3	73.5	173.2	0.0	0.039	NA	NA	400m.pg151_o3_native.cx7a_gcp_c2s60
2778472	0	0	0.0	3129.8	810.7	0.000	0.000	0.001	0.299	110496	26.0	0.040	3	73.5	171.7	0.0	0.175	NA	NA	400m.pg151_o3_native_lto.cx7a_gcp_c2s60
l.i1
l.i1: continue load after secondary indexes created
Performance metrics for all DBMS, not just the ones listed above. Some are normalized by throughput, others are not. Legend for results is here.
ips	qps	rps	rmbps	wps	wmbps	rpq	rkbpq	wpi	wkbpi	csps	cpups	cspq	cpupq	dbgb1	dbgb2	rss	maxop	p50	p99	tag
417973	0	2428	16.1	4686.7	541.6	0.006	0.040	0.011	1.327	283378	53.6	0.678	38	163.3	347.0	NA	1.119	25872	1998	400m.pg151_def.cx7a_gcp_c2s60
414079	0	2279	16.0	4700.2	536.3	0.006	0.040	0.011	1.326	268674	54.4	0.649	39	163.3	347.9	0.0	1.050	25572	2049	400m.pg151_o2_nofp.cx7a_gcp_c2s60
415369	0	2297	17.0	4759.2	547.3	0.006	0.042	0.011	1.349	289812	53.5	0.698	39	163.3	347.7	NA	1.153	25772	1948	400m.pg151_o3.cx7a_gcp_c2s60
406091	0	2516	15.9	4959.8	536.1	0.006	0.040	0.012	1.352	331435	52.8	0.816	39	163.3	348.1	0.0	1.042	25022	1748	400m.pg151_o3_native.cx7a_gcp_c2s60
416233	0	2745	16.6	4710.3	546.7	0.007	0.041	0.011	1.345	313216	52.4	0.753	38	163.3	348.6	0.0	1.045	25871	2198	400m.pg151_o3_native_lto.cx7a_gcp_c2s60
q100.1
q100.1: range queries with 100 insert/s per client
Performance metrics for all DBMS, not just the ones listed above. Some are normalized by throughput, others are not. Legend for results is here.
ips	qps	rps	rmbps	wps	wmbps	rpq	rkbpq	wpi	wkbpi	csps	cpups	cspq	cpupq	dbgb1	dbgb2	rss	maxop	p50	p99	tag
1976	189206	170	1.6	3453.6	82.2	0.001	0.009	1.748	42.610	673627	62.6	3.560	99	163.9	318.2	0.0	0.027	9445	9046	400m.pg151_def.cx7a_gcp_c2s60
1976	186923	165	1.5	3465.4	81.5	0.001	0.008	1.754	42.227	667522	63.0	3.571	101	163.9	320.3	0.0	0.026	9321	8949	400m.pg151_o2_nofp.cx7a_gcp_c2s60
1976	189346	164	1.6	3460.2	82.8	0.001	0.008	1.751	42.930	675923	62.7	3.570	99	163.9	321.4	0.0	0.074	9398	9046	400m.pg151_o3.cx7a_gcp_c2s60
1976	192452	160	1.4	3420.1	82.7	0.001	0.008	1.731	42.868	685853	62.7	3.564	98	163.9	311.9	0.0	0.027	9525	9158	400m.pg151_o3_native.cx7a_gcp_c2s60
1976	197942	168	1.6	3460.3	82.0	0.001	0.008	1.751	42.479	704632	63.0	3.560	95	163.9	320.1	0.0	0.201	9797	9414	400m.pg151_o3_native_lto.cx7a_gcp_c2s60
q500.1
q500.1: range queries with 500 insert/s per client
Performance metrics for all DBMS, not just the ones listed above. Some are normalized by throughput, others are not. Legend for results is here.
ips	qps	rps	rmbps	wps	wmbps	rpq	rkbpq	wpi	wkbpi	csps	cpups	cspq	cpupq	dbgb1	dbgb2	rss	maxop	p50	p99	tag
9885	191359	2	0.0	6397.3	194.3	0.000	0.000	0.647	20.126	668864	64.0	3.495	100	167.4	274.2	0.0	0.047	9398	8906	400m.pg151_def.cx7a_gcp_c2s60
9885	189093	6	0.1	6335.0	192.4	0.000	0.000	0.641	19.933	660874	63.9	3.495	101	167.5	271.6	0.0	0.043	9462	8998	400m.pg151_o2_nofp.cx7a_gcp_c2s60
9885	191050	18	0.1	6394.4	195.0	0.000	0.001	0.647	20.204	668357	64.1	3.498	101	167.4	272.1	0.0	0.052	9477	8982	400m.pg151_o3.cx7a_gcp_c2s60
9885	193368	11	0.1	6137.0	189.5	0.000	0.000	0.621	19.634	676563	64.1	3.499	99	167.4	270.6	0.0	0.069	9557	9062	400m.pg151_o3_native.cx7a_gcp_c2s60
9885	200354	6	0.1	6400.4	194.1	0.000	0.000	0.648	20.103	698395	63.9	3.486	96	167.4	274.9	0.0	0.049	9877	9350	400m.pg151_o3_native_lto.cx7a_gcp_c2s60
q1000.1
q1000.1: range queries with 1000 insert/s per client
Performance metrics for all DBMS, not just the ones listed above. Some are normalized by throughput, others are not. Legend for results is here.
ips	qps	rps	rmbps	wps	wmbps	rpq	rkbpq	wpi	wkbpi	csps	cpups	cspq	cpupq	dbgb1	dbgb2	rss	maxop	p50	p99	tag
19769	194148	52	0.4	6294.3	264.3	0.000	0.002	0.318	13.693	659049	65.1	3.395	101	179.6	280.0	0.0	0.075	9669	8842	400m.pg151_def.cx7a_gcp_c2s60
19769	192099	53	0.4	6302.3	264.2	0.000	0.002	0.319	13.685	650902	65.3	3.388	102	179.6	280.3	0.0	0.044	9546	8701	400m.pg151_o2_nofp.cx7a_gcp_c2s60
19769	194306	76	0.6	6291.9	263.1	0.000	0.003	0.318	13.627	659582	65.1	3.395	101	179.6	280.7	0.0	0.078	9674	8859	400m.pg151_o3.cx7a_gcp_c2s60
19769	197769	69	0.5	6347.5	268.9	0.000	0.003	0.321	13.927	671159	65.2	3.394	99	179.6	279.6	0.0	0.145	9909	9014	400m.pg151_o3_native.cx7a_gcp_c2s60
19769	203691	63	0.5	6290.9	263.1	0.000	0.002	0.318	13.627	690673	65.2	3.391	96	179.6	280.4	0.0	0.058	10053	9163	400m.pg151_o3_native_lto.cx7a_gcp_c2s60
l.i0
- l.i0: load without secondary indexes
- Legend for results is here.
- Each entry lists the percentage of responses that fit in that bucket (slower than max time for previous bucket, faster than min time for next bucket).
Insert response time histogram
256us	1ms	4ms	16ms	64ms	256ms	1s	4s	16s	gt	max	tag
0.000	59.201	39.831	0.914	0.026	0.021	0.008	0.000	0.000	0.000	0.710	pg151_def.cx7a_gcp_c2s60
0.000	57.818	41.213	0.918	0.019	0.024	0.009	0.000	0.000	0.000	0.632	pg151_o2_nofp.cx7a_gcp_c2s60
0.000	59.411	39.646	0.895	0.018	0.022	0.008	0.000	0.000	0.000	0.592	pg151_o3.cx7a_gcp_c2s60
0.000	55.631	43.448	0.868	0.023	0.022	0.009	0.000	0.000	0.000	0.921	pg151_o3_native.cx7a_gcp_c2s60
0.000	57.634	41.520	0.796	0.022	0.019	0.009	0.001	0.000	0.000	1.104	pg151_o3_native_lto.cx7a_gcp_c2s60
l.x
- l.x: create secondary indexes
- Legend for results is here.
- Each entry lists the percentage of responses that fit in that bucket (slower than max time for previous bucket, faster than min time for next bucket).
TODO - determine whether there is data for create index response time
l.i1
- l.i1: continue load after secondary indexes created
- Legend for results is here.
- Each entry lists the percentage of responses that fit in that bucket (slower than max time for previous bucket, faster than min time for next bucket).
Insert response time histogram
256us	1ms	4ms	16ms	64ms	256ms	1s	4s	16s	gt	max	tag
0.000	nonzero	96.375	2.520	1.059	0.028	0.018	nonzero	0.000	0.000	1.119	pg151_def.cx7a_gcp_c2s60
0.000	0.000	96.420	2.459	1.074	0.034	0.013	nonzero	0.000	0.000	1.050	pg151_o2_nofp.cx7a_gcp_c2s60
0.000	nonzero	96.301	2.542	1.112	0.033	0.012	nonzero	0.000	0.000	1.153	pg151_o3.cx7a_gcp_c2s60
0.000	nonzero	96.216	2.639	1.095	0.037	0.012	nonzero	0.000	0.000	1.042	pg151_o3_native.cx7a_gcp_c2s60
0.000	0.003	96.248	2.610	1.092	0.036	0.011	nonzero	0.000	0.000	1.045	pg151_o3_native_lto.cx7a_gcp_c2s60
q100.1
- q100.1: range queries with 100 insert/s per client
- Legend for results is here.
- Each entry lists the percentage of responses that fit in that bucket (slower than max time for previous bucket, faster than min time for next bucket).
Query response time histogram
256us	1ms	4ms	16ms	64ms	256ms	1s	4s	16s	gt	max	tag
99.905	0.088	0.006	0.001	nonzero	0.000	0.000	0.000	0.000	0.000	0.027	pg151_def.cx7a_gcp_c2s60
99.901	0.091	0.006	0.001	nonzero	0.000	0.000	0.000	0.000	0.000	0.026	pg151_o2_nofp.cx7a_gcp_c2s60
99.905	0.087	0.006	0.001	nonzero	nonzero	0.000	0.000	0.000	0.000	0.074	pg151_o3.cx7a_gcp_c2s60
99.909	0.083	0.006	0.001	nonzero	0.000	0.000	0.000	0.000	0.000	0.027	pg151_o3_native.cx7a_gcp_c2s60
99.917	0.076	0.006	0.001	nonzero	nonzero	0.000	0.000	0.000	0.000	0.201	pg151_o3_native_lto.cx7a_gcp_c2s60
Insert response time histogram
256us	1ms	4ms	16ms	64ms	256ms	1s	4s	16s	gt	max	tag
0.000	0.000	95.414	3.919	0.651	0.015	0.000	0.000	0.000	0.000	0.131	pg151_def.cx7a_gcp_c2s60
0.000	0.000	95.415	3.740	0.819	0.025	0.000	0.000	0.000	0.000	0.197	pg151_o2_nofp.cx7a_gcp_c2s60
0.000	0.000	93.342	5.244	1.382	0.017	0.015	0.000	0.000	0.000	0.305	pg151_o3.cx7a_gcp_c2s60
0.000	0.000	92.468	5.847	1.685	0.000	0.000	0.000	0.000	0.000	0.059	pg151_o3_native.cx7a_gcp_c2s60
0.000	0.000	95.233	4.078	0.689	0.000	0.000	0.000	0.000	0.000	0.036	pg151_o3_native_lto.cx7a_gcp_c2s60
q500.1
- q500.1: range queries with 500 insert/s per client
- Legend for results is here.
- Each entry lists the percentage of responses that fit in that bucket (slower than max time for previous bucket, faster than min time for next bucket).
Query response time histogram
256us	1ms	4ms	16ms	64ms	256ms	1s	4s	16s	gt	max	tag
99.904	0.063	0.029	0.004	nonzero	0.000	0.000	0.000	0.000	0.000	0.047	pg151_def.cx7a_gcp_c2s60
99.899	0.067	0.030	0.004	nonzero	0.000	0.000	0.000	0.000	0.000	0.043	pg151_o2_nofp.cx7a_gcp_c2s60
99.901	0.066	0.029	0.004	nonzero	0.000	0.000	0.000	0.000	0.000	0.052	pg151_o3.cx7a_gcp_c2s60
99.905	0.062	0.029	0.004	nonzero	nonzero	0.000	0.000	0.000	0.000	0.069	pg151_o3_native.cx7a_gcp_c2s60
99.912	0.056	0.028	0.004	nonzero	0.000	0.000	0.000	0.000	0.000	0.049	pg151_o3_native_lto.cx7a_gcp_c2s60
Insert response time histogram
256us	1ms	4ms	16ms	64ms	256ms	1s	4s	16s	gt	max	tag
0.000	0.000	44.712	25.267	28.882	1.139	0.000	0.000	0.000	0.000	0.233	pg151_def.cx7a_gcp_c2s60
0.000	0.000	44.531	25.522	28.791	1.156	nonzero	0.000	0.000	0.000	0.273	pg151_o2_nofp.cx7a_gcp_c2s60
0.000	0.000	44.551	25.048	29.167	1.229	0.006	0.000	0.000	0.000	0.485	pg151_o3.cx7a_gcp_c2s60
0.000	0.000	45.206	25.333	28.340	1.121	0.000	0.000	0.000	0.000	0.172	pg151_o3_native.cx7a_gcp_c2s60
0.000	0.000	45.118	24.665	28.994	1.223	0.000	0.000	0.000	0.000	0.230	pg151_o3_native_lto.cx7a_gcp_c2s60
q1000.1
- q1000.1: range queries with 1000 insert/s per client
- Legend for results is here.
- Each entry lists the percentage of responses that fit in that bucket (slower than max time for previous bucket, faster than min time for next bucket).
Query response time histogram
256us	1ms	4ms	16ms	64ms	256ms	1s	4s	16s	gt	max	tag
99.837	0.111	0.044	0.007	nonzero	nonzero	0.000	0.000	0.000	0.000	0.075	pg151_def.cx7a_gcp_c2s60
99.831	0.116	0.045	0.007	nonzero	0.000	0.000	0.000	0.000	0.000	0.044	pg151_o2_nofp.cx7a_gcp_c2s60
99.834	0.113	0.045	0.007	nonzero	nonzero	0.000	0.000	0.000	0.000	0.078	pg151_o3.cx7a_gcp_c2s60
99.839	0.109	0.044	0.007	nonzero	nonzero	0.000	0.000	0.000	0.000	0.145	pg151_o3_native.cx7a_gcp_c2s60
99.850	0.101	0.042	0.007	nonzero	0.000	0.000	0.000	0.000	0.000	0.058	pg151_o3_native_lto.cx7a_gcp_c2s60
Insert response time histogram
256us	1ms	4ms	16ms	64ms	256ms	1s	4s	16s	gt	max	tag
0.000	0.000	57.336	22.654	19.230	0.780	0.000	0.000	0.000	0.000	0.217	pg151_def.cx7a_gcp_c2s60
0.000	0.000	57.521	23.286	18.441	0.751	0.000	0.000	0.000	0.000	0.211	pg151_o2_nofp.cx7a_gcp_c2s60
0.000	0.000	57.302	22.813	19.041	0.845	0.000	0.000	0.000	0.000	0.210	pg151_o3.cx7a_gcp_c2s60
0.000	0.000	56.685	23.197	19.285	0.834	0.000	0.000	0.000	0.000	0.210	pg151_o3_native.cx7a_gcp_c2s60
0.000	0.000	57.634	22.750	18.822	0.794	0.000	0.000	0.000	0.000	0.199	pg151_o3_native_lto.cx7a_gcp_c2s60