Introduction
This is a report for the insert benchmark with 400M docs and 20 client(s). It is generated by scripts (bash, awk, sed) and Tufte might not be impressed. An overview of the insert benchmark is here and a short update is here. Below, by DBMS, I mean DBMS+version.config. An example is my8020.c10b40 where my means MySQL, 8020 is version 8.0.20 and c10b40 is the name for the configuration file.
The test server is c2-standard-60 from GCP with 30 cores, hyperthreads disabled, 240G RAM and 3T of NVMe (XFS with RAID0 over 8 devices). The benchmark was run with 20 clients and there were 1 or 2 connections per client (1 for queries, 1 for inserts). It uses 20 tables with a client per table. It loads 20M rows per table without secondary indexes, creates secondary indexes, loads another 20M rows per table then does 3 read+write tests for one hour each that do queries as fast as possible with 100, 500 and then 1000 writes/second/client concurrent with the queries. The database is cached by the OS but not by Postgres. Clients and the DBMS share one server. The per-database configs are in the per-database subdirectories here.
The tested DBMS are:
- pg151_def.cx7_gcp_c2s60_4g - Postgres 15.1, the cx7_gcp_c2s60_4g config and the build used: -O2
- pg151_o2_nofp.cx7_gcp_c2s60_4g - Postgres 15.1, the cx7_gcp_c2s60_4g config and the build used: -O2 -no-omit-frame-pointer
- pg151_o3.cx7_gcp_c2s60_4g - Postgres 15.1, the cx7_gcp_c2s60_4g config and the build used: -O3
- pg151_o3_native.cx7_gcp_c2s60_4g - Postgres 15.1, the cx7_gcp_c2s60_4g config and the build used: -O3 -march=native -mtune=native
- pg151_o3_native_lto.cx7_gcp_c2s60_4g - Postgres 15.1, the cx7_gcp_c2s60_4g config and the build used: -O3 -march=native -mtune=native and -flto
Contents
- Summary
- l.i0: load without secondary indexes
- l.x: create secondary indexes
- l.i1: continue load after secondary indexes created
- q100.1: range queries with 100 insert/s per client
- q500.1: range queries with 500 insert/s per client
- q1000.1: range queries with 1000 insert/s per client
Summary
The numbers are inserts/s for l.i0 and l.i1, indexed docs (or rows) /s for l.x and queries/s for q*.2. The values are the average rate over the entire test for inserts (IPS) and queries (QPS). The range of values for IPS and QPS is split into 3 parts: bottom 25%, middle 50%, top 25%. Values in the bottom 25% have a red background, values in the top 25% have a green background and values in the middle have no color. A gray background is used for values that can be ignored because the DBMS did not sustain the target insert rate. Red backgrounds are not used when the minimum value is within 80% of the max value.
| dbms | l.i0 | l.x | l.i1 | q100.1 | q500.1 | q1000.1 |
|---|---|---|---|---|---|---|
| 400m.pg151_def.cx7_gcp_c2s60_4g | 1365188 | 2073057 | 150263 | 184653 | 198409 | 200198 |
| 400m.pg151_o2_nofp.cx7_gcp_c2s60_4g | 1379310 | 2041326 | 152672 | 184012 | 199807 | 200390 |
| 400m.pg151_o3.cx7_gcp_c2s60_4g | 1413428 | 2062371 | 155400 | 185219 | 198230 | 203504 |
| 400m.pg151_o3_native.cx7_gcp_c2s60_4g | 1418440 | 2094764 | 156617 | 189527 | 204372 | 205795 |
| 400m.pg151_o3_native_lto.cx7_gcp_c2s60_4g | 1454545 | 2198352 | 153315 | 193608 | 211192 | 214804 |
This table has relative throughput, throughput for the DBMS relative to the DBMS in the first line, using the absolute throughput from the previous table.
| dbms | l.i0 | l.x | l.i1 | q100.1 | q500.1 | q1000.1 |
|---|---|---|---|---|---|---|
| 400m.pg151_def.cx7_gcp_c2s60_4g | 1.00 | 1.00 | 1.00 | 1.00 | 1.00 | 1.00 |
| 400m.pg151_o2_nofp.cx7_gcp_c2s60_4g | 1.01 | 0.98 | 1.02 | 1.00 | 1.01 | 1.00 |
| 400m.pg151_o3.cx7_gcp_c2s60_4g | 1.04 | 0.99 | 1.03 | 1.00 | 1.00 | 1.02 |
| 400m.pg151_o3_native.cx7_gcp_c2s60_4g | 1.04 | 1.01 | 1.04 | 1.03 | 1.03 | 1.03 |
| 400m.pg151_o3_native_lto.cx7_gcp_c2s60_4g | 1.07 | 1.06 | 1.02 | 1.05 | 1.06 | 1.07 |
This lists the average rate of inserts/s for the tests that do inserts concurrent with queries. For such tests the query rate is listed in the table above. The read+write tests are setup so that the insert rate should match the target rate every second. Cells that are not at least 95% of the target have a red background to indicate a failure to satisfy the target.
| dbms | q100.1 | q500.1 | q1000.1 |
|---|---|---|---|
| pg151_def.cx7_gcp_c2s60_4g | 1976 | 9885 | 19769 |
| pg151_o2_nofp.cx7_gcp_c2s60_4g | 1976 | 9885 | 19769 |
| pg151_o3.cx7_gcp_c2s60_4g | 1976 | 9885 | 19769 |
| pg151_o3_native.cx7_gcp_c2s60_4g | 1976 | 9885 | 19769 |
| pg151_o3_native_lto.cx7_gcp_c2s60_4g | 1976 | 9885 | 19769 |
| target | 2000 | 10000 | 20000 |
l.i0
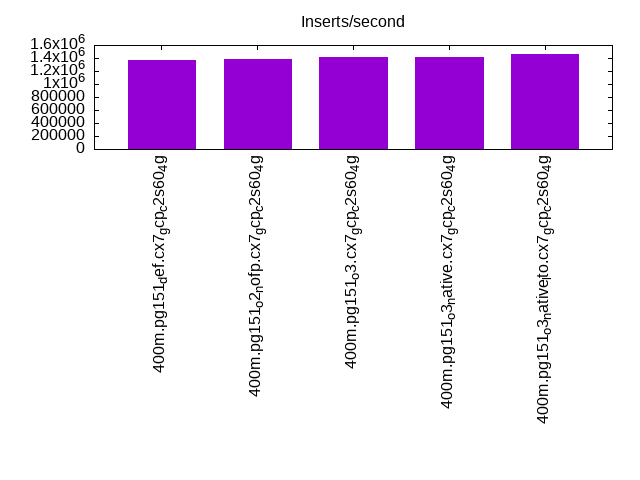
l.i0: load without secondary indexes. Graphs for performance per 1-second interval are here.
Average throughput:
Insert response time histogram: each cell has the percentage of responses that take <= the time in the header and max is the max response time in seconds. For the max column values in the top 25% of the range have a red background and in the bottom 25% of the range have a green background. The red background is not used when the min value is within 80% of the max value.
| dbms | 256us | 1ms | 4ms | 16ms | 64ms | 256ms | 1s | 4s | 16s | gt | max |
|---|---|---|---|---|---|---|---|---|---|---|---|
| pg151_def.cx7_gcp_c2s60_4g | 59.850 | 39.040 | 1.050 | 0.019 | 0.034 | 0.007 | 0.569 | ||||
| pg151_o2_nofp.cx7_gcp_c2s60_4g | 60.855 | 37.999 | 1.082 | 0.034 | 0.022 | 0.007 | 0.692 | ||||
| pg151_o3.cx7_gcp_c2s60_4g | 62.581 | 36.369 | 0.987 | 0.030 | 0.023 | 0.010 | 0.626 | ||||
| pg151_o3_native.cx7_gcp_c2s60_4g | 61.527 | 37.396 | 1.019 | 0.027 | 0.023 | 0.007 | 0.635 | ||||
| pg151_o3_native_lto.cx7_gcp_c2s60_4g | 62.747 | 36.260 | 0.920 | 0.039 | 0.023 | 0.010 | 0.559 |
Performance metrics for the DBMS listed above. Some are normalized by throughput, others are not. Legend for results is here.
ips	qps	rps	rmbps	wps	wmbps	rpq	rkbpq	wpi	wkbpi	csps	cpups	cspq	cpupq	dbgb1	dbgb2	rss	maxop	p50	p99	tag
1365188	0	0	0.0	9773.4	576.4	0.000	0.000	0.007	0.432	235832	60.4	0.173	13	38.3	103.2	NA	0.569	76814	29581	400m.pg151_def.cx7_gcp_c2s60_4g
1379310	0	0	0.0	9820.3	577.9	0.000	0.000	0.007	0.429	220720	60.4	0.160	13	38.3	103.2	NA	0.692	76817	23873	400m.pg151_o2_nofp.cx7_gcp_c2s60_4g
1413428	0	0	0.0	10098.7	590.1	0.000	0.000	0.007	0.427	218612	60.5	0.155	13	38.3	103.2	NA	0.626	79612	14584	400m.pg151_o3.cx7_gcp_c2s60_4g
1418440	0	0	0.0	10125.7	592.2	0.000	0.000	0.007	0.428	229584	60.6	0.162	13	38.3	103.2	NA	0.635	78914	30567	400m.pg151_o3_native.cx7_gcp_c2s60_4g
1454545	0	0	0.0	10210.5	603.1	0.000	0.000	0.007	0.425	229062	59.7	0.157	12	38.3	103.2	NA	0.559	81410	19579	400m.pg151_o3_native_lto.cx7_gcp_c2s60_4g
l.x
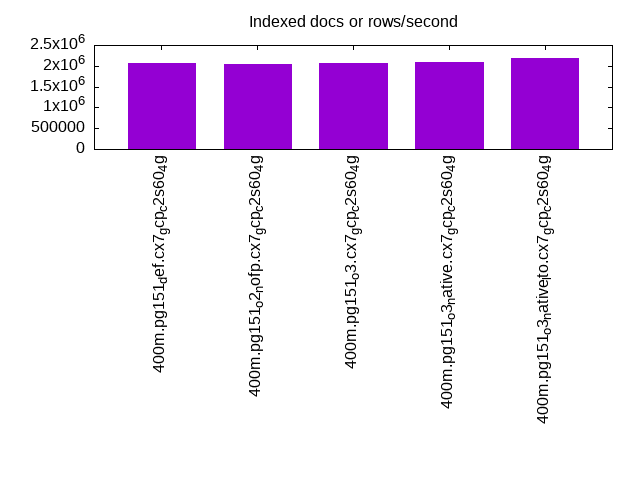
l.x: create secondary indexes.
Average throughput:
Performance metrics for the DBMS listed above. Some are normalized by throughput, others are not. Legend for results is here.
ips	qps	rps	rmbps	wps	wmbps	rpq	rkbpq	wpi	wkbpi	csps	cpups	cspq	cpupq	dbgb1	dbgb2	rss	maxop	p50	p99	tag
2073057	0	0	0.0	7010.7	935.5	0.000	0.000	0.003	0.462	149695	22.1	0.072	3	73.5	195.0	NA	0.153	NA	NA	400m.pg151_def.cx7_gcp_c2s60_4g
2041326	0	0	0.0	6851.1	932.6	0.000	0.000	0.003	0.468	148316	21.7	0.073	3	73.5	194.9	NA	0.219	NA	NA	400m.pg151_o2_nofp.cx7_gcp_c2s60_4g
2062371	0	0	0.0	6792.1	905.3	0.000	0.000	0.003	0.450	145806	21.6	0.071	3	73.5	193.4	NA	0.159	NA	NA	400m.pg151_o3.cx7_gcp_c2s60_4g
2094764	0	0	0.0	6697.1	930.4	0.000	0.000	0.003	0.455	146994	21.4	0.070	3	73.5	192.3	NA	0.056	NA	NA	400m.pg151_o3_native.cx7_gcp_c2s60_4g
2198352	0	0	0.0	5809.6	895.1	0.000	0.000	0.003	0.417	117662	21.9	0.054	3	73.5	185.6	NA	0.051	NA	NA	400m.pg151_o3_native_lto.cx7_gcp_c2s60_4g
l.i1
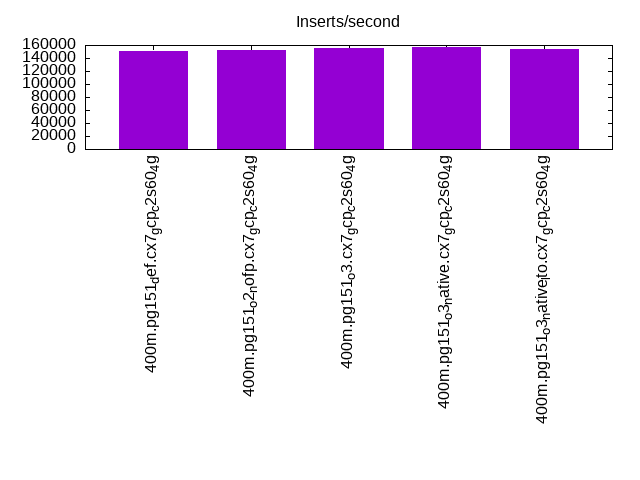
l.i1: continue load after secondary indexes created. Graphs for performance per 1-second interval are here.
Average throughput:
Insert response time histogram: each cell has the percentage of responses that take <= the time in the header and max is the max response time in seconds. For the max column values in the top 25% of the range have a red background and in the bottom 25% of the range have a green background. The red background is not used when the min value is within 80% of the max value.
| dbms | 256us | 1ms | 4ms | 16ms | 64ms | 256ms | 1s | 4s | 16s | gt | max |
|---|---|---|---|---|---|---|---|---|---|---|---|
| pg151_def.cx7_gcp_c2s60_4g | 58.979 | 34.690 | 5.584 | 0.715 | 0.031 | nonzero | 1.058 | ||||
| pg151_o2_nofp.cx7_gcp_c2s60_4g | 58.476 | 35.608 | 5.184 | 0.708 | 0.024 | nonzero | 1.125 | ||||
| pg151_o3.cx7_gcp_c2s60_4g | 61.994 | 32.419 | 4.816 | 0.739 | 0.031 | 0.976 | |||||
| pg151_o3_native.cx7_gcp_c2s60_4g | 66.489 | 27.825 | 4.906 | 0.747 | 0.033 | 0.784 | |||||
| pg151_o3_native_lto.cx7_gcp_c2s60_4g | 65.608 | 28.218 | 5.416 | 0.725 | 0.033 | 0.962 |
Performance metrics for the DBMS listed above. Some are normalized by throughput, others are not. Legend for results is here.
ips	qps	rps	rmbps	wps	wmbps	rpq	rkbpq	wpi	wkbpi	csps	cpups	cspq	cpupq	dbgb1	dbgb2	rss	maxop	p50	p99	tag
150263	0	472	3.6	49403.8	1316.5	0.003	0.024	0.329	8.972	150492	41.1	1.002	82	163.3	304.0	NA	1.058	7592	899	400m.pg151_def.cx7_gcp_c2s60_4g
152672	0	363	3.0	47661.1	1310.9	0.002	0.020	0.312	8.793	154974	41.8	1.015	82	163.3	303.5	NA	1.125	7897	899	400m.pg151_o2_nofp.cx7_gcp_c2s60_4g
155400	0	311	3.7	46983.5	1309.7	0.002	0.024	0.302	8.630	146881	42.2	0.945	81	163.3	305.2	NA	0.976	7991	849	400m.pg151_o3.cx7_gcp_c2s60_4g
156617	0	322	3.5	47483.4	1308.3	0.002	0.023	0.303	8.554	157075	41.3	1.003	79	163.3	304.2	NA	0.784	8044	949	400m.pg151_o3_native.cx7_gcp_c2s60_4g
153315	0	554	3.3	48017.3	1314.6	0.004	0.022	0.313	8.780	166626	40.1	1.087	78	163.3	304.0	NA	0.962	7744	899	400m.pg151_o3_native_lto.cx7_gcp_c2s60_4g
q100.1
q100.1: range queries with 100 insert/s per client. Graphs for performance per 1-second interval are here.
Average throughput:
Query response time histogram: each cell has the percentage of responses that take <= the time in the header and max is the max response time in seconds. For max values in the top 25% of the range have a red background and in the bottom 25% of the range have a green background. The red background is not used when the min value is within 80% of the max value.
| dbms | 256us | 1ms | 4ms | 16ms | 64ms | 256ms | 1s | 4s | 16s | gt | max |
|---|---|---|---|---|---|---|---|---|---|---|---|
| pg151_def.cx7_gcp_c2s60_4g | 99.933 | 0.058 | 0.008 | 0.001 | nonzero | nonzero | nonzero | 0.346 | |||
| pg151_o2_nofp.cx7_gcp_c2s60_4g | 99.932 | 0.059 | 0.008 | 0.001 | nonzero | nonzero | nonzero | 0.294 | |||
| pg151_o3.cx7_gcp_c2s60_4g | 99.952 | 0.040 | 0.008 | 0.001 | nonzero | nonzero | nonzero | 0.272 | |||
| pg151_o3_native.cx7_gcp_c2s60_4g | 99.951 | 0.040 | 0.007 | 0.001 | nonzero | nonzero | nonzero | 0.261 | |||
| pg151_o3_native_lto.cx7_gcp_c2s60_4g | 99.951 | 0.041 | 0.007 | 0.001 | nonzero | nonzero | nonzero | 0.372 |
Insert response time histogram: each cell has the percentage of responses that take <= the time in the header and max is the max response time in seconds. For max values in the top 25% of the range have a red background and in the bottom 25% of the range have a green background. The red background is not used when the min value is within 80% of the max value.
| dbms | 256us | 1ms | 4ms | 16ms | 64ms | 256ms | 1s | 4s | 16s | gt | max |
|---|---|---|---|---|---|---|---|---|---|---|---|
| pg151_def.cx7_gcp_c2s60_4g | 94.136 | 5.372 | 0.490 | 0.001 | 0.213 | ||||||
| pg151_o2_nofp.cx7_gcp_c2s60_4g | 96.275 | 3.250 | 0.475 | 0.039 | |||||||
| pg151_o3.cx7_gcp_c2s60_4g | 95.278 | 3.976 | 0.735 | 0.010 | 0.001 | 0.294 | |||||
| pg151_o3_native.cx7_gcp_c2s60_4g | 94.549 | 4.579 | 0.857 | 0.015 | 0.246 | ||||||
| pg151_o3_native_lto.cx7_gcp_c2s60_4g | 95.942 | 3.729 | 0.311 | 0.017 | 0.001 | 0.292 |
Performance metrics for the DBMS listed above. Some are normalized by throughput, others are not. Legend for results is here.
ips	qps	rps	rmbps	wps	wmbps	rpq	rkbpq	wpi	wkbpi	csps	cpups	cspq	cpupq	dbgb1	dbgb2	rss	maxop	p50	p99	tag
1976	184653	178	1.1	6288.7	73.2	0.001	0.006	3.183	37.949	657034	62.9	3.558	102	163.9	270.8	0.0	0.346	9162	8774	400m.pg151_def.cx7_gcp_c2s60_4g
1976	184012	237	1.5	6273.7	71.7	0.001	0.008	3.175	37.180	655577	62.8	3.563	102	163.9	266.3	0.0	0.294	9093	8662	400m.pg151_o2_nofp.cx7_gcp_c2s60_4g
1976	185219	116	0.9	6264.1	73.1	0.001	0.005	3.170	37.865	660946	63.1	3.568	102	163.9	267.3	0.0	0.272	9222	8838	400m.pg151_o3.cx7_gcp_c2s60_4g
1976	189527	139	0.9	6257.5	73.4	0.001	0.005	3.167	38.031	675428	62.9	3.564	100	163.9	264.5	0.0	0.261	9477	9062	400m.pg151_o3_native.cx7_gcp_c2s60_4g
1976	193608	161	1.0	6279.6	72.9	0.001	0.005	3.178	37.762	689550	62.7	3.562	97	163.9	264.6	0.0	0.372	9526	9142	400m.pg151_o3_native_lto.cx7_gcp_c2s60_4g
q500.1
q500.1: range queries with 500 insert/s per client. Graphs for performance per 1-second interval are here.
Average throughput:
Query response time histogram: each cell has the percentage of responses that take <= the time in the header and max is the max response time in seconds. For max values in the top 25% of the range have a red background and in the bottom 25% of the range have a green background. The red background is not used when the min value is within 80% of the max value.
| dbms | 256us | 1ms | 4ms | 16ms | 64ms | 256ms | 1s | 4s | 16s | gt | max |
|---|---|---|---|---|---|---|---|---|---|---|---|
| pg151_def.cx7_gcp_c2s60_4g | 99.818 | 0.141 | 0.037 | 0.004 | nonzero | 0.060 | |||||
| pg151_o2_nofp.cx7_gcp_c2s60_4g | 99.809 | 0.149 | 0.038 | 0.004 | nonzero | 0.045 | |||||
| pg151_o3.cx7_gcp_c2s60_4g | 99.809 | 0.149 | 0.038 | 0.004 | nonzero | nonzero | 0.233 | ||||
| pg151_o3_native.cx7_gcp_c2s60_4g | 99.822 | 0.138 | 0.037 | 0.003 | nonzero | nonzero | 0.065 | ||||
| pg151_o3_native_lto.cx7_gcp_c2s60_4g | 99.830 | 0.130 | 0.036 | 0.003 | nonzero | nonzero | 0.094 |
Insert response time histogram: each cell has the percentage of responses that take <= the time in the header and max is the max response time in seconds. For max values in the top 25% of the range have a red background and in the bottom 25% of the range have a green background. The red background is not used when the min value is within 80% of the max value.
| dbms | 256us | 1ms | 4ms | 16ms | 64ms | 256ms | 1s | 4s | 16s | gt | max |
|---|---|---|---|---|---|---|---|---|---|---|---|
| pg151_def.cx7_gcp_c2s60_4g | 36.681 | 36.343 | 26.391 | 0.586 | 0.236 | ||||||
| pg151_o2_nofp.cx7_gcp_c2s60_4g | 34.969 | 37.348 | 27.134 | 0.549 | 0.202 | ||||||
| pg151_o3.cx7_gcp_c2s60_4g | 35.851 | 37.345 | 26.201 | 0.602 | 0.244 | ||||||
| pg151_o3_native.cx7_gcp_c2s60_4g | 35.548 | 36.889 | 26.981 | 0.582 | 0.208 | ||||||
| pg151_o3_native_lto.cx7_gcp_c2s60_4g | 35.132 | 36.447 | 27.806 | 0.616 | 0.247 |
Performance metrics for the DBMS listed above. Some are normalized by throughput, others are not. Legend for results is here.
ips	qps	rps	rmbps	wps	wmbps	rpq	rkbpq	wpi	wkbpi	csps	cpups	cspq	cpupq	dbgb1	dbgb2	rss	maxop	p50	p99	tag
9885	198409	5	0.0	29669.2	324.5	0.000	0.000	3.002	33.620	655833	64.9	3.305	98	167.5	253.5	0.0	0.060	9764	8746	400m.pg151_def.cx7_gcp_c2s60_4g
9885	199807	6	0.0	29617.7	327.4	0.000	0.000	2.996	33.916	657172	65.0	3.289	98	167.5	251.9	0.0	0.045	9882	8822	400m.pg151_o2_nofp.cx7_gcp_c2s60_4g
9885	198230	10	0.0	29685.6	327.6	0.000	0.000	3.003	33.941	657630	64.8	3.318	98	167.4	253.1	0.0	0.233	9785	8810	400m.pg151_o3.cx7_gcp_c2s60_4g
9885	204372	5	0.0	29556.2	326.3	0.000	0.000	2.990	33.800	674569	64.8	3.301	95	167.4	251.6	0.0	0.065	10042	9018	400m.pg151_o3_native.cx7_gcp_c2s60_4g
9885	211192	10	0.1	29498.3	327.4	0.000	0.000	2.984	33.919	694193	64.9	3.287	92	167.4	251.4	0.0	0.094	10293	9146	400m.pg151_o3_native_lto.cx7_gcp_c2s60_4g
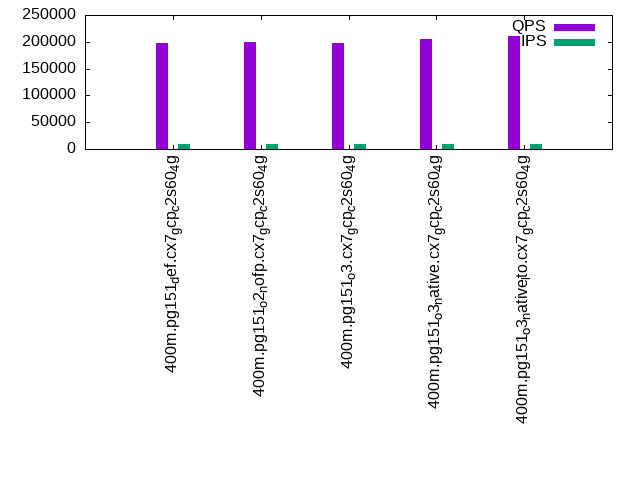
q1000.1
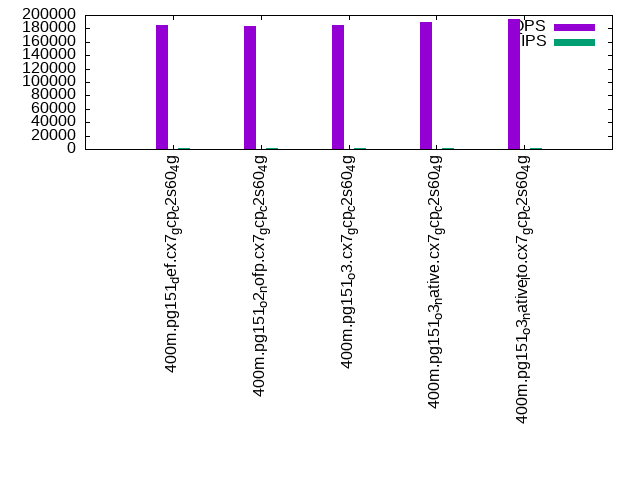
q1000.1: range queries with 1000 insert/s per client. Graphs for performance per 1-second interval are here.
Average throughput:

Query response time histogram: each cell has the percentage of responses that take <= the time in the header and max is the max response time in seconds. For max values in the top 25% of the range have a red background and in the bottom 25% of the range have a green background. The red background is not used when the min value is within 80% of the max value.
| dbms | 256us | 1ms | 4ms | 16ms | 64ms | 256ms | 1s | 4s | 16s | gt | max |
|---|---|---|---|---|---|---|---|---|---|---|---|
| pg151_def.cx7_gcp_c2s60_4g | 99.434 | 0.447 | 0.108 | 0.011 | 0.001 | nonzero | 0.077 | ||||
| pg151_o2_nofp.cx7_gcp_c2s60_4g | 99.403 | 0.473 | 0.113 | 0.011 | 0.001 | nonzero | 0.073 | ||||
| pg151_o3.cx7_gcp_c2s60_4g | 99.425 | 0.455 | 0.109 | 0.011 | 0.001 | nonzero | 0.079 | ||||
| pg151_o3_native.cx7_gcp_c2s60_4g | 99.436 | 0.447 | 0.107 | 0.010 | 0.001 | nonzero | 0.080 | ||||
| pg151_o3_native_lto.cx7_gcp_c2s60_4g | 99.475 | 0.415 | 0.100 | 0.009 | 0.001 | nonzero | 0.077 |
Insert response time histogram: each cell has the percentage of responses that take <= the time in the header and max is the max response time in seconds. For max values in the top 25% of the range have a red background and in the bottom 25% of the range have a green background. The red background is not used when the min value is within 80% of the max value.
| dbms | 256us | 1ms | 4ms | 16ms | 64ms | 256ms | 1s | 4s | 16s | gt | max |
|---|---|---|---|---|---|---|---|---|---|---|---|
| pg151_def.cx7_gcp_c2s60_4g | 32.952 | 48.638 | 17.508 | 0.903 | 0.253 | ||||||
| pg151_o2_nofp.cx7_gcp_c2s60_4g | 29.516 | 51.217 | 18.369 | 0.895 | 0.003 | 0.311 | |||||
| pg151_o3.cx7_gcp_c2s60_4g | 29.909 | 50.346 | 18.802 | 0.943 | 0.220 | ||||||
| pg151_o3_native.cx7_gcp_c2s60_4g | 29.577 | 50.243 | 19.305 | 0.876 | 0.236 | ||||||
| pg151_o3_native_lto.cx7_gcp_c2s60_4g | 29.946 | 50.558 | 18.626 | 0.870 | 0.250 |
Performance metrics for the DBMS listed above. Some are normalized by throughput, others are not. Legend for results is here.
ips	qps	rps	rmbps	wps	wmbps	rpq	rkbpq	wpi	wkbpi	csps	cpups	cspq	cpupq	dbgb1	dbgb2	rss	maxop	p50	p99	tag
19769	200198	88	0.5	53005.6	567.2	0.000	0.003	2.681	29.380	632013	66.4	3.157	100	179.6	275.0	0.0	0.077	9845	8375	400m.pg151_def.cx7_gcp_c2s60_4g
19769	200390	91	0.6	52982.9	572.7	0.000	0.003	2.680	29.666	629902	66.3	3.143	99	179.6	275.0	0.0	0.073	9941	8407	400m.pg151_o2_nofp.cx7_gcp_c2s60_4g
19769	203504	55	0.3	53033.1	573.3	0.000	0.002	2.683	29.694	639120	66.3	3.141	98	179.6	275.1	0.0	0.079	10021	8474	400m.pg151_o3.cx7_gcp_c2s60_4g
19769	205795	59	0.3	53169.4	573.8	0.000	0.001	2.689	29.719	650494	66.2	3.161	97	179.6	275.0	0.0	0.080	10185	8726	400m.pg151_o3_native.cx7_gcp_c2s60_4g
19769	214804	79	0.5	53224.3	574.5	0.000	0.002	2.692	29.760	674123	66.2	3.138	92	179.6	275.1	0.0	0.077	10617	8954	400m.pg151_o3_native_lto.cx7_gcp_c2s60_4g
l.i0
l.i0: load without secondary indexes
Performance metrics for all DBMS, not just the ones listed above. Some are normalized by throughput, others are not. Legend for results is here.
ips	qps	rps	rmbps	wps	wmbps	rpq	rkbpq	wpi	wkbpi	csps	cpups	cspq	cpupq	dbgb1	dbgb2	rss	maxop	p50	p99	tag
1365188	0	0	0.0	9773.4	576.4	0.000	0.000	0.007	0.432	235832	60.4	0.173	13	38.3	103.2	NA	0.569	76814	29581	400m.pg151_def.cx7_gcp_c2s60_4g
1379310	0	0	0.0	9820.3	577.9	0.000	0.000	0.007	0.429	220720	60.4	0.160	13	38.3	103.2	NA	0.692	76817	23873	400m.pg151_o2_nofp.cx7_gcp_c2s60_4g
1413428	0	0	0.0	10098.7	590.1	0.000	0.000	0.007	0.427	218612	60.5	0.155	13	38.3	103.2	NA	0.626	79612	14584	400m.pg151_o3.cx7_gcp_c2s60_4g
1418440	0	0	0.0	10125.7	592.2	0.000	0.000	0.007	0.428	229584	60.6	0.162	13	38.3	103.2	NA	0.635	78914	30567	400m.pg151_o3_native.cx7_gcp_c2s60_4g
1454545	0	0	0.0	10210.5	603.1	0.000	0.000	0.007	0.425	229062	59.7	0.157	12	38.3	103.2	NA	0.559	81410	19579	400m.pg151_o3_native_lto.cx7_gcp_c2s60_4g
l.x
l.x: create secondary indexes
Performance metrics for all DBMS, not just the ones listed above. Some are normalized by throughput, others are not. Legend for results is here.
ips	qps	rps	rmbps	wps	wmbps	rpq	rkbpq	wpi	wkbpi	csps	cpups	cspq	cpupq	dbgb1	dbgb2	rss	maxop	p50	p99	tag
2073057	0	0	0.0	7010.7	935.5	0.000	0.000	0.003	0.462	149695	22.1	0.072	3	73.5	195.0	NA	0.153	NA	NA	400m.pg151_def.cx7_gcp_c2s60_4g
2041326	0	0	0.0	6851.1	932.6	0.000	0.000	0.003	0.468	148316	21.7	0.073	3	73.5	194.9	NA	0.219	NA	NA	400m.pg151_o2_nofp.cx7_gcp_c2s60_4g
2062371	0	0	0.0	6792.1	905.3	0.000	0.000	0.003	0.450	145806	21.6	0.071	3	73.5	193.4	NA	0.159	NA	NA	400m.pg151_o3.cx7_gcp_c2s60_4g
2094764	0	0	0.0	6697.1	930.4	0.000	0.000	0.003	0.455	146994	21.4	0.070	3	73.5	192.3	NA	0.056	NA	NA	400m.pg151_o3_native.cx7_gcp_c2s60_4g
2198352	0	0	0.0	5809.6	895.1	0.000	0.000	0.003	0.417	117662	21.9	0.054	3	73.5	185.6	NA	0.051	NA	NA	400m.pg151_o3_native_lto.cx7_gcp_c2s60_4g
l.i1
l.i1: continue load after secondary indexes created
Performance metrics for all DBMS, not just the ones listed above. Some are normalized by throughput, others are not. Legend for results is here.
ips	qps	rps	rmbps	wps	wmbps	rpq	rkbpq	wpi	wkbpi	csps	cpups	cspq	cpupq	dbgb1	dbgb2	rss	maxop	p50	p99	tag
150263	0	472	3.6	49403.8	1316.5	0.003	0.024	0.329	8.972	150492	41.1	1.002	82	163.3	304.0	NA	1.058	7592	899	400m.pg151_def.cx7_gcp_c2s60_4g
152672	0	363	3.0	47661.1	1310.9	0.002	0.020	0.312	8.793	154974	41.8	1.015	82	163.3	303.5	NA	1.125	7897	899	400m.pg151_o2_nofp.cx7_gcp_c2s60_4g
155400	0	311	3.7	46983.5	1309.7	0.002	0.024	0.302	8.630	146881	42.2	0.945	81	163.3	305.2	NA	0.976	7991	849	400m.pg151_o3.cx7_gcp_c2s60_4g
156617	0	322	3.5	47483.4	1308.3	0.002	0.023	0.303	8.554	157075	41.3	1.003	79	163.3	304.2	NA	0.784	8044	949	400m.pg151_o3_native.cx7_gcp_c2s60_4g
153315	0	554	3.3	48017.3	1314.6	0.004	0.022	0.313	8.780	166626	40.1	1.087	78	163.3	304.0	NA	0.962	7744	899	400m.pg151_o3_native_lto.cx7_gcp_c2s60_4g
q100.1
q100.1: range queries with 100 insert/s per client
Performance metrics for all DBMS, not just the ones listed above. Some are normalized by throughput, others are not. Legend for results is here.
ips	qps	rps	rmbps	wps	wmbps	rpq	rkbpq	wpi	wkbpi	csps	cpups	cspq	cpupq	dbgb1	dbgb2	rss	maxop	p50	p99	tag
1976	184653	178	1.1	6288.7	73.2	0.001	0.006	3.183	37.949	657034	62.9	3.558	102	163.9	270.8	0.0	0.346	9162	8774	400m.pg151_def.cx7_gcp_c2s60_4g
1976	184012	237	1.5	6273.7	71.7	0.001	0.008	3.175	37.180	655577	62.8	3.563	102	163.9	266.3	0.0	0.294	9093	8662	400m.pg151_o2_nofp.cx7_gcp_c2s60_4g
1976	185219	116	0.9	6264.1	73.1	0.001	0.005	3.170	37.865	660946	63.1	3.568	102	163.9	267.3	0.0	0.272	9222	8838	400m.pg151_o3.cx7_gcp_c2s60_4g
1976	189527	139	0.9	6257.5	73.4	0.001	0.005	3.167	38.031	675428	62.9	3.564	100	163.9	264.5	0.0	0.261	9477	9062	400m.pg151_o3_native.cx7_gcp_c2s60_4g
1976	193608	161	1.0	6279.6	72.9	0.001	0.005	3.178	37.762	689550	62.7	3.562	97	163.9	264.6	0.0	0.372	9526	9142	400m.pg151_o3_native_lto.cx7_gcp_c2s60_4g
q500.1
q500.1: range queries with 500 insert/s per client
Performance metrics for all DBMS, not just the ones listed above. Some are normalized by throughput, others are not. Legend for results is here.
ips	qps	rps	rmbps	wps	wmbps	rpq	rkbpq	wpi	wkbpi	csps	cpups	cspq	cpupq	dbgb1	dbgb2	rss	maxop	p50	p99	tag
9885	198409	5	0.0	29669.2	324.5	0.000	0.000	3.002	33.620	655833	64.9	3.305	98	167.5	253.5	0.0	0.060	9764	8746	400m.pg151_def.cx7_gcp_c2s60_4g
9885	199807	6	0.0	29617.7	327.4	0.000	0.000	2.996	33.916	657172	65.0	3.289	98	167.5	251.9	0.0	0.045	9882	8822	400m.pg151_o2_nofp.cx7_gcp_c2s60_4g
9885	198230	10	0.0	29685.6	327.6	0.000	0.000	3.003	33.941	657630	64.8	3.318	98	167.4	253.1	0.0	0.233	9785	8810	400m.pg151_o3.cx7_gcp_c2s60_4g
9885	204372	5	0.0	29556.2	326.3	0.000	0.000	2.990	33.800	674569	64.8	3.301	95	167.4	251.6	0.0	0.065	10042	9018	400m.pg151_o3_native.cx7_gcp_c2s60_4g
9885	211192	10	0.1	29498.3	327.4	0.000	0.000	2.984	33.919	694193	64.9	3.287	92	167.4	251.4	0.0	0.094	10293	9146	400m.pg151_o3_native_lto.cx7_gcp_c2s60_4g
q1000.1
q1000.1: range queries with 1000 insert/s per client
Performance metrics for all DBMS, not just the ones listed above. Some are normalized by throughput, others are not. Legend for results is here.
ips	qps	rps	rmbps	wps	wmbps	rpq	rkbpq	wpi	wkbpi	csps	cpups	cspq	cpupq	dbgb1	dbgb2	rss	maxop	p50	p99	tag
19769	200198	88	0.5	53005.6	567.2	0.000	0.003	2.681	29.380	632013	66.4	3.157	100	179.6	275.0	0.0	0.077	9845	8375	400m.pg151_def.cx7_gcp_c2s60_4g
19769	200390	91	0.6	52982.9	572.7	0.000	0.003	2.680	29.666	629902	66.3	3.143	99	179.6	275.0	0.0	0.073	9941	8407	400m.pg151_o2_nofp.cx7_gcp_c2s60_4g
19769	203504	55	0.3	53033.1	573.3	0.000	0.002	2.683	29.694	639120	66.3	3.141	98	179.6	275.1	0.0	0.079	10021	8474	400m.pg151_o3.cx7_gcp_c2s60_4g
19769	205795	59	0.3	53169.4	573.8	0.000	0.001	2.689	29.719	650494	66.2	3.161	97	179.6	275.0	0.0	0.080	10185	8726	400m.pg151_o3_native.cx7_gcp_c2s60_4g
19769	214804	79	0.5	53224.3	574.5	0.000	0.002	2.692	29.760	674123	66.2	3.138	92	179.6	275.1	0.0	0.077	10617	8954	400m.pg151_o3_native_lto.cx7_gcp_c2s60_4g
l.i0
- l.i0: load without secondary indexes
- Legend for results is here.
- Each entry lists the percentage of responses that fit in that bucket (slower than max time for previous bucket, faster than min time for next bucket).
Insert response time histogram
256us	1ms	4ms	16ms	64ms	256ms	1s	4s	16s	gt	max	tag
0.000	59.850	39.040	1.050	0.019	0.034	0.007	0.000	0.000	0.000	0.569	pg151_def.cx7_gcp_c2s60_4g
0.000	60.855	37.999	1.082	0.034	0.022	0.007	0.000	0.000	0.000	0.692	pg151_o2_nofp.cx7_gcp_c2s60_4g
0.000	62.581	36.369	0.987	0.030	0.023	0.010	0.000	0.000	0.000	0.626	pg151_o3.cx7_gcp_c2s60_4g
0.000	61.527	37.396	1.019	0.027	0.023	0.007	0.000	0.000	0.000	0.635	pg151_o3_native.cx7_gcp_c2s60_4g
0.000	62.747	36.260	0.920	0.039	0.023	0.010	0.000	0.000	0.000	0.559	pg151_o3_native_lto.cx7_gcp_c2s60_4g
l.x
- l.x: create secondary indexes
- Legend for results is here.
- Each entry lists the percentage of responses that fit in that bucket (slower than max time for previous bucket, faster than min time for next bucket).
TODO - determine whether there is data for create index response time
l.i1
- l.i1: continue load after secondary indexes created
- Legend for results is here.
- Each entry lists the percentage of responses that fit in that bucket (slower than max time for previous bucket, faster than min time for next bucket).
Insert response time histogram
256us	1ms	4ms	16ms	64ms	256ms	1s	4s	16s	gt	max	tag
0.000	0.000	58.979	34.690	5.584	0.715	0.031	nonzero	0.000	0.000	1.058	pg151_def.cx7_gcp_c2s60_4g
0.000	0.000	58.476	35.608	5.184	0.708	0.024	nonzero	0.000	0.000	1.125	pg151_o2_nofp.cx7_gcp_c2s60_4g
0.000	0.000	61.994	32.419	4.816	0.739	0.031	0.000	0.000	0.000	0.976	pg151_o3.cx7_gcp_c2s60_4g
0.000	0.000	66.489	27.825	4.906	0.747	0.033	0.000	0.000	0.000	0.784	pg151_o3_native.cx7_gcp_c2s60_4g
0.000	0.000	65.608	28.218	5.416	0.725	0.033	0.000	0.000	0.000	0.962	pg151_o3_native_lto.cx7_gcp_c2s60_4g
q100.1
- q100.1: range queries with 100 insert/s per client
- Legend for results is here.
- Each entry lists the percentage of responses that fit in that bucket (slower than max time for previous bucket, faster than min time for next bucket).
Query response time histogram
256us	1ms	4ms	16ms	64ms	256ms	1s	4s	16s	gt	max	tag
99.933	0.058	0.008	0.001	nonzero	nonzero	nonzero	0.000	0.000	0.000	0.346	pg151_def.cx7_gcp_c2s60_4g
99.932	0.059	0.008	0.001	nonzero	nonzero	nonzero	0.000	0.000	0.000	0.294	pg151_o2_nofp.cx7_gcp_c2s60_4g
99.952	0.040	0.008	0.001	nonzero	nonzero	nonzero	0.000	0.000	0.000	0.272	pg151_o3.cx7_gcp_c2s60_4g
99.951	0.040	0.007	0.001	nonzero	nonzero	nonzero	0.000	0.000	0.000	0.261	pg151_o3_native.cx7_gcp_c2s60_4g
99.951	0.041	0.007	0.001	nonzero	nonzero	nonzero	0.000	0.000	0.000	0.372	pg151_o3_native_lto.cx7_gcp_c2s60_4g
Insert response time histogram
256us	1ms	4ms	16ms	64ms	256ms	1s	4s	16s	gt	max	tag
0.000	0.000	94.136	5.372	0.490	0.001	0.000	0.000	0.000	0.000	0.213	pg151_def.cx7_gcp_c2s60_4g
0.000	0.000	96.275	3.250	0.475	0.000	0.000	0.000	0.000	0.000	0.039	pg151_o2_nofp.cx7_gcp_c2s60_4g
0.000	0.000	95.278	3.976	0.735	0.010	0.001	0.000	0.000	0.000	0.294	pg151_o3.cx7_gcp_c2s60_4g
0.000	0.000	94.549	4.579	0.857	0.015	0.000	0.000	0.000	0.000	0.246	pg151_o3_native.cx7_gcp_c2s60_4g
0.000	0.000	95.942	3.729	0.311	0.017	0.001	0.000	0.000	0.000	0.292	pg151_o3_native_lto.cx7_gcp_c2s60_4g
q500.1
- q500.1: range queries with 500 insert/s per client
- Legend for results is here.
- Each entry lists the percentage of responses that fit in that bucket (slower than max time for previous bucket, faster than min time for next bucket).
Query response time histogram
256us	1ms	4ms	16ms	64ms	256ms	1s	4s	16s	gt	max	tag
99.818	0.141	0.037	0.004	nonzero	0.000	0.000	0.000	0.000	0.000	0.060	pg151_def.cx7_gcp_c2s60_4g
99.809	0.149	0.038	0.004	nonzero	0.000	0.000	0.000	0.000	0.000	0.045	pg151_o2_nofp.cx7_gcp_c2s60_4g
99.809	0.149	0.038	0.004	nonzero	nonzero	0.000	0.000	0.000	0.000	0.233	pg151_o3.cx7_gcp_c2s60_4g
99.822	0.138	0.037	0.003	nonzero	nonzero	0.000	0.000	0.000	0.000	0.065	pg151_o3_native.cx7_gcp_c2s60_4g
99.830	0.130	0.036	0.003	nonzero	nonzero	0.000	0.000	0.000	0.000	0.094	pg151_o3_native_lto.cx7_gcp_c2s60_4g
Insert response time histogram
256us	1ms	4ms	16ms	64ms	256ms	1s	4s	16s	gt	max	tag
0.000	0.000	36.681	36.343	26.391	0.586	0.000	0.000	0.000	0.000	0.236	pg151_def.cx7_gcp_c2s60_4g
0.000	0.000	34.969	37.348	27.134	0.549	0.000	0.000	0.000	0.000	0.202	pg151_o2_nofp.cx7_gcp_c2s60_4g
0.000	0.000	35.851	37.345	26.201	0.602	0.000	0.000	0.000	0.000	0.244	pg151_o3.cx7_gcp_c2s60_4g
0.000	0.000	35.548	36.889	26.981	0.582	0.000	0.000	0.000	0.000	0.208	pg151_o3_native.cx7_gcp_c2s60_4g
0.000	0.000	35.132	36.447	27.806	0.616	0.000	0.000	0.000	0.000	0.247	pg151_o3_native_lto.cx7_gcp_c2s60_4g
q1000.1
- q1000.1: range queries with 1000 insert/s per client
- Legend for results is here.
- Each entry lists the percentage of responses that fit in that bucket (slower than max time for previous bucket, faster than min time for next bucket).
Query response time histogram
256us	1ms	4ms	16ms	64ms	256ms	1s	4s	16s	gt	max	tag
99.434	0.447	0.108	0.011	0.001	nonzero	0.000	0.000	0.000	0.000	0.077	pg151_def.cx7_gcp_c2s60_4g
99.403	0.473	0.113	0.011	0.001	nonzero	0.000	0.000	0.000	0.000	0.073	pg151_o2_nofp.cx7_gcp_c2s60_4g
99.425	0.455	0.109	0.011	0.001	nonzero	0.000	0.000	0.000	0.000	0.079	pg151_o3.cx7_gcp_c2s60_4g
99.436	0.447	0.107	0.010	0.001	nonzero	0.000	0.000	0.000	0.000	0.080	pg151_o3_native.cx7_gcp_c2s60_4g
99.475	0.415	0.100	0.009	0.001	nonzero	0.000	0.000	0.000	0.000	0.077	pg151_o3_native_lto.cx7_gcp_c2s60_4g
Insert response time histogram
256us	1ms	4ms	16ms	64ms	256ms	1s	4s	16s	gt	max	tag
0.000	0.000	32.952	48.638	17.508	0.903	0.000	0.000	0.000	0.000	0.253	pg151_def.cx7_gcp_c2s60_4g
0.000	0.000	29.516	51.217	18.369	0.895	0.003	0.000	0.000	0.000	0.311	pg151_o2_nofp.cx7_gcp_c2s60_4g
0.000	0.000	29.909	50.346	18.802	0.943	0.000	0.000	0.000	0.000	0.220	pg151_o3.cx7_gcp_c2s60_4g
0.000	0.000	29.577	50.243	19.305	0.876	0.000	0.000	0.000	0.000	0.236	pg151_o3_native.cx7_gcp_c2s60_4g
0.000	0.000	29.946	50.558	18.626	0.870	0.000	0.000	0.000	0.000	0.250	pg151_o3_native_lto.cx7_gcp_c2s60_4g