Introduction
This is a report for the insert benchmark with 20M docs and 4 client(s). It is generated by scripts (bash, awk, sed) and Tufte might not be impressed. An overview of the insert benchmark is here and a short update is here. Below, by DBMS, I mean DBMS+version.config. An example is my8020.c10b40 where my means MySQL, 8020 is version 8.0.20 and c10b40 is the name for the configuration file.
The test server has 8 AMD cores, 16G RAM and an NVMe SSD. It is described here as the Beelink. The benchmark was run with 4 clients and there were 1 or 2 connections per client (1 for queries, 1 for inserts). It uses 1 table. It loads 20M rows without secondary indexes, creates secondary indexes, loads another 20M rows then does 3 read+write tests for one hour each that do queries as fast as possible with 100, 500 and then 1000 writes/second/client concurrent with the queries. The database is cached by the storage engine and the only IO is for writes. Clients and the DBMS share one server. The per-database configs are in the per-database subdirectories here.
The tested DBMS are:
- pg1119_o3_native_lto.cx7 - Postgres 11.19, the cx7 config and the build used: -O3 -march=native -mtune=native
- pg1214_o3_native_lto.cx7 - Postgres 12.14, the cx7 config and the build used: -O3 -march=native -mtune=native
- pg1310_o3_native_lto.cx7 - Postgres 13.10, the cx7 config and the build used: -O3 -march=native -mtune=native
- pg147_o3_native_lto.cx7 - Postgres 14.7, the cx7 config and the build used: -O3 -march=native -mtune=native
- pg151_o3_native_lto.cx7 - Postgres 15.1, the cx7 config and the build used: -O3 -march=native -mtune=native
- pg152_o3_native_lto.cx7 - Postgres 15.2, the cx7 config and the build used: -O3 -march=native -mtune=native
- pg16prebeta - Postgres 16 from the main branch at git sha 1ab763fc2, the cx7 config and the build used: -O3 -march=native -mtune=native
Contents
- Summary
- l.i0: load without secondary indexes
- l.x: create secondary indexes
- l.i1: continue load after secondary indexes created
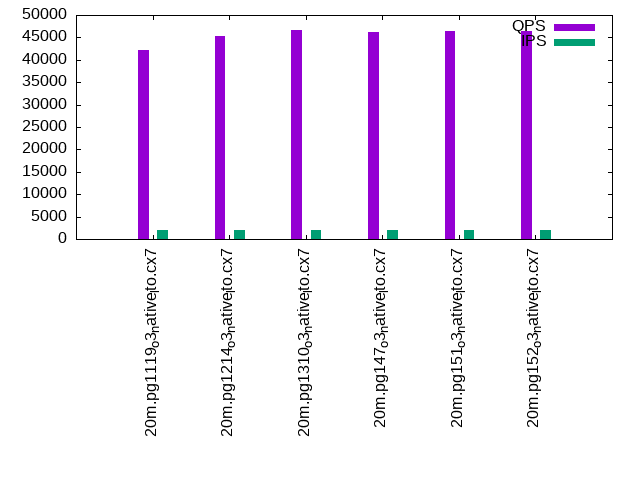
- q100.1: range queries with 100 insert/s per client
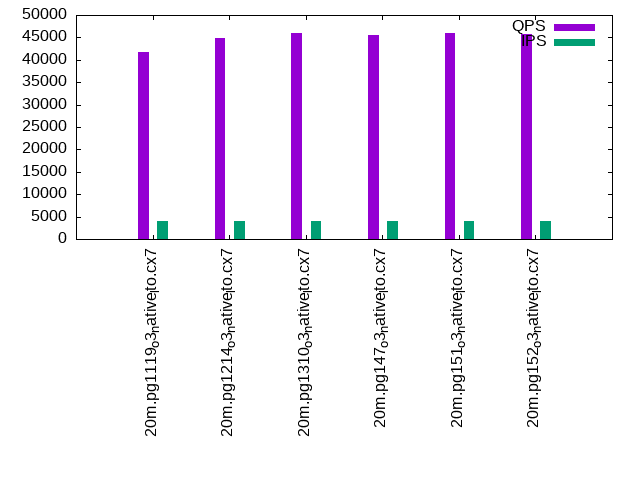
- q500.1: range queries with 500 insert/s per client
- q1000.1: range queries with 1000 insert/s per client
Summary
The numbers are inserts/s for l.i0 and l.i1, indexed docs (or rows) /s for l.x and queries/s for q*.2. The values are the average rate over the entire test for inserts (IPS) and queries (QPS). The range of values for IPS and QPS is split into 3 parts: bottom 25%, middle 50%, top 25%. Values in the bottom 25% have a red background, values in the top 25% have a green background and values in the middle have no color. A gray background is used for values that can be ignored because the DBMS did not sustain the target insert rate. Red backgrounds are not used when the minimum value is within 80% of the max value.
| dbms | l.i0 | l.x | l.i1 | q100.1 | q500.1 | q1000.1 |
|---|---|---|---|---|---|---|
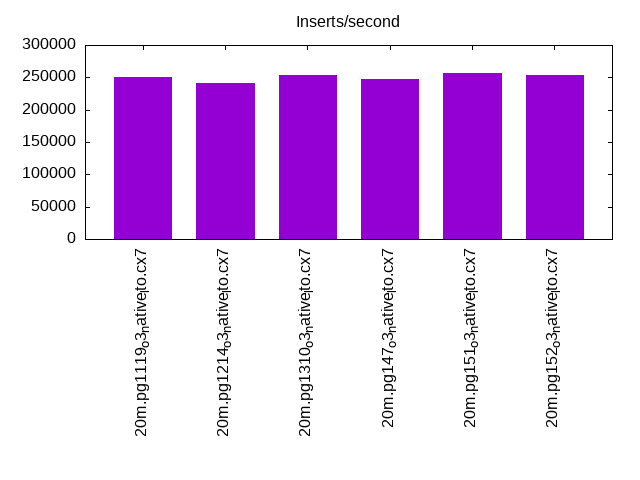
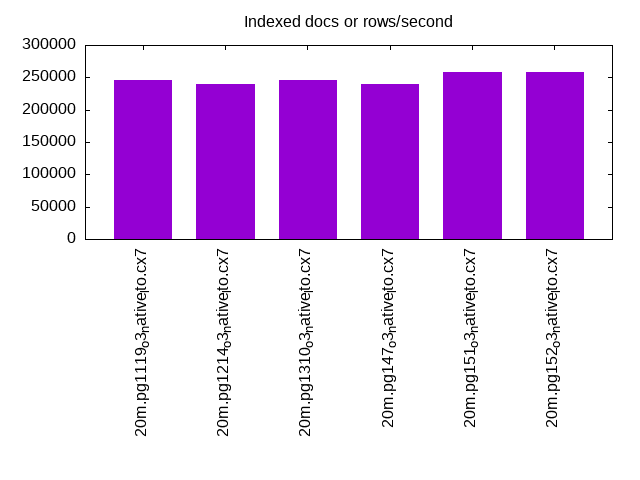
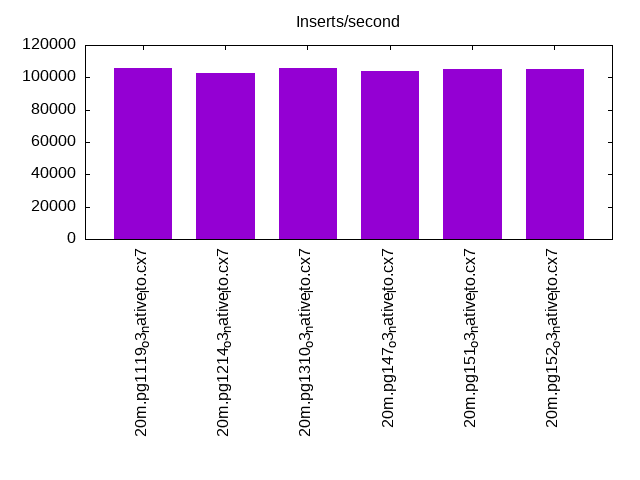
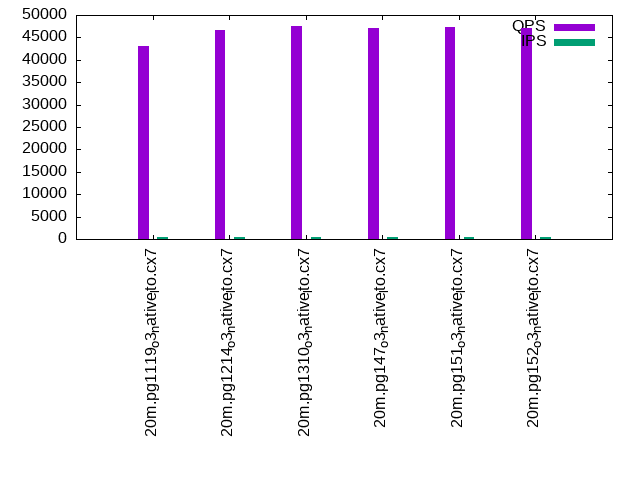
| 20m.pg1119_o3_native_lto.cx7 | 250000 | 245122 | 105820 | 43082 | 42105 | 41810 |
| 20m.pg1214_o3_native_lto.cx7 | 240964 | 239286 | 102564 | 46560 | 45224 | 44908 |
| 20m.pg1310_o3_native_lto.cx7 | 253164 | 245122 | 105820 | 47525 | 46617 | 45990 |
| 20m.pg147_o3_native_lto.cx7 | 246914 | 239286 | 104167 | 47036 | 46239 | 45587 |
| 20m.pg151_o3_native_lto.cx7 | 256410 | 257692 | 105263 | 47361 | 46330 | 45924 |
| 20m.pg152_o3_native_lto.cx7 | 253164 | 257692 | 105263 | 47118 | 46367 | 45650 |
This table has relative throughput, throughput for the DBMS relative to the DBMS in the first line, using the absolute throughput from the previous table.
| dbms | l.i0 | l.x | l.i1 | q100.1 | q500.1 | q1000.1 |
|---|---|---|---|---|---|---|
| 20m.pg1119_o3_native_lto.cx7 | 1.00 | 1.00 | 1.00 | 1.00 | 1.00 | 1.00 |
| 20m.pg1214_o3_native_lto.cx7 | 0.96 | 0.98 | 0.97 | 1.08 | 1.07 | 1.07 |
| 20m.pg1310_o3_native_lto.cx7 | 1.01 | 1.00 | 1.00 | 1.10 | 1.11 | 1.10 |
| 20m.pg147_o3_native_lto.cx7 | 0.99 | 0.98 | 0.98 | 1.09 | 1.10 | 1.09 |
| 20m.pg151_o3_native_lto.cx7 | 1.03 | 1.05 | 0.99 | 1.10 | 1.10 | 1.10 |
| 20m.pg152_o3_native_lto.cx7 | 1.01 | 1.05 | 0.99 | 1.09 | 1.10 | 1.09 |
This lists the average rate of inserts/s for the tests that do inserts concurrent with queries. For such tests the query rate is listed in the table above. The read+write tests are setup so that the insert rate should match the target rate every second. Cells that are not at least 95% of the target have a red background to indicate a failure to satisfy the target.
| dbms | q100.1 | q500.1 | q1000.1 |
|---|---|---|---|
| pg1119_o3_native_lto.cx7 | 399 | 1994 | 3989 |
| pg1214_o3_native_lto.cx7 | 399 | 1993 | 3989 |
| pg1310_o3_native_lto.cx7 | 399 | 1993 | 3989 |
| pg147_o3_native_lto.cx7 | 399 | 1994 | 3989 |
| pg151_o3_native_lto.cx7 | 399 | 1994 | 3989 |
| pg152_o3_native_lto.cx7 | 399 | 1994 | 3989 |
| target | 400 | 2000 | 4000 |
l.i0
l.i0: load without secondary indexes. Graphs for performance per 1-second interval are here.
Average throughput:
Insert response time histogram: each cell has the percentage of responses that take <= the time in the header and max is the max response time in seconds. For the max column values in the top 25% of the range have a red background and in the bottom 25% of the range have a green background. The red background is not used when the min value is within 80% of the max value.
| dbms | 256us | 1ms | 4ms | 16ms | 64ms | 256ms | 1s | 4s | 16s | gt | max |
|---|---|---|---|---|---|---|---|---|---|---|---|
| pg1119_o3_native_lto.cx7 | 99.963 | 0.037 | 0.012 | ||||||||
| pg1214_o3_native_lto.cx7 | 99.965 | 0.035 | 0.011 | ||||||||
| pg1310_o3_native_lto.cx7 | 0.015 | 99.934 | 0.051 | 0.012 | |||||||
| pg147_o3_native_lto.cx7 | 99.966 | 0.034 | 0.011 | ||||||||
| pg151_o3_native_lto.cx7 | 0.004 | 99.959 | 0.037 | 0.010 | |||||||
| pg152_o3_native_lto.cx7 | 0.011 | 99.941 | 0.049 | 0.010 |
Performance metrics for the DBMS listed above. Some are normalized by throughput, others are not. Legend for results is here.
ips	qps	rps	rmbps	wps	wmbps	rpq	rkbpq	wpi	wkbpi	csps	cpups	cspq	cpupq	dbgb1	dbgb2	rss	maxop	p50	p99	tag
250000	0	0	0.0	296.5	107.5	0.000	0.000	0.001	0.440	27089	68.9	0.108	22	2.2	5.6	0.0	0.012	73347	6992	20m.pg1119_o3_native_lto.cx7
240964	0	0	0.0	289.1	105.1	0.000	0.000	0.001	0.446	26552	69.9	0.110	23	2.1	5.6	0.0	0.011	71223	35561	20m.pg1214_o3_native_lto.cx7
253164	0	0	0.0	306.5	111.3	0.000	0.000	0.001	0.450	28256	69.8	0.112	22	2.1	5.6	0.0	0.012	75618	11488	20m.pg1310_o3_native_lto.cx7
246914	0	0	0.0	291.9	106.1	0.000	0.000	0.001	0.440	26843	70.0	0.109	23	2.1	5.6	0.0	0.011	72322	51843	20m.pg147_o3_native_lto.cx7
256410	0	0	0.0	307.5	111.3	0.000	0.000	0.001	0.445	28137	69.8	0.110	22	2.1	5.6	0.0	0.010	75916	13585	20m.pg151_o3_native_lto.cx7
253164	0	0	0.0	306.7	111.3	0.000	0.000	0.001	0.450	27916	69.8	0.110	22	2.1	5.6	0.0	0.010	76143	70245	20m.pg152_o3_native_lto.cx7
l.x
l.x: create secondary indexes.
Average throughput:
Performance metrics for the DBMS listed above. Some are normalized by throughput, others are not. Legend for results is here.
ips	qps	rps	rmbps	wps	wmbps	rpq	rkbpq	wpi	wkbpi	csps	cpups	cspq	cpupq	dbgb1	dbgb2	rss	maxop	p50	p99	tag
245122	0	0	0.0	131.4	61.7	0.000	0.000	0.001	0.258	733	12.6	0.003	4	3.9	9.0	0.0	0.003	NA	NA	20m.pg1119_o3_native_lto.cx7
239286	0	0	0.0	108.8	51.0	0.000	0.000	0.000	0.218	770	12.7	0.003	4	3.9	9.0	0.0	0.003	NA	NA	20m.pg1214_o3_native_lto.cx7
245122	0	0	0.0	119.0	55.9	0.000	0.000	0.000	0.234	790	12.5	0.003	4	3.9	9.0	0.0	0.003	NA	NA	20m.pg1310_o3_native_lto.cx7
239286	0	0	0.0	112.1	52.7	0.000	0.000	0.000	0.226	744	12.6	0.003	4	3.9	9.0	0.0	0.003	NA	NA	20m.pg147_o3_native_lto.cx7
257692	0	0	0.0	120.9	56.7	0.000	0.000	0.000	0.225	812	12.7	0.003	4	3.9	9.0	0.0	0.003	NA	NA	20m.pg151_o3_native_lto.cx7
257692	0	0	0.0	132.9	61.9	0.000	0.000	0.001	0.246	741	12.7	0.003	4	3.9	9.0	0.0	0.003	NA	NA	20m.pg152_o3_native_lto.cx7
l.i1
l.i1: continue load after secondary indexes created. Graphs for performance per 1-second interval are here.
Average throughput:
Insert response time histogram: each cell has the percentage of responses that take <= the time in the header and max is the max response time in seconds. For the max column values in the top 25% of the range have a red background and in the bottom 25% of the range have a green background. The red background is not used when the min value is within 80% of the max value.
| dbms | 256us | 1ms | 4ms | 16ms | 64ms | 256ms | 1s | 4s | 16s | gt | max |
|---|---|---|---|---|---|---|---|---|---|---|---|
| pg1119_o3_native_lto.cx7 | 99.831 | 0.063 | 0.105 | 0.052 | |||||||
| pg1214_o3_native_lto.cx7 | 99.823 | 0.071 | 0.107 | 0.048 | |||||||
| pg1310_o3_native_lto.cx7 | 99.836 | 0.060 | 0.103 | 0.001 | 0.121 | ||||||
| pg147_o3_native_lto.cx7 | 99.840 | 0.057 | 0.102 | 0.057 | |||||||
| pg151_o3_native_lto.cx7 | 99.790 | 0.078 | 0.132 | 0.055 | |||||||
| pg152_o3_native_lto.cx7 | 99.797 | 0.069 | 0.134 | 0.055 |
Performance metrics for the DBMS listed above. Some are normalized by throughput, others are not. Legend for results is here.
ips	qps	rps	rmbps	wps	wmbps	rpq	rkbpq	wpi	wkbpi	csps	cpups	cspq	cpupq	dbgb1	dbgb2	rss	maxop	p50	p99	tag
105820	0	0	0.0	467.2	160.1	0.000	0.000	0.004	1.549	22613	62.8	0.214	47	8.8	24.8	0.0	0.052	27729	5498	20m.pg1119_o3_native_lto.cx7
102564	0	0	0.0	461.2	156.9	0.000	0.000	0.004	1.567	22262	62.7	0.217	49	8.6	24.6	0.0	0.048	27221	5797	20m.pg1214_o3_native_lto.cx7
105820	0	0	0.0	454.9	155.8	0.000	0.000	0.004	1.507	22680	62.8	0.214	47	8.6	24.5	0.0	0.121	27970	4799	20m.pg1310_o3_native_lto.cx7
104167	0	0	0.0	436.4	151.1	0.000	0.000	0.004	1.486	22474	63.8	0.216	49	8.6	24.5	0.0	0.057	27670	5096	20m.pg147_o3_native_lto.cx7
105263	0	0	0.0	452.1	155.7	0.000	0.000	0.004	1.515	22456	63.2	0.213	48	8.6	24.9	0.0	0.055	28070	4095	20m.pg151_o3_native_lto.cx7
105263	0	4	0.0	460.7	158.8	0.000	0.000	0.004	1.544	22594	63.4	0.215	48	8.6	24.9	0.0	0.055	28317	3847	20m.pg152_o3_native_lto.cx7
q100.1
q100.1: range queries with 100 insert/s per client. Graphs for performance per 1-second interval are here.
Average throughput:
Query response time histogram: each cell has the percentage of responses that take <= the time in the header and max is the max response time in seconds. For max values in the top 25% of the range have a red background and in the bottom 25% of the range have a green background. The red background is not used when the min value is within 80% of the max value.
| dbms | 256us | 1ms | 4ms | 16ms | 64ms | 256ms | 1s | 4s | 16s | gt | max |
|---|---|---|---|---|---|---|---|---|---|---|---|
| pg1119_o3_native_lto.cx7 | 99.984 | 0.010 | 0.006 | nonzero | 0.008 | ||||||
| pg1214_o3_native_lto.cx7 | 99.986 | 0.008 | 0.005 | nonzero | 0.011 | ||||||
| pg1310_o3_native_lto.cx7 | 99.987 | 0.007 | 0.005 | nonzero | 0.008 | ||||||
| pg147_o3_native_lto.cx7 | 99.985 | 0.010 | 0.005 | nonzero | 0.006 | ||||||
| pg151_o3_native_lto.cx7 | 99.986 | 0.009 | 0.005 | nonzero | 0.007 | ||||||
| pg152_o3_native_lto.cx7 | 99.986 | 0.009 | 0.005 | nonzero | 0.008 |
Insert response time histogram: each cell has the percentage of responses that take <= the time in the header and max is the max response time in seconds. For max values in the top 25% of the range have a red background and in the bottom 25% of the range have a green background. The red background is not used when the min value is within 80% of the max value.
| dbms | 256us | 1ms | 4ms | 16ms | 64ms | 256ms | 1s | 4s | 16s | gt | max |
|---|---|---|---|---|---|---|---|---|---|---|---|
| pg1119_o3_native_lto.cx7 | 99.528 | 0.472 | 0.007 | ||||||||
| pg1214_o3_native_lto.cx7 | 99.785 | 0.215 | 0.009 | ||||||||
| pg1310_o3_native_lto.cx7 | 99.750 | 0.250 | 0.007 | ||||||||
| pg147_o3_native_lto.cx7 | 99.403 | 0.597 | 0.012 | ||||||||
| pg151_o3_native_lto.cx7 | 99.736 | 0.264 | 0.008 | ||||||||
| pg152_o3_native_lto.cx7 | 99.569 | 0.431 | 0.008 |
Performance metrics for the DBMS listed above. Some are normalized by throughput, others are not. Legend for results is here.
ips	qps	rps	rmbps	wps	wmbps	rpq	rkbpq	wpi	wkbpi	csps	cpups	cspq	cpupq	dbgb1	dbgb2	rss	maxop	p50	p99	tag
399	43082	0	0.0	332.1	13.8	0.000	0.000	0.833	35.445	164383	50.4	3.816	94	9.0	22.2	0.0	0.008	10883	9416	20m.pg1119_o3_native_lto.cx7
399	46560	0	0.0	319.2	13.6	0.000	0.000	0.801	34.992	177603	50.5	3.814	87	8.7	21.4	0.0	0.011	11763	10536	20m.pg1214_o3_native_lto.cx7
399	47525	0	0.0	311.7	12.7	0.000	0.000	0.782	32.723	181261	50.4	3.814	85	8.7	21.5	0.0	0.008	11912	10756	20m.pg1310_o3_native_lto.cx7
399	47036	0	0.0	291.1	12.6	0.000	0.000	0.730	32.321	179440	50.4	3.815	86	8.7	24.7	0.0	0.006	11811	10756	20m.pg147_o3_native_lto.cx7
399	47361	0	0.0	291.2	12.6	0.000	0.000	0.730	32.261	180571	50.4	3.813	85	8.7	24.9	0.0	0.007	11891	10723	20m.pg151_o3_native_lto.cx7
399	47118	0	0.0	291.2	12.5	0.000	0.000	0.730	32.177	179672	50.5	3.813	86	8.7	25.0	0.0	0.008	11907	10772	20m.pg152_o3_native_lto.cx7
q500.1
q500.1: range queries with 500 insert/s per client. Graphs for performance per 1-second interval are here.
Average throughput:
Query response time histogram: each cell has the percentage of responses that take <= the time in the header and max is the max response time in seconds. For max values in the top 25% of the range have a red background and in the bottom 25% of the range have a green background. The red background is not used when the min value is within 80% of the max value.
| dbms | 256us | 1ms | 4ms | 16ms | 64ms | 256ms | 1s | 4s | 16s | gt | max |
|---|---|---|---|---|---|---|---|---|---|---|---|
| pg1119_o3_native_lto.cx7 | 99.950 | 0.032 | 0.017 | 0.001 | nonzero | 0.018 | |||||
| pg1214_o3_native_lto.cx7 | 99.958 | 0.026 | 0.016 | 0.001 | 0.016 | ||||||
| pg1310_o3_native_lto.cx7 | 99.962 | 0.023 | 0.015 | 0.001 | nonzero | 0.019 | |||||
| pg147_o3_native_lto.cx7 | 99.958 | 0.025 | 0.016 | 0.001 | nonzero | 0.019 | |||||
| pg151_o3_native_lto.cx7 | 99.961 | 0.022 | 0.016 | 0.001 | nonzero | 0.028 | |||||
| pg152_o3_native_lto.cx7 | 99.960 | 0.023 | 0.016 | 0.001 | nonzero | 0.019 |
Insert response time histogram: each cell has the percentage of responses that take <= the time in the header and max is the max response time in seconds. For max values in the top 25% of the range have a red background and in the bottom 25% of the range have a green background. The red background is not used when the min value is within 80% of the max value.
| dbms | 256us | 1ms | 4ms | 16ms | 64ms | 256ms | 1s | 4s | 16s | gt | max |
|---|---|---|---|---|---|---|---|---|---|---|---|
| pg1119_o3_native_lto.cx7 | 96.485 | 3.444 | 0.067 | 0.004 | 0.098 | ||||||
| pg1214_o3_native_lto.cx7 | 97.539 | 2.425 | 0.036 | 0.030 | |||||||
| pg1310_o3_native_lto.cx7 | 96.792 | 3.132 | 0.074 | 0.003 | 0.107 | ||||||
| pg147_o3_native_lto.cx7 | 97.233 | 2.744 | 0.022 | 0.030 | |||||||
| pg151_o3_native_lto.cx7 | 96.807 | 3.143 | 0.050 | 0.033 | |||||||
| pg152_o3_native_lto.cx7 | 97.618 | 2.329 | 0.053 | 0.044 |
Performance metrics for the DBMS listed above. Some are normalized by throughput, others are not. Legend for results is here.
ips	qps	rps	rmbps	wps	wmbps	rpq	rkbpq	wpi	wkbpi	csps	cpups	cspq	cpupq	dbgb1	dbgb2	rss	maxop	p50	p99	tag
1994	42105	7	0.1	242.2	22.3	0.000	0.001	0.121	11.433	159819	51.2	3.796	97	10.5	19.6	0.0	0.018	10612	8957	20m.pg1119_o3_native_lto.cx7
1993	45224	2	0.0	202.9	21.8	0.000	0.000	0.102	11.185	171658	51.3	3.796	91	10.2	19.0	0.0	0.016	11352	10089	20m.pg1214_o3_native_lto.cx7
1993	46617	2	0.0	207.5	21.6	0.000	0.000	0.104	11.108	176982	51.3	3.797	88	10.2	19.1	0.0	0.019	11719	10628	20m.pg1310_o3_native_lto.cx7
1994	46239	2	0.0	273.7	20.5	0.000	0.000	0.137	10.500	175368	51.3	3.793	89	10.2	21.3	0.0	0.019	11587	10181	20m.pg147_o3_native_lto.cx7
1994	46330	2	0.0	273.5	20.4	0.000	0.000	0.137	10.495	175680	51.3	3.792	89	10.2	21.5	0.0	0.028	11603	10264	20m.pg151_o3_native_lto.cx7
1994	46367	2	0.0	273.9	20.5	0.000	0.000	0.137	10.500	175828	51.4	3.792	89	10.2	21.5	0.0	0.019	11715	9542	20m.pg152_o3_native_lto.cx7
q1000.1
q1000.1: range queries with 1000 insert/s per client. Graphs for performance per 1-second interval are here.
Average throughput:
Query response time histogram: each cell has the percentage of responses that take <= the time in the header and max is the max response time in seconds. For max values in the top 25% of the range have a red background and in the bottom 25% of the range have a green background. The red background is not used when the min value is within 80% of the max value.
| dbms | 256us | 1ms | 4ms | 16ms | 64ms | 256ms | 1s | 4s | 16s | gt | max |
|---|---|---|---|---|---|---|---|---|---|---|---|
| pg1119_o3_native_lto.cx7 | 99.912 | 0.062 | 0.025 | 0.001 | nonzero | 0.019 | |||||
| pg1214_o3_native_lto.cx7 | 99.915 | 0.057 | 0.026 | 0.001 | nonzero | 0.023 | |||||
| pg1310_o3_native_lto.cx7 | 99.915 | 0.058 | 0.026 | 0.001 | 0.015 | ||||||
| pg147_o3_native_lto.cx7 | 99.913 | 0.059 | 0.027 | 0.001 | nonzero | 0.020 | |||||
| pg151_o3_native_lto.cx7 | 99.916 | 0.056 | 0.027 | 0.001 | 0.016 | ||||||
| pg152_o3_native_lto.cx7 | 99.922 | 0.051 | 0.026 | 0.001 | nonzero | 0.023 |
Insert response time histogram: each cell has the percentage of responses that take <= the time in the header and max is the max response time in seconds. For max values in the top 25% of the range have a red background and in the bottom 25% of the range have a green background. The red background is not used when the min value is within 80% of the max value.
| dbms | 256us | 1ms | 4ms | 16ms | 64ms | 256ms | 1s | 4s | 16s | gt | max |
|---|---|---|---|---|---|---|---|---|---|---|---|
| pg1119_o3_native_lto.cx7 | 96.058 | 3.871 | 0.071 | 0.039 | |||||||
| pg1214_o3_native_lto.cx7 | 94.101 | 5.812 | 0.087 | 0.040 | |||||||
| pg1310_o3_native_lto.cx7 | 94.533 | 5.386 | 0.081 | 0.029 | |||||||
| pg147_o3_native_lto.cx7 | 94.870 | 5.053 | 0.076 | 0.025 | |||||||
| pg151_o3_native_lto.cx7 | 95.317 | 4.617 | 0.067 | 0.030 | |||||||
| pg152_o3_native_lto.cx7 | 96.085 | 3.869 | 0.045 | 0.028 |
Performance metrics for the DBMS listed above. Some are normalized by throughput, others are not. Legend for results is here.
ips	qps	rps	rmbps	wps	wmbps	rpq	rkbpq	wpi	wkbpi	csps	cpups	cspq	cpupq	dbgb1	dbgb2	rss	maxop	p50	p99	tag
3989	41810	18	0.2	214.7	28.1	0.000	0.004	0.054	7.203	157283	52.3	3.762	100	12.6	20.0	0.0	0.019	10516	8790	20m.pg1119_o3_native_lto.cx7
3989	44908	20	0.2	241.7	28.7	0.000	0.004	0.061	7.358	168784	52.4	3.758	93	12.6	19.8	0.0	0.023	11192	9829	20m.pg1214_o3_native_lto.cx7
3989	45990	26	0.2	243.2	28.6	0.001	0.005	0.061	7.341	173148	52.4	3.765	91	12.6	19.8	0.0	0.015	11619	10313	20m.pg1310_o3_native_lto.cx7
3989	45587	25	0.2	323.3	27.4	0.001	0.005	0.081	7.022	171507	52.4	3.762	92	12.6	21.7	0.0	0.020	11428	9813	20m.pg147_o3_native_lto.cx7
3989	45924	25	0.2	323.5	27.3	0.001	0.005	0.081	7.020	172762	52.4	3.762	91	12.6	21.8	0.0	0.016	11555	9805	20m.pg151_o3_native_lto.cx7
3989	45650	26	0.2	323.1	27.4	0.001	0.005	0.081	7.021	171630	52.4	3.760	92	12.6	21.8	0.0	0.023	11556	9877	20m.pg152_o3_native_lto.cx7
l.i0
l.i0: load without secondary indexes
Performance metrics for all DBMS, not just the ones listed above. Some are normalized by throughput, others are not. Legend for results is here.
ips	qps	rps	rmbps	wps	wmbps	rpq	rkbpq	wpi	wkbpi	csps	cpups	cspq	cpupq	dbgb1	dbgb2	rss	maxop	p50	p99	tag
250000	0	0	0.0	296.5	107.5	0.000	0.000	0.001	0.440	27089	68.9	0.108	22	2.2	5.6	0.0	0.012	73347	6992	20m.pg1119_o3_native_lto.cx7
240964	0	0	0.0	289.1	105.1	0.000	0.000	0.001	0.446	26552	69.9	0.110	23	2.1	5.6	0.0	0.011	71223	35561	20m.pg1214_o3_native_lto.cx7
253164	0	0	0.0	306.5	111.3	0.000	0.000	0.001	0.450	28256	69.8	0.112	22	2.1	5.6	0.0	0.012	75618	11488	20m.pg1310_o3_native_lto.cx7
246914	0	0	0.0	291.9	106.1	0.000	0.000	0.001	0.440	26843	70.0	0.109	23	2.1	5.6	0.0	0.011	72322	51843	20m.pg147_o3_native_lto.cx7
256410	0	0	0.0	307.5	111.3	0.000	0.000	0.001	0.445	28137	69.8	0.110	22	2.1	5.6	0.0	0.010	75916	13585	20m.pg151_o3_native_lto.cx7
253164	0	0	0.0	306.7	111.3	0.000	0.000	0.001	0.450	27916	69.8	0.110	22	2.1	5.6	0.0	0.010	76143	70245	20m.pg152_o3_native_lto.cx7
l.x
l.x: create secondary indexes
Performance metrics for all DBMS, not just the ones listed above. Some are normalized by throughput, others are not. Legend for results is here.
ips	qps	rps	rmbps	wps	wmbps	rpq	rkbpq	wpi	wkbpi	csps	cpups	cspq	cpupq	dbgb1	dbgb2	rss	maxop	p50	p99	tag
245122	0	0	0.0	131.4	61.7	0.000	0.000	0.001	0.258	733	12.6	0.003	4	3.9	9.0	0.0	0.003	NA	NA	20m.pg1119_o3_native_lto.cx7
239286	0	0	0.0	108.8	51.0	0.000	0.000	0.000	0.218	770	12.7	0.003	4	3.9	9.0	0.0	0.003	NA	NA	20m.pg1214_o3_native_lto.cx7
245122	0	0	0.0	119.0	55.9	0.000	0.000	0.000	0.234	790	12.5	0.003	4	3.9	9.0	0.0	0.003	NA	NA	20m.pg1310_o3_native_lto.cx7
239286	0	0	0.0	112.1	52.7	0.000	0.000	0.000	0.226	744	12.6	0.003	4	3.9	9.0	0.0	0.003	NA	NA	20m.pg147_o3_native_lto.cx7
257692	0	0	0.0	120.9	56.7	0.000	0.000	0.000	0.225	812	12.7	0.003	4	3.9	9.0	0.0	0.003	NA	NA	20m.pg151_o3_native_lto.cx7
257692	0	0	0.0	132.9	61.9	0.000	0.000	0.001	0.246	741	12.7	0.003	4	3.9	9.0	0.0	0.003	NA	NA	20m.pg152_o3_native_lto.cx7
l.i1
l.i1: continue load after secondary indexes created
Performance metrics for all DBMS, not just the ones listed above. Some are normalized by throughput, others are not. Legend for results is here.
ips	qps	rps	rmbps	wps	wmbps	rpq	rkbpq	wpi	wkbpi	csps	cpups	cspq	cpupq	dbgb1	dbgb2	rss	maxop	p50	p99	tag
105820	0	0	0.0	467.2	160.1	0.000	0.000	0.004	1.549	22613	62.8	0.214	47	8.8	24.8	0.0	0.052	27729	5498	20m.pg1119_o3_native_lto.cx7
102564	0	0	0.0	461.2	156.9	0.000	0.000	0.004	1.567	22262	62.7	0.217	49	8.6	24.6	0.0	0.048	27221	5797	20m.pg1214_o3_native_lto.cx7
105820	0	0	0.0	454.9	155.8	0.000	0.000	0.004	1.507	22680	62.8	0.214	47	8.6	24.5	0.0	0.121	27970	4799	20m.pg1310_o3_native_lto.cx7
104167	0	0	0.0	436.4	151.1	0.000	0.000	0.004	1.486	22474	63.8	0.216	49	8.6	24.5	0.0	0.057	27670	5096	20m.pg147_o3_native_lto.cx7
105263	0	0	0.0	452.1	155.7	0.000	0.000	0.004	1.515	22456	63.2	0.213	48	8.6	24.9	0.0	0.055	28070	4095	20m.pg151_o3_native_lto.cx7
105263	0	4	0.0	460.7	158.8	0.000	0.000	0.004	1.544	22594	63.4	0.215	48	8.6	24.9	0.0	0.055	28317	3847	20m.pg152_o3_native_lto.cx7
q100.1
q100.1: range queries with 100 insert/s per client
Performance metrics for all DBMS, not just the ones listed above. Some are normalized by throughput, others are not. Legend for results is here.
ips	qps	rps	rmbps	wps	wmbps	rpq	rkbpq	wpi	wkbpi	csps	cpups	cspq	cpupq	dbgb1	dbgb2	rss	maxop	p50	p99	tag
399	43082	0	0.0	332.1	13.8	0.000	0.000	0.833	35.445	164383	50.4	3.816	94	9.0	22.2	0.0	0.008	10883	9416	20m.pg1119_o3_native_lto.cx7
399	46560	0	0.0	319.2	13.6	0.000	0.000	0.801	34.992	177603	50.5	3.814	87	8.7	21.4	0.0	0.011	11763	10536	20m.pg1214_o3_native_lto.cx7
399	47525	0	0.0	311.7	12.7	0.000	0.000	0.782	32.723	181261	50.4	3.814	85	8.7	21.5	0.0	0.008	11912	10756	20m.pg1310_o3_native_lto.cx7
399	47036	0	0.0	291.1	12.6	0.000	0.000	0.730	32.321	179440	50.4	3.815	86	8.7	24.7	0.0	0.006	11811	10756	20m.pg147_o3_native_lto.cx7
399	47361	0	0.0	291.2	12.6	0.000	0.000	0.730	32.261	180571	50.4	3.813	85	8.7	24.9	0.0	0.007	11891	10723	20m.pg151_o3_native_lto.cx7
399	47118	0	0.0	291.2	12.5	0.000	0.000	0.730	32.177	179672	50.5	3.813	86	8.7	25.0	0.0	0.008	11907	10772	20m.pg152_o3_native_lto.cx7
q500.1
q500.1: range queries with 500 insert/s per client
Performance metrics for all DBMS, not just the ones listed above. Some are normalized by throughput, others are not. Legend for results is here.
ips	qps	rps	rmbps	wps	wmbps	rpq	rkbpq	wpi	wkbpi	csps	cpups	cspq	cpupq	dbgb1	dbgb2	rss	maxop	p50	p99	tag
1994	42105	7	0.1	242.2	22.3	0.000	0.001	0.121	11.433	159819	51.2	3.796	97	10.5	19.6	0.0	0.018	10612	8957	20m.pg1119_o3_native_lto.cx7
1993	45224	2	0.0	202.9	21.8	0.000	0.000	0.102	11.185	171658	51.3	3.796	91	10.2	19.0	0.0	0.016	11352	10089	20m.pg1214_o3_native_lto.cx7
1993	46617	2	0.0	207.5	21.6	0.000	0.000	0.104	11.108	176982	51.3	3.797	88	10.2	19.1	0.0	0.019	11719	10628	20m.pg1310_o3_native_lto.cx7
1994	46239	2	0.0	273.7	20.5	0.000	0.000	0.137	10.500	175368	51.3	3.793	89	10.2	21.3	0.0	0.019	11587	10181	20m.pg147_o3_native_lto.cx7
1994	46330	2	0.0	273.5	20.4	0.000	0.000	0.137	10.495	175680	51.3	3.792	89	10.2	21.5	0.0	0.028	11603	10264	20m.pg151_o3_native_lto.cx7
1994	46367	2	0.0	273.9	20.5	0.000	0.000	0.137	10.500	175828	51.4	3.792	89	10.2	21.5	0.0	0.019	11715	9542	20m.pg152_o3_native_lto.cx7
q1000.1
q1000.1: range queries with 1000 insert/s per client
Performance metrics for all DBMS, not just the ones listed above. Some are normalized by throughput, others are not. Legend for results is here.
ips	qps	rps	rmbps	wps	wmbps	rpq	rkbpq	wpi	wkbpi	csps	cpups	cspq	cpupq	dbgb1	dbgb2	rss	maxop	p50	p99	tag
3989	41810	18	0.2	214.7	28.1	0.000	0.004	0.054	7.203	157283	52.3	3.762	100	12.6	20.0	0.0	0.019	10516	8790	20m.pg1119_o3_native_lto.cx7
3989	44908	20	0.2	241.7	28.7	0.000	0.004	0.061	7.358	168784	52.4	3.758	93	12.6	19.8	0.0	0.023	11192	9829	20m.pg1214_o3_native_lto.cx7
3989	45990	26	0.2	243.2	28.6	0.001	0.005	0.061	7.341	173148	52.4	3.765	91	12.6	19.8	0.0	0.015	11619	10313	20m.pg1310_o3_native_lto.cx7
3989	45587	25	0.2	323.3	27.4	0.001	0.005	0.081	7.022	171507	52.4	3.762	92	12.6	21.7	0.0	0.020	11428	9813	20m.pg147_o3_native_lto.cx7
3989	45924	25	0.2	323.5	27.3	0.001	0.005	0.081	7.020	172762	52.4	3.762	91	12.6	21.8	0.0	0.016	11555	9805	20m.pg151_o3_native_lto.cx7
3989	45650	26	0.2	323.1	27.4	0.001	0.005	0.081	7.021	171630	52.4	3.760	92	12.6	21.8	0.0	0.023	11556	9877	20m.pg152_o3_native_lto.cx7
l.i0
- l.i0: load without secondary indexes
- Legend for results is here.
- Each entry lists the percentage of responses that fit in that bucket (slower than max time for previous bucket, faster than min time for next bucket).
Insert response time histogram
256us	1ms	4ms	16ms	64ms	256ms	1s	4s	16s	gt	max	tag
0.000	0.000	99.963	0.037	0.000	0.000	0.000	0.000	0.000	0.000	0.012	pg1119_o3_native_lto.cx7
0.000	0.000	99.965	0.035	0.000	0.000	0.000	0.000	0.000	0.000	0.011	pg1214_o3_native_lto.cx7
0.000	0.015	99.934	0.051	0.000	0.000	0.000	0.000	0.000	0.000	0.012	pg1310_o3_native_lto.cx7
0.000	0.000	99.966	0.034	0.000	0.000	0.000	0.000	0.000	0.000	0.011	pg147_o3_native_lto.cx7
0.000	0.004	99.959	0.037	0.000	0.000	0.000	0.000	0.000	0.000	0.010	pg151_o3_native_lto.cx7
0.000	0.011	99.941	0.049	0.000	0.000	0.000	0.000	0.000	0.000	0.010	pg152_o3_native_lto.cx7
l.x
- l.x: create secondary indexes
- Legend for results is here.
- Each entry lists the percentage of responses that fit in that bucket (slower than max time for previous bucket, faster than min time for next bucket).
TODO - determine whether there is data for create index response time
l.i1
- l.i1: continue load after secondary indexes created
- Legend for results is here.
- Each entry lists the percentage of responses that fit in that bucket (slower than max time for previous bucket, faster than min time for next bucket).
Insert response time histogram
256us	1ms	4ms	16ms	64ms	256ms	1s	4s	16s	gt	max	tag
0.000	0.000	99.831	0.063	0.105	0.000	0.000	0.000	0.000	0.000	0.052	pg1119_o3_native_lto.cx7
0.000	0.000	99.823	0.071	0.107	0.000	0.000	0.000	0.000	0.000	0.048	pg1214_o3_native_lto.cx7
0.000	0.000	99.836	0.060	0.103	0.001	0.000	0.000	0.000	0.000	0.121	pg1310_o3_native_lto.cx7
0.000	0.000	99.840	0.057	0.102	0.000	0.000	0.000	0.000	0.000	0.057	pg147_o3_native_lto.cx7
0.000	0.000	99.790	0.078	0.132	0.000	0.000	0.000	0.000	0.000	0.055	pg151_o3_native_lto.cx7
0.000	0.000	99.797	0.069	0.134	0.000	0.000	0.000	0.000	0.000	0.055	pg152_o3_native_lto.cx7
q100.1
- q100.1: range queries with 100 insert/s per client
- Legend for results is here.
- Each entry lists the percentage of responses that fit in that bucket (slower than max time for previous bucket, faster than min time for next bucket).
Query response time histogram
256us	1ms	4ms	16ms	64ms	256ms	1s	4s	16s	gt	max	tag
99.984	0.010	0.006	nonzero	0.000	0.000	0.000	0.000	0.000	0.000	0.008	pg1119_o3_native_lto.cx7
99.986	0.008	0.005	nonzero	0.000	0.000	0.000	0.000	0.000	0.000	0.011	pg1214_o3_native_lto.cx7
99.987	0.007	0.005	nonzero	0.000	0.000	0.000	0.000	0.000	0.000	0.008	pg1310_o3_native_lto.cx7
99.985	0.010	0.005	nonzero	0.000	0.000	0.000	0.000	0.000	0.000	0.006	pg147_o3_native_lto.cx7
99.986	0.009	0.005	nonzero	0.000	0.000	0.000	0.000	0.000	0.000	0.007	pg151_o3_native_lto.cx7
99.986	0.009	0.005	nonzero	0.000	0.000	0.000	0.000	0.000	0.000	0.008	pg152_o3_native_lto.cx7
Insert response time histogram
256us	1ms	4ms	16ms	64ms	256ms	1s	4s	16s	gt	max	tag
0.000	0.000	99.528	0.472	0.000	0.000	0.000	0.000	0.000	0.000	0.007	pg1119_o3_native_lto.cx7
0.000	0.000	99.785	0.215	0.000	0.000	0.000	0.000	0.000	0.000	0.009	pg1214_o3_native_lto.cx7
0.000	0.000	99.750	0.250	0.000	0.000	0.000	0.000	0.000	0.000	0.007	pg1310_o3_native_lto.cx7
0.000	0.000	99.403	0.597	0.000	0.000	0.000	0.000	0.000	0.000	0.012	pg147_o3_native_lto.cx7
0.000	0.000	99.736	0.264	0.000	0.000	0.000	0.000	0.000	0.000	0.008	pg151_o3_native_lto.cx7
0.000	0.000	99.569	0.431	0.000	0.000	0.000	0.000	0.000	0.000	0.008	pg152_o3_native_lto.cx7
q500.1
- q500.1: range queries with 500 insert/s per client
- Legend for results is here.
- Each entry lists the percentage of responses that fit in that bucket (slower than max time for previous bucket, faster than min time for next bucket).
Query response time histogram
256us	1ms	4ms	16ms	64ms	256ms	1s	4s	16s	gt	max	tag
99.950	0.032	0.017	0.001	nonzero	0.000	0.000	0.000	0.000	0.000	0.018	pg1119_o3_native_lto.cx7
99.958	0.026	0.016	0.001	0.000	0.000	0.000	0.000	0.000	0.000	0.016	pg1214_o3_native_lto.cx7
99.962	0.023	0.015	0.001	nonzero	0.000	0.000	0.000	0.000	0.000	0.019	pg1310_o3_native_lto.cx7
99.958	0.025	0.016	0.001	nonzero	0.000	0.000	0.000	0.000	0.000	0.019	pg147_o3_native_lto.cx7
99.961	0.022	0.016	0.001	nonzero	0.000	0.000	0.000	0.000	0.000	0.028	pg151_o3_native_lto.cx7
99.960	0.023	0.016	0.001	nonzero	0.000	0.000	0.000	0.000	0.000	0.019	pg152_o3_native_lto.cx7
Insert response time histogram
256us	1ms	4ms	16ms	64ms	256ms	1s	4s	16s	gt	max	tag
0.000	0.000	96.485	3.444	0.067	0.004	0.000	0.000	0.000	0.000	0.098	pg1119_o3_native_lto.cx7
0.000	0.000	97.539	2.425	0.036	0.000	0.000	0.000	0.000	0.000	0.030	pg1214_o3_native_lto.cx7
0.000	0.000	96.792	3.132	0.074	0.003	0.000	0.000	0.000	0.000	0.107	pg1310_o3_native_lto.cx7
0.000	0.000	97.233	2.744	0.022	0.000	0.000	0.000	0.000	0.000	0.030	pg147_o3_native_lto.cx7
0.000	0.000	96.807	3.143	0.050	0.000	0.000	0.000	0.000	0.000	0.033	pg151_o3_native_lto.cx7
0.000	0.000	97.618	2.329	0.053	0.000	0.000	0.000	0.000	0.000	0.044	pg152_o3_native_lto.cx7
q1000.1
- q1000.1: range queries with 1000 insert/s per client
- Legend for results is here.
- Each entry lists the percentage of responses that fit in that bucket (slower than max time for previous bucket, faster than min time for next bucket).
Query response time histogram
256us	1ms	4ms	16ms	64ms	256ms	1s	4s	16s	gt	max	tag
99.912	0.062	0.025	0.001	nonzero	0.000	0.000	0.000	0.000	0.000	0.019	pg1119_o3_native_lto.cx7
99.915	0.057	0.026	0.001	nonzero	0.000	0.000	0.000	0.000	0.000	0.023	pg1214_o3_native_lto.cx7
99.915	0.058	0.026	0.001	0.000	0.000	0.000	0.000	0.000	0.000	0.015	pg1310_o3_native_lto.cx7
99.913	0.059	0.027	0.001	nonzero	0.000	0.000	0.000	0.000	0.000	0.020	pg147_o3_native_lto.cx7
99.916	0.056	0.027	0.001	0.000	0.000	0.000	0.000	0.000	0.000	0.016	pg151_o3_native_lto.cx7
99.922	0.051	0.026	0.001	nonzero	0.000	0.000	0.000	0.000	0.000	0.023	pg152_o3_native_lto.cx7
Insert response time histogram
256us	1ms	4ms	16ms	64ms	256ms	1s	4s	16s	gt	max	tag
0.000	0.000	96.058	3.871	0.071	0.000	0.000	0.000	0.000	0.000	0.039	pg1119_o3_native_lto.cx7
0.000	0.000	94.101	5.812	0.087	0.000	0.000	0.000	0.000	0.000	0.040	pg1214_o3_native_lto.cx7
0.000	0.000	94.533	5.386	0.081	0.000	0.000	0.000	0.000	0.000	0.029	pg1310_o3_native_lto.cx7
0.000	0.000	94.870	5.053	0.076	0.000	0.000	0.000	0.000	0.000	0.025	pg147_o3_native_lto.cx7
0.000	0.000	95.317	4.617	0.067	0.000	0.000	0.000	0.000	0.000	0.030	pg151_o3_native_lto.cx7
0.000	0.000	96.085	3.869	0.045	0.000	0.000	0.000	0.000	0.000	0.028	pg152_o3_native_lto.cx7