Introduction
This is a report for the insert benchmark with 20M docs and 4 client(s). It is generated by scripts (bash, awk, sed) and Tufte might not be impressed. An overview of the insert benchmark is here and a short update is here. Below, by DBMS, I mean DBMS+version.config. An example is my8020.c10b40 where my means MySQL, 8020 is version 8.0.20 and c10b40 is the name for the configuration file.
The test server has 8 AMD cores, 16G RAM and an NVMe SSD. It is described here as the Beelink. The benchmark was run with 4 clients and there were 1 or 2 connections per client (1 for queries, 1 for inserts). It uses 1 table. It loads 20M rows without secondary indexes, creates secondary indexes, loads another 20M rows then does 3 read+write tests for one hour each that do queries as fast as possible with 100, 500 and then 1000 writes/second/client concurrent with the queries. The database is cached by the OS but not by the database. Clients and the DBMS share one server. The per-database configs are in the per-database subdirectories here.
The tested DBMS are:
- pg1119_o3_native_lto.cx7_1g - Postgres 11.19, the cx7_1g config and the build used: -O3 -march=native -mtune=native
- pg1214_o3_native_lto.cx7_1g - Postgres 12.14, the cx7_1g config and the build used: -O3 -march=native -mtune=native
- pg1310_o3_native_lto.cx7_1g - Postgres 13.10, the cx7_1g config and the build used: -O3 -march=native -mtune=native
- pg147_o3_native_lto.cx7_1g - Postgres 14.7, the cx7_1g config and the build used: -O3 -march=native -mtune=native
- pg151_o3_native_lto.cx7_1g - Postgres 15.1, the cx7_1g config and the build used: -O3 -march=native -mtune=native
- pg152_o3_native_lto.cx7_1g - Postgres 15.2, the cx7_1g config and the build used: -O3 -march=native -mtune=native
Contents
- Summary
- l.i0: load without secondary indexes
- l.x: create secondary indexes
- l.i1: continue load after secondary indexes created
- q100.1: range queries with 100 insert/s per client
- q500.1: range queries with 500 insert/s per client
- q1000.1: range queries with 1000 insert/s per client
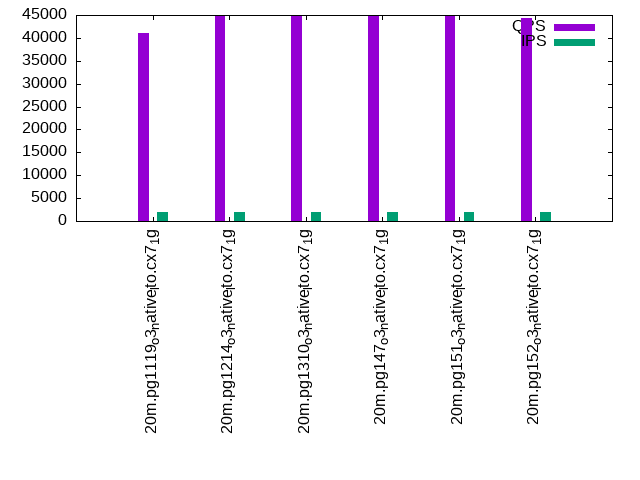
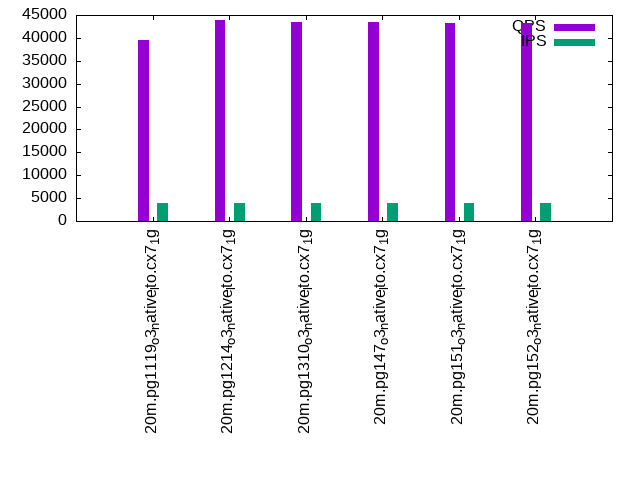
Summary
The numbers are inserts/s for l.i0 and l.i1, indexed docs (or rows) /s for l.x and queries/s for q*.2. The values are the average rate over the entire test for inserts (IPS) and queries (QPS). The range of values for IPS and QPS is split into 3 parts: bottom 25%, middle 50%, top 25%. Values in the bottom 25% have a red background, values in the top 25% have a green background and values in the middle have no color. A gray background is used for values that can be ignored because the DBMS did not sustain the target insert rate. Red backgrounds are not used when the minimum value is within 80% of the max value.
| dbms | l.i0 | l.x | l.i1 | q100.1 | q500.1 | q1000.1 |
|---|---|---|---|---|---|---|
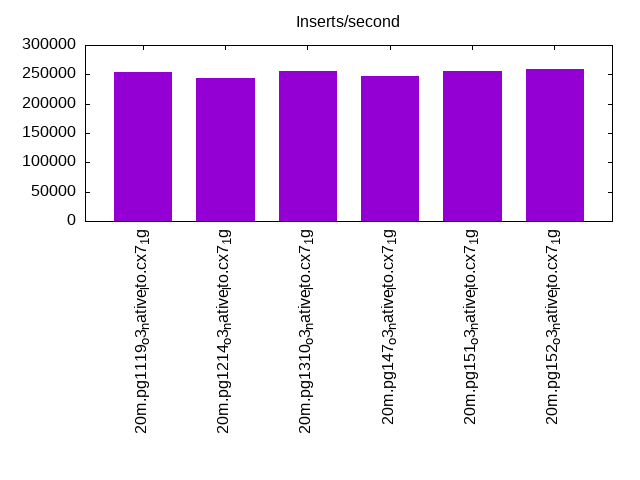
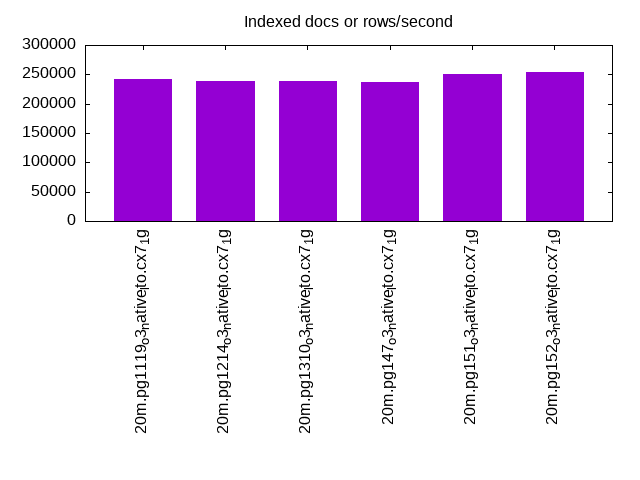
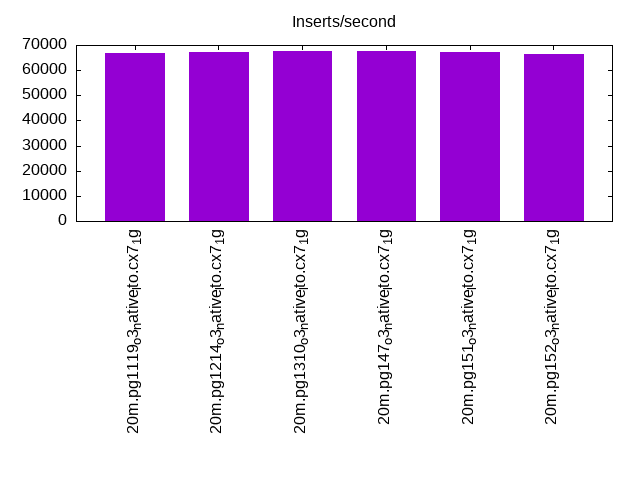
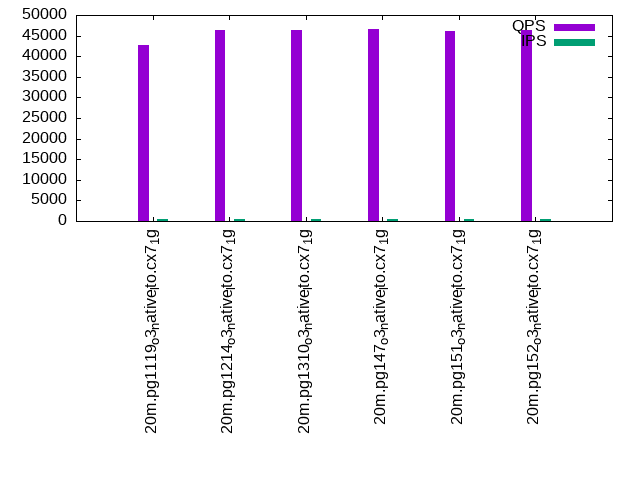
| 20m.pg1119_o3_native_lto.cx7_1g | 253164 | 242169 | 66890 | 42690 | 41062 | 39558 |
| 20m.pg1214_o3_native_lto.cx7_1g | 243902 | 239286 | 67114 | 46436 | 44936 | 43859 |
| 20m.pg1310_o3_native_lto.cx7_1g | 256410 | 239286 | 67568 | 46440 | 44882 | 43474 |
| 20m.pg147_o3_native_lto.cx7_1g | 246914 | 236470 | 67568 | 46516 | 44990 | 43474 |
| 20m.pg151_o3_native_lto.cx7_1g | 256410 | 251250 | 67340 | 46148 | 44768 | 43267 |
| 20m.pg152_o3_native_lto.cx7_1g | 259740 | 254430 | 66225 | 46240 | 44391 | 43172 |
This table has relative throughput, throughput for the DBMS relative to the DBMS in the first line, using the absolute throughput from the previous table.
| dbms | l.i0 | l.x | l.i1 | q100.1 | q500.1 | q1000.1 |
|---|---|---|---|---|---|---|
| 20m.pg1119_o3_native_lto.cx7_1g | 1.00 | 1.00 | 1.00 | 1.00 | 1.00 | 1.00 |
| 20m.pg1214_o3_native_lto.cx7_1g | 0.96 | 0.99 | 1.00 | 1.09 | 1.09 | 1.11 |
| 20m.pg1310_o3_native_lto.cx7_1g | 1.01 | 0.99 | 1.01 | 1.09 | 1.09 | 1.10 |
| 20m.pg147_o3_native_lto.cx7_1g | 0.98 | 0.98 | 1.01 | 1.09 | 1.10 | 1.10 |
| 20m.pg151_o3_native_lto.cx7_1g | 1.01 | 1.04 | 1.01 | 1.08 | 1.09 | 1.09 |
| 20m.pg152_o3_native_lto.cx7_1g | 1.03 | 1.05 | 0.99 | 1.08 | 1.08 | 1.09 |
This lists the average rate of inserts/s for the tests that do inserts concurrent with queries. For such tests the query rate is listed in the table above. The read+write tests are setup so that the insert rate should match the target rate every second. Cells that are not at least 95% of the target have a red background to indicate a failure to satisfy the target.
| dbms | q100.1 | q500.1 | q1000.1 |
|---|---|---|---|
| pg1119_o3_native_lto.cx7_1g | 399 | 1994 | 3989 |
| pg1214_o3_native_lto.cx7_1g | 399 | 1994 | 3989 |
| pg1310_o3_native_lto.cx7_1g | 399 | 1993 | 3989 |
| pg147_o3_native_lto.cx7_1g | 399 | 1994 | 3989 |
| pg151_o3_native_lto.cx7_1g | 399 | 1994 | 3989 |
| pg152_o3_native_lto.cx7_1g | 399 | 1994 | 3989 |
| target | 400 | 2000 | 4000 |
l.i0
l.i0: load without secondary indexes. Graphs for performance per 1-second interval are here.
Average throughput:
Insert response time histogram: each cell has the percentage of responses that take <= the time in the header and max is the max response time in seconds. For the max column values in the top 25% of the range have a red background and in the bottom 25% of the range have a green background. The red background is not used when the min value is within 80% of the max value.
| dbms | 256us | 1ms | 4ms | 16ms | 64ms | 256ms | 1s | 4s | 16s | gt | max |
|---|---|---|---|---|---|---|---|---|---|---|---|
| pg1119_o3_native_lto.cx7_1g | 99.947 | 0.053 | 0.016 | ||||||||
| pg1214_o3_native_lto.cx7_1g | 99.944 | 0.056 | 0.013 | ||||||||
| pg1310_o3_native_lto.cx7_1g | 0.004 | 99.948 | 0.049 | 0.013 | |||||||
| pg147_o3_native_lto.cx7_1g | 99.941 | 0.059 | 0.010 | ||||||||
| pg151_o3_native_lto.cx7_1g | 0.006 | 99.924 | 0.070 | 0.010 | |||||||
| pg152_o3_native_lto.cx7_1g | 0.060 | 99.874 | 0.066 | 0.011 |
Performance metrics for the DBMS listed above. Some are normalized by throughput, others are not. Legend for results is here.
ips	qps	rps	rmbps	wps	wmbps	rpq	rkbpq	wpi	wkbpi	csps	cpups	cspq	cpupq	dbgb1	dbgb2	rss	maxop	p50	p99	tag
253164	0	0	0.0	410.6	126.6	0.000	0.000	0.002	0.512	27002	69.4	0.107	22	2.2	5.6	0.0	0.016	74319	48148	20m.pg1119_o3_native_lto.cx7_1g
243902	0	0	0.0	657.8	121.2	0.000	0.000	0.003	0.509	26132	69.2	0.107	23	2.1	5.6	0.0	0.013	71822	52242	20m.pg1214_o3_native_lto.cx7_1g
256410	0	0	0.0	391.9	129.3	0.000	0.000	0.002	0.517	27563	69.1	0.107	22	2.1	5.6	0.0	0.013	75218	39756	20m.pg1310_o3_native_lto.cx7_1g
246914	0	0	0.0	385.4	124.4	0.000	0.000	0.002	0.516	26612	69.0	0.108	22	2.1	5.6	0.0	0.010	73121	39457	20m.pg147_o3_native_lto.cx7_1g
256410	0	0	0.0	400.6	130.0	0.000	0.000	0.002	0.519	27580	69.7	0.108	22	2.1	5.6	0.0	0.010	75318	66728	20m.pg151_o3_native_lto.cx7_1g
259740	0	0	0.0	405.5	131.4	0.000	0.000	0.002	0.518	28203	69.8	0.109	22	2.1	5.6	0.0	0.011	75746	1898	20m.pg152_o3_native_lto.cx7_1g
l.x
l.x: create secondary indexes.
Average throughput:
Performance metrics for the DBMS listed above. Some are normalized by throughput, others are not. Legend for results is here.
ips	qps	rps	rmbps	wps	wmbps	rpq	rkbpq	wpi	wkbpi	csps	cpups	cspq	cpupq	dbgb1	dbgb2	rss	maxop	p50	p99	tag
242169	0	0	0.0	182.2	68.4	0.000	0.000	0.001	0.289	780	12.7	0.003	4	3.9	9.0	0.0	0.003	NA	NA	20m.pg1119_o3_native_lto.cx7_1g
239286	0	0	0.0	356.5	62.6	0.000	0.000	0.001	0.268	752	12.6	0.003	4	3.9	9.0	0.0	0.003	NA	NA	20m.pg1214_o3_native_lto.cx7_1g
239286	0	0	0.0	144.7	63.3	0.000	0.000	0.001	0.271	865	12.6	0.004	4	3.9	9.0	0.0	0.003	NA	NA	20m.pg1310_o3_native_lto.cx7_1g
236470	0	0	0.0	176.5	78.1	0.000	0.000	0.001	0.338	788	12.2	0.003	4	3.9	9.0	0.0	0.003	NA	NA	20m.pg147_o3_native_lto.cx7_1g
251250	0	0	0.0	148.0	63.6	0.000	0.000	0.001	0.259	785	12.7	0.003	4	3.9	9.0	0.0	0.003	NA	NA	20m.pg151_o3_native_lto.cx7_1g
254430	0	0	0.0	153.3	66.2	0.000	0.000	0.001	0.266	834	12.6	0.003	4	3.9	9.0	0.0	0.003	NA	NA	20m.pg152_o3_native_lto.cx7_1g
l.i1
l.i1: continue load after secondary indexes created. Graphs for performance per 1-second interval are here.
Average throughput:
Insert response time histogram: each cell has the percentage of responses that take <= the time in the header and max is the max response time in seconds. For the max column values in the top 25% of the range have a red background and in the bottom 25% of the range have a green background. The red background is not used when the min value is within 80% of the max value.
| dbms | 256us | 1ms | 4ms | 16ms | 64ms | 256ms | 1s | 4s | 16s | gt | max |
|---|---|---|---|---|---|---|---|---|---|---|---|
| pg1119_o3_native_lto.cx7_1g | 98.177 | 1.748 | 0.075 | 0.058 | |||||||
| pg1214_o3_native_lto.cx7_1g | 98.094 | 1.833 | 0.072 | 0.001 | 0.081 | ||||||
| pg1310_o3_native_lto.cx7_1g | 98.105 | 1.816 | 0.080 | 0.052 | |||||||
| pg147_o3_native_lto.cx7_1g | 98.052 | 1.871 | 0.076 | nonzero | 0.073 | ||||||
| pg151_o3_native_lto.cx7_1g | 98.053 | 1.865 | 0.081 | 0.001 | 0.072 | ||||||
| pg152_o3_native_lto.cx7_1g | 97.579 | 2.345 | 0.074 | 0.001 | 0.077 |
Performance metrics for the DBMS listed above. Some are normalized by throughput, others are not. Legend for results is here.
ips	qps	rps	rmbps	wps	wmbps	rpq	rkbpq	wpi	wkbpi	csps	cpups	cspq	cpupq	dbgb1	dbgb2	rss	maxop	p50	p99	tag
66890	0	182	1.7	44065.6	841.2	0.003	0.026	0.659	12.878	40491	62.5	0.605	75	8.8	24.4	0.0	0.058	17031	6493	20m.pg1119_o3_native_lto.cx7_1g
67114	0	162	1.6	43966.6	835.0	0.002	0.024	0.655	12.740	40316	62.2	0.601	74	8.6	23.8	0.0	0.081	17230	6597	20m.pg1214_o3_native_lto.cx7_1g
67568	0	155	1.7	44679.7	855.2	0.002	0.025	0.661	12.961	40782	62.3	0.604	74	8.6	24.1	0.0	0.052	17431	7149	20m.pg1310_o3_native_lto.cx7_1g
67568	0	177	1.2	43557.8	844.7	0.003	0.019	0.645	12.802	41133	62.8	0.609	74	8.6	25.2	0.0	0.073	17281	6715	20m.pg147_o3_native_lto.cx7_1g
67340	0	183	1.3	43608.3	846.1	0.003	0.019	0.648	12.866	41067	62.8	0.610	75	8.6	25.3	0.0	0.072	17281	8145	20m.pg151_o3_native_lto.cx7_1g
66225	0	179	1.3	43675.5	835.9	0.003	0.019	0.660	12.925	42728	62.3	0.645	75	8.6	25.3	0.0	0.077	16989	6043	20m.pg152_o3_native_lto.cx7_1g
q100.1
q100.1: range queries with 100 insert/s per client. Graphs for performance per 1-second interval are here.
Average throughput:
Query response time histogram: each cell has the percentage of responses that take <= the time in the header and max is the max response time in seconds. For max values in the top 25% of the range have a red background and in the bottom 25% of the range have a green background. The red background is not used when the min value is within 80% of the max value.
| dbms | 256us | 1ms | 4ms | 16ms | 64ms | 256ms | 1s | 4s | 16s | gt | max |
|---|---|---|---|---|---|---|---|---|---|---|---|
| pg1119_o3_native_lto.cx7_1g | 99.980 | 0.014 | 0.006 | nonzero | 0.009 | ||||||
| pg1214_o3_native_lto.cx7_1g | 99.983 | 0.011 | 0.006 | nonzero | 0.008 | ||||||
| pg1310_o3_native_lto.cx7_1g | 99.983 | 0.011 | 0.005 | nonzero | 0.009 | ||||||
| pg147_o3_native_lto.cx7_1g | 99.982 | 0.012 | 0.006 | nonzero | 0.010 | ||||||
| pg151_o3_native_lto.cx7_1g | 99.984 | 0.010 | 0.006 | nonzero | 0.014 | ||||||
| pg152_o3_native_lto.cx7_1g | 99.983 | 0.011 | 0.005 | nonzero | 0.009 |
Insert response time histogram: each cell has the percentage of responses that take <= the time in the header and max is the max response time in seconds. For max values in the top 25% of the range have a red background and in the bottom 25% of the range have a green background. The red background is not used when the min value is within 80% of the max value.
| dbms | 256us | 1ms | 4ms | 16ms | 64ms | 256ms | 1s | 4s | 16s | gt | max |
|---|---|---|---|---|---|---|---|---|---|---|---|
| pg1119_o3_native_lto.cx7_1g | 99.243 | 0.757 | 0.012 | ||||||||
| pg1214_o3_native_lto.cx7_1g | 99.146 | 0.854 | 0.011 | ||||||||
| pg1310_o3_native_lto.cx7_1g | 99.840 | 0.160 | 0.012 | ||||||||
| pg147_o3_native_lto.cx7_1g | 99.229 | 0.771 | 0.009 | ||||||||
| pg151_o3_native_lto.cx7_1g | 99.396 | 0.604 | 0.010 | ||||||||
| pg152_o3_native_lto.cx7_1g | 99.528 | 0.472 | 0.012 |
Performance metrics for the DBMS listed above. Some are normalized by throughput, others are not. Legend for results is here.
ips	qps	rps	rmbps	wps	wmbps	rpq	rkbpq	wpi	wkbpi	csps	cpups	cspq	cpupq	dbgb1	dbgb2	rss	maxop	p50	p99	tag
399	42690	1	0.0	1242.8	14.7	0.000	0.000	3.116	37.767	162933	50.4	3.817	94	9.0	19.2	0.0	0.009	10804	8790	20m.pg1119_o3_native_lto.cx7_1g
399	46436	0	0.0	1237.2	14.9	0.000	0.000	3.102	38.311	177175	50.6	3.815	87	8.7	18.8	0.0	0.008	11619	10644	20m.pg1214_o3_native_lto.cx7_1g
399	46440	3	0.0	1258.6	14.8	0.000	0.000	3.156	38.003	177199	50.6	3.816	87	8.8	18.8	0.0	0.009	11731	10453	20m.pg1310_o3_native_lto.cx7_1g
399	46516	2	0.0	1277.6	15.5	0.000	0.000	3.204	39.738	177417	50.6	3.814	87	8.7	22.3	0.0	0.010	11715	10389	20m.pg147_o3_native_lto.cx7_1g
399	46148	2	0.0	1259.9	15.1	0.000	0.000	3.159	38.887	175956	50.6	3.813	88	8.7	22.5	0.0	0.014	11507	10041	20m.pg151_o3_native_lto.cx7_1g
399	46240	2	0.0	1278.7	15.4	0.000	0.000	3.206	39.576	176341	50.6	3.814	88	8.8	22.4	0.0	0.009	11715	10580	20m.pg152_o3_native_lto.cx7_1g
q500.1
q500.1: range queries with 500 insert/s per client. Graphs for performance per 1-second interval are here.
Average throughput:
Query response time histogram: each cell has the percentage of responses that take <= the time in the header and max is the max response time in seconds. For max values in the top 25% of the range have a red background and in the bottom 25% of the range have a green background. The red background is not used when the min value is within 80% of the max value.
| dbms | 256us | 1ms | 4ms | 16ms | 64ms | 256ms | 1s | 4s | 16s | gt | max |
|---|---|---|---|---|---|---|---|---|---|---|---|
| pg1119_o3_native_lto.cx7_1g | 99.941 | 0.039 | 0.019 | 0.002 | nonzero | 0.032 | |||||
| pg1214_o3_native_lto.cx7_1g | 99.950 | 0.031 | 0.017 | 0.001 | nonzero | 0.016 | |||||
| pg1310_o3_native_lto.cx7_1g | 99.947 | 0.033 | 0.019 | 0.001 | 0.015 | ||||||
| pg147_o3_native_lto.cx7_1g | 99.944 | 0.035 | 0.019 | 0.002 | nonzero | 0.020 | |||||
| pg151_o3_native_lto.cx7_1g | 99.944 | 0.035 | 0.019 | 0.002 | 0.015 | ||||||
| pg152_o3_native_lto.cx7_1g | 99.942 | 0.038 | 0.019 | 0.001 | 0.016 |
Insert response time histogram: each cell has the percentage of responses that take <= the time in the header and max is the max response time in seconds. For max values in the top 25% of the range have a red background and in the bottom 25% of the range have a green background. The red background is not used when the min value is within 80% of the max value.
| dbms | 256us | 1ms | 4ms | 16ms | 64ms | 256ms | 1s | 4s | 16s | gt | max |
|---|---|---|---|---|---|---|---|---|---|---|---|
| pg1119_o3_native_lto.cx7_1g | 92.706 | 7.194 | 0.100 | 0.029 | |||||||
| pg1214_o3_native_lto.cx7_1g | 96.742 | 3.226 | 0.032 | 0.024 | |||||||
| pg1310_o3_native_lto.cx7_1g | 95.357 | 4.603 | 0.040 | 0.025 | |||||||
| pg147_o3_native_lto.cx7_1g | 93.297 | 6.644 | 0.058 | 0.023 | |||||||
| pg151_o3_native_lto.cx7_1g | 90.378 | 9.540 | 0.082 | 0.025 | |||||||
| pg152_o3_native_lto.cx7_1g | 96.400 | 3.539 | 0.061 | 0.053 |
Performance metrics for the DBMS listed above. Some are normalized by throughput, others are not. Legend for results is here.
ips	qps	rps	rmbps	wps	wmbps	rpq	rkbpq	wpi	wkbpi	csps	cpups	cspq	cpupq	dbgb1	dbgb2	rss	maxop	p50	p99	tag
1994	41062	24	0.2	5739.0	55.0	0.001	0.005	2.878	28.249	155441	52.0	3.785	101	10.5	18.1	0.0	0.032	10392	8950	20m.pg1119_o3_native_lto.cx7_1g
1994	44936	18	0.2	5735.4	55.0	0.000	0.004	2.876	28.227	170097	52.1	3.785	93	10.2	17.7	0.0	0.016	11256	10245	20m.pg1214_o3_native_lto.cx7_1g
1993	44882	34	0.3	5766.7	55.3	0.001	0.007	2.893	28.416	170048	52.0	3.789	93	10.2	17.8	0.0	0.015	11293	10120	20m.pg1310_o3_native_lto.cx7_1g
1994	44990	32	0.3	5767.3	55.3	0.001	0.006	2.892	28.393	170295	52.0	3.785	92	10.2	20.0	0.0	0.020	11256	9497	20m.pg147_o3_native_lto.cx7_1g
1994	44768	33	0.3	5763.8	55.3	0.001	0.006	2.890	28.389	169390	52.0	3.784	93	10.2	20.1	0.0	0.015	11268	9558	20m.pg151_o3_native_lto.cx7_1g
1994	44391	34	0.3	5763.2	55.3	0.001	0.006	2.890	28.376	167977	52.0	3.784	94	10.2	20.1	0.0	0.016	11172	9542	20m.pg152_o3_native_lto.cx7_1g
q1000.1
q1000.1: range queries with 1000 insert/s per client. Graphs for performance per 1-second interval are here.
Average throughput:
Query response time histogram: each cell has the percentage of responses that take <= the time in the header and max is the max response time in seconds. For max values in the top 25% of the range have a red background and in the bottom 25% of the range have a green background. The red background is not used when the min value is within 80% of the max value.
| dbms | 256us | 1ms | 4ms | 16ms | 64ms | 256ms | 1s | 4s | 16s | gt | max |
|---|---|---|---|---|---|---|---|---|---|---|---|
| pg1119_o3_native_lto.cx7_1g | 99.896 | 0.076 | 0.025 | 0.002 | nonzero | 0.032 | |||||
| pg1214_o3_native_lto.cx7_1g | 99.909 | 0.064 | 0.025 | 0.002 | nonzero | 0.024 | |||||
| pg1310_o3_native_lto.cx7_1g | 99.912 | 0.063 | 0.023 | 0.002 | nonzero | 0.018 | |||||
| pg147_o3_native_lto.cx7_1g | 99.895 | 0.076 | 0.028 | 0.002 | nonzero | 0.019 | |||||
| pg151_o3_native_lto.cx7_1g | 99.899 | 0.072 | 0.027 | 0.002 | nonzero | 0.022 | |||||
| pg152_o3_native_lto.cx7_1g | 99.903 | 0.069 | 0.026 | 0.002 | nonzero | 0.022 |
Insert response time histogram: each cell has the percentage of responses that take <= the time in the header and max is the max response time in seconds. For max values in the top 25% of the range have a red background and in the bottom 25% of the range have a green background. The red background is not used when the min value is within 80% of the max value.
| dbms | 256us | 1ms | 4ms | 16ms | 64ms | 256ms | 1s | 4s | 16s | gt | max |
|---|---|---|---|---|---|---|---|---|---|---|---|
| pg1119_o3_native_lto.cx7_1g | 93.094 | 6.797 | 0.109 | 0.033 | |||||||
| pg1214_o3_native_lto.cx7_1g | 93.261 | 6.657 | 0.082 | 0.028 | |||||||
| pg1310_o3_native_lto.cx7_1g | 95.871 | 4.097 | 0.033 | 0.024 | |||||||
| pg147_o3_native_lto.cx7_1g | 93.352 | 6.581 | 0.067 | 0.027 | |||||||
| pg151_o3_native_lto.cx7_1g | 93.674 | 6.260 | 0.067 | 0.025 | |||||||
| pg152_o3_native_lto.cx7_1g | 93.860 | 6.084 | 0.056 | 0.028 |
Performance metrics for the DBMS listed above. Some are normalized by throughput, others are not. Legend for results is here.
ips	qps	rps	rmbps	wps	wmbps	rpq	rkbpq	wpi	wkbpi	csps	cpups	cspq	cpupq	dbgb1	dbgb2	rss	maxop	p50	p99	tag
3989	39558	28	0.2	11224.9	99.1	0.001	0.006	2.814	25.440	147288	53.9	3.723	109	12.6	19.2	0.0	0.032	9817	8407	20m.pg1119_o3_native_lto.cx7_1g
3989	43859	48	0.5	11340.4	100.0	0.001	0.011	2.843	25.672	163550	54.0	3.729	98	12.6	19.1	0.0	0.024	10947	9833	20m.pg1214_o3_native_lto.cx7_1g
3989	43474	54	0.5	11389.9	100.4	0.001	0.012	2.855	25.777	162105	53.9	3.729	99	12.6	19.2	0.0	0.018	10856	9813	20m.pg1310_o3_native_lto.cx7_1g
3989	43474	62	0.5	11392.9	100.4	0.001	0.013	2.856	25.783	162057	53.9	3.728	99	12.6	21.0	0.0	0.019	10852	9625	20m.pg147_o3_native_lto.cx7_1g
3989	43267	62	0.5	11387.0	100.4	0.001	0.013	2.855	25.776	161362	53.9	3.729	100	12.6	21.0	0.0	0.022	10805	9494	20m.pg151_o3_native_lto.cx7_1g
3989	43172	62	0.5	11390.0	100.4	0.001	0.013	2.855	25.777	160829	53.9	3.725	100	12.6	21.0	0.0	0.022	10772	9557	20m.pg152_o3_native_lto.cx7_1g
l.i0
l.i0: load without secondary indexes
Performance metrics for all DBMS, not just the ones listed above. Some are normalized by throughput, others are not. Legend for results is here.
ips	qps	rps	rmbps	wps	wmbps	rpq	rkbpq	wpi	wkbpi	csps	cpups	cspq	cpupq	dbgb1	dbgb2	rss	maxop	p50	p99	tag
253164	0	0	0.0	410.6	126.6	0.000	0.000	0.002	0.512	27002	69.4	0.107	22	2.2	5.6	0.0	0.016	74319	48148	20m.pg1119_o3_native_lto.cx7_1g
243902	0	0	0.0	657.8	121.2	0.000	0.000	0.003	0.509	26132	69.2	0.107	23	2.1	5.6	0.0	0.013	71822	52242	20m.pg1214_o3_native_lto.cx7_1g
256410	0	0	0.0	391.9	129.3	0.000	0.000	0.002	0.517	27563	69.1	0.107	22	2.1	5.6	0.0	0.013	75218	39756	20m.pg1310_o3_native_lto.cx7_1g
246914	0	0	0.0	385.4	124.4	0.000	0.000	0.002	0.516	26612	69.0	0.108	22	2.1	5.6	0.0	0.010	73121	39457	20m.pg147_o3_native_lto.cx7_1g
256410	0	0	0.0	400.6	130.0	0.000	0.000	0.002	0.519	27580	69.7	0.108	22	2.1	5.6	0.0	0.010	75318	66728	20m.pg151_o3_native_lto.cx7_1g
259740	0	0	0.0	405.5	131.4	0.000	0.000	0.002	0.518	28203	69.8	0.109	22	2.1	5.6	0.0	0.011	75746	1898	20m.pg152_o3_native_lto.cx7_1g
l.x
l.x: create secondary indexes
Performance metrics for all DBMS, not just the ones listed above. Some are normalized by throughput, others are not. Legend for results is here.
ips	qps	rps	rmbps	wps	wmbps	rpq	rkbpq	wpi	wkbpi	csps	cpups	cspq	cpupq	dbgb1	dbgb2	rss	maxop	p50	p99	tag
242169	0	0	0.0	182.2	68.4	0.000	0.000	0.001	0.289	780	12.7	0.003	4	3.9	9.0	0.0	0.003	NA	NA	20m.pg1119_o3_native_lto.cx7_1g
239286	0	0	0.0	356.5	62.6	0.000	0.000	0.001	0.268	752	12.6	0.003	4	3.9	9.0	0.0	0.003	NA	NA	20m.pg1214_o3_native_lto.cx7_1g
239286	0	0	0.0	144.7	63.3	0.000	0.000	0.001	0.271	865	12.6	0.004	4	3.9	9.0	0.0	0.003	NA	NA	20m.pg1310_o3_native_lto.cx7_1g
236470	0	0	0.0	176.5	78.1	0.000	0.000	0.001	0.338	788	12.2	0.003	4	3.9	9.0	0.0	0.003	NA	NA	20m.pg147_o3_native_lto.cx7_1g
251250	0	0	0.0	148.0	63.6	0.000	0.000	0.001	0.259	785	12.7	0.003	4	3.9	9.0	0.0	0.003	NA	NA	20m.pg151_o3_native_lto.cx7_1g
254430	0	0	0.0	153.3	66.2	0.000	0.000	0.001	0.266	834	12.6	0.003	4	3.9	9.0	0.0	0.003	NA	NA	20m.pg152_o3_native_lto.cx7_1g
l.i1
l.i1: continue load after secondary indexes created
Performance metrics for all DBMS, not just the ones listed above. Some are normalized by throughput, others are not. Legend for results is here.
ips	qps	rps	rmbps	wps	wmbps	rpq	rkbpq	wpi	wkbpi	csps	cpups	cspq	cpupq	dbgb1	dbgb2	rss	maxop	p50	p99	tag
66890	0	182	1.7	44065.6	841.2	0.003	0.026	0.659	12.878	40491	62.5	0.605	75	8.8	24.4	0.0	0.058	17031	6493	20m.pg1119_o3_native_lto.cx7_1g
67114	0	162	1.6	43966.6	835.0	0.002	0.024	0.655	12.740	40316	62.2	0.601	74	8.6	23.8	0.0	0.081	17230	6597	20m.pg1214_o3_native_lto.cx7_1g
67568	0	155	1.7	44679.7	855.2	0.002	0.025	0.661	12.961	40782	62.3	0.604	74	8.6	24.1	0.0	0.052	17431	7149	20m.pg1310_o3_native_lto.cx7_1g
67568	0	177	1.2	43557.8	844.7	0.003	0.019	0.645	12.802	41133	62.8	0.609	74	8.6	25.2	0.0	0.073	17281	6715	20m.pg147_o3_native_lto.cx7_1g
67340	0	183	1.3	43608.3	846.1	0.003	0.019	0.648	12.866	41067	62.8	0.610	75	8.6	25.3	0.0	0.072	17281	8145	20m.pg151_o3_native_lto.cx7_1g
66225	0	179	1.3	43675.5	835.9	0.003	0.019	0.660	12.925	42728	62.3	0.645	75	8.6	25.3	0.0	0.077	16989	6043	20m.pg152_o3_native_lto.cx7_1g
q100.1
q100.1: range queries with 100 insert/s per client
Performance metrics for all DBMS, not just the ones listed above. Some are normalized by throughput, others are not. Legend for results is here.
ips	qps	rps	rmbps	wps	wmbps	rpq	rkbpq	wpi	wkbpi	csps	cpups	cspq	cpupq	dbgb1	dbgb2	rss	maxop	p50	p99	tag
399	42690	1	0.0	1242.8	14.7	0.000	0.000	3.116	37.767	162933	50.4	3.817	94	9.0	19.2	0.0	0.009	10804	8790	20m.pg1119_o3_native_lto.cx7_1g
399	46436	0	0.0	1237.2	14.9	0.000	0.000	3.102	38.311	177175	50.6	3.815	87	8.7	18.8	0.0	0.008	11619	10644	20m.pg1214_o3_native_lto.cx7_1g
399	46440	3	0.0	1258.6	14.8	0.000	0.000	3.156	38.003	177199	50.6	3.816	87	8.8	18.8	0.0	0.009	11731	10453	20m.pg1310_o3_native_lto.cx7_1g
399	46516	2	0.0	1277.6	15.5	0.000	0.000	3.204	39.738	177417	50.6	3.814	87	8.7	22.3	0.0	0.010	11715	10389	20m.pg147_o3_native_lto.cx7_1g
399	46148	2	0.0	1259.9	15.1	0.000	0.000	3.159	38.887	175956	50.6	3.813	88	8.7	22.5	0.0	0.014	11507	10041	20m.pg151_o3_native_lto.cx7_1g
399	46240	2	0.0	1278.7	15.4	0.000	0.000	3.206	39.576	176341	50.6	3.814	88	8.8	22.4	0.0	0.009	11715	10580	20m.pg152_o3_native_lto.cx7_1g
q500.1
q500.1: range queries with 500 insert/s per client
Performance metrics for all DBMS, not just the ones listed above. Some are normalized by throughput, others are not. Legend for results is here.
ips	qps	rps	rmbps	wps	wmbps	rpq	rkbpq	wpi	wkbpi	csps	cpups	cspq	cpupq	dbgb1	dbgb2	rss	maxop	p50	p99	tag
1994	41062	24	0.2	5739.0	55.0	0.001	0.005	2.878	28.249	155441	52.0	3.785	101	10.5	18.1	0.0	0.032	10392	8950	20m.pg1119_o3_native_lto.cx7_1g
1994	44936	18	0.2	5735.4	55.0	0.000	0.004	2.876	28.227	170097	52.1	3.785	93	10.2	17.7	0.0	0.016	11256	10245	20m.pg1214_o3_native_lto.cx7_1g
1993	44882	34	0.3	5766.7	55.3	0.001	0.007	2.893	28.416	170048	52.0	3.789	93	10.2	17.8	0.0	0.015	11293	10120	20m.pg1310_o3_native_lto.cx7_1g
1994	44990	32	0.3	5767.3	55.3	0.001	0.006	2.892	28.393	170295	52.0	3.785	92	10.2	20.0	0.0	0.020	11256	9497	20m.pg147_o3_native_lto.cx7_1g
1994	44768	33	0.3	5763.8	55.3	0.001	0.006	2.890	28.389	169390	52.0	3.784	93	10.2	20.1	0.0	0.015	11268	9558	20m.pg151_o3_native_lto.cx7_1g
1994	44391	34	0.3	5763.2	55.3	0.001	0.006	2.890	28.376	167977	52.0	3.784	94	10.2	20.1	0.0	0.016	11172	9542	20m.pg152_o3_native_lto.cx7_1g
q1000.1
q1000.1: range queries with 1000 insert/s per client
Performance metrics for all DBMS, not just the ones listed above. Some are normalized by throughput, others are not. Legend for results is here.
ips	qps	rps	rmbps	wps	wmbps	rpq	rkbpq	wpi	wkbpi	csps	cpups	cspq	cpupq	dbgb1	dbgb2	rss	maxop	p50	p99	tag
3989	39558	28	0.2	11224.9	99.1	0.001	0.006	2.814	25.440	147288	53.9	3.723	109	12.6	19.2	0.0	0.032	9817	8407	20m.pg1119_o3_native_lto.cx7_1g
3989	43859	48	0.5	11340.4	100.0	0.001	0.011	2.843	25.672	163550	54.0	3.729	98	12.6	19.1	0.0	0.024	10947	9833	20m.pg1214_o3_native_lto.cx7_1g
3989	43474	54	0.5	11389.9	100.4	0.001	0.012	2.855	25.777	162105	53.9	3.729	99	12.6	19.2	0.0	0.018	10856	9813	20m.pg1310_o3_native_lto.cx7_1g
3989	43474	62	0.5	11392.9	100.4	0.001	0.013	2.856	25.783	162057	53.9	3.728	99	12.6	21.0	0.0	0.019	10852	9625	20m.pg147_o3_native_lto.cx7_1g
3989	43267	62	0.5	11387.0	100.4	0.001	0.013	2.855	25.776	161362	53.9	3.729	100	12.6	21.0	0.0	0.022	10805	9494	20m.pg151_o3_native_lto.cx7_1g
3989	43172	62	0.5	11390.0	100.4	0.001	0.013	2.855	25.777	160829	53.9	3.725	100	12.6	21.0	0.0	0.022	10772	9557	20m.pg152_o3_native_lto.cx7_1g
l.i0
- l.i0: load without secondary indexes
- Legend for results is here.
- Each entry lists the percentage of responses that fit in that bucket (slower than max time for previous bucket, faster than min time for next bucket).
Insert response time histogram
256us	1ms	4ms	16ms	64ms	256ms	1s	4s	16s	gt	max	tag
0.000	0.000	99.947	0.053	0.000	0.000	0.000	0.000	0.000	0.000	0.016	pg1119_o3_native_lto.cx7_1g
0.000	0.000	99.944	0.056	0.000	0.000	0.000	0.000	0.000	0.000	0.013	pg1214_o3_native_lto.cx7_1g
0.000	0.004	99.948	0.049	0.000	0.000	0.000	0.000	0.000	0.000	0.013	pg1310_o3_native_lto.cx7_1g
0.000	0.000	99.941	0.059	0.000	0.000	0.000	0.000	0.000	0.000	0.010	pg147_o3_native_lto.cx7_1g
0.000	0.006	99.924	0.070	0.000	0.000	0.000	0.000	0.000	0.000	0.010	pg151_o3_native_lto.cx7_1g
0.000	0.060	99.874	0.066	0.000	0.000	0.000	0.000	0.000	0.000	0.011	pg152_o3_native_lto.cx7_1g
l.x
- l.x: create secondary indexes
- Legend for results is here.
- Each entry lists the percentage of responses that fit in that bucket (slower than max time for previous bucket, faster than min time for next bucket).
TODO - determine whether there is data for create index response time
l.i1
- l.i1: continue load after secondary indexes created
- Legend for results is here.
- Each entry lists the percentage of responses that fit in that bucket (slower than max time for previous bucket, faster than min time for next bucket).
Insert response time histogram
256us	1ms	4ms	16ms	64ms	256ms	1s	4s	16s	gt	max	tag
0.000	0.000	98.177	1.748	0.075	0.000	0.000	0.000	0.000	0.000	0.058	pg1119_o3_native_lto.cx7_1g
0.000	0.000	98.094	1.833	0.072	0.001	0.000	0.000	0.000	0.000	0.081	pg1214_o3_native_lto.cx7_1g
0.000	0.000	98.105	1.816	0.080	0.000	0.000	0.000	0.000	0.000	0.052	pg1310_o3_native_lto.cx7_1g
0.000	0.000	98.052	1.871	0.076	nonzero	0.000	0.000	0.000	0.000	0.073	pg147_o3_native_lto.cx7_1g
0.000	0.000	98.053	1.865	0.081	0.001	0.000	0.000	0.000	0.000	0.072	pg151_o3_native_lto.cx7_1g
0.000	0.000	97.579	2.345	0.074	0.001	0.000	0.000	0.000	0.000	0.077	pg152_o3_native_lto.cx7_1g
q100.1
- q100.1: range queries with 100 insert/s per client
- Legend for results is here.
- Each entry lists the percentage of responses that fit in that bucket (slower than max time for previous bucket, faster than min time for next bucket).
Query response time histogram
256us	1ms	4ms	16ms	64ms	256ms	1s	4s	16s	gt	max	tag
99.980	0.014	0.006	nonzero	0.000	0.000	0.000	0.000	0.000	0.000	0.009	pg1119_o3_native_lto.cx7_1g
99.983	0.011	0.006	nonzero	0.000	0.000	0.000	0.000	0.000	0.000	0.008	pg1214_o3_native_lto.cx7_1g
99.983	0.011	0.005	nonzero	0.000	0.000	0.000	0.000	0.000	0.000	0.009	pg1310_o3_native_lto.cx7_1g
99.982	0.012	0.006	nonzero	0.000	0.000	0.000	0.000	0.000	0.000	0.010	pg147_o3_native_lto.cx7_1g
99.984	0.010	0.006	nonzero	0.000	0.000	0.000	0.000	0.000	0.000	0.014	pg151_o3_native_lto.cx7_1g
99.983	0.011	0.005	nonzero	0.000	0.000	0.000	0.000	0.000	0.000	0.009	pg152_o3_native_lto.cx7_1g
Insert response time histogram
256us	1ms	4ms	16ms	64ms	256ms	1s	4s	16s	gt	max	tag
0.000	0.000	99.243	0.757	0.000	0.000	0.000	0.000	0.000	0.000	0.012	pg1119_o3_native_lto.cx7_1g
0.000	0.000	99.146	0.854	0.000	0.000	0.000	0.000	0.000	0.000	0.011	pg1214_o3_native_lto.cx7_1g
0.000	0.000	99.840	0.160	0.000	0.000	0.000	0.000	0.000	0.000	0.012	pg1310_o3_native_lto.cx7_1g
0.000	0.000	99.229	0.771	0.000	0.000	0.000	0.000	0.000	0.000	0.009	pg147_o3_native_lto.cx7_1g
0.000	0.000	99.396	0.604	0.000	0.000	0.000	0.000	0.000	0.000	0.010	pg151_o3_native_lto.cx7_1g
0.000	0.000	99.528	0.472	0.000	0.000	0.000	0.000	0.000	0.000	0.012	pg152_o3_native_lto.cx7_1g
q500.1
- q500.1: range queries with 500 insert/s per client
- Legend for results is here.
- Each entry lists the percentage of responses that fit in that bucket (slower than max time for previous bucket, faster than min time for next bucket).
Query response time histogram
256us	1ms	4ms	16ms	64ms	256ms	1s	4s	16s	gt	max	tag
99.941	0.039	0.019	0.002	nonzero	0.000	0.000	0.000	0.000	0.000	0.032	pg1119_o3_native_lto.cx7_1g
99.950	0.031	0.017	0.001	nonzero	0.000	0.000	0.000	0.000	0.000	0.016	pg1214_o3_native_lto.cx7_1g
99.947	0.033	0.019	0.001	0.000	0.000	0.000	0.000	0.000	0.000	0.015	pg1310_o3_native_lto.cx7_1g
99.944	0.035	0.019	0.002	nonzero	0.000	0.000	0.000	0.000	0.000	0.020	pg147_o3_native_lto.cx7_1g
99.944	0.035	0.019	0.002	0.000	0.000	0.000	0.000	0.000	0.000	0.015	pg151_o3_native_lto.cx7_1g
99.942	0.038	0.019	0.001	0.000	0.000	0.000	0.000	0.000	0.000	0.016	pg152_o3_native_lto.cx7_1g
Insert response time histogram
256us	1ms	4ms	16ms	64ms	256ms	1s	4s	16s	gt	max	tag
0.000	0.000	92.706	7.194	0.100	0.000	0.000	0.000	0.000	0.000	0.029	pg1119_o3_native_lto.cx7_1g
0.000	0.000	96.742	3.226	0.032	0.000	0.000	0.000	0.000	0.000	0.024	pg1214_o3_native_lto.cx7_1g
0.000	0.000	95.357	4.603	0.040	0.000	0.000	0.000	0.000	0.000	0.025	pg1310_o3_native_lto.cx7_1g
0.000	0.000	93.297	6.644	0.058	0.000	0.000	0.000	0.000	0.000	0.023	pg147_o3_native_lto.cx7_1g
0.000	0.000	90.378	9.540	0.082	0.000	0.000	0.000	0.000	0.000	0.025	pg151_o3_native_lto.cx7_1g
0.000	0.000	96.400	3.539	0.061	0.000	0.000	0.000	0.000	0.000	0.053	pg152_o3_native_lto.cx7_1g
q1000.1
- q1000.1: range queries with 1000 insert/s per client
- Legend for results is here.
- Each entry lists the percentage of responses that fit in that bucket (slower than max time for previous bucket, faster than min time for next bucket).
Query response time histogram
256us	1ms	4ms	16ms	64ms	256ms	1s	4s	16s	gt	max	tag
99.896	0.076	0.025	0.002	nonzero	0.000	0.000	0.000	0.000	0.000	0.032	pg1119_o3_native_lto.cx7_1g
99.909	0.064	0.025	0.002	nonzero	0.000	0.000	0.000	0.000	0.000	0.024	pg1214_o3_native_lto.cx7_1g
99.912	0.063	0.023	0.002	nonzero	0.000	0.000	0.000	0.000	0.000	0.018	pg1310_o3_native_lto.cx7_1g
99.895	0.076	0.028	0.002	nonzero	0.000	0.000	0.000	0.000	0.000	0.019	pg147_o3_native_lto.cx7_1g
99.899	0.072	0.027	0.002	nonzero	0.000	0.000	0.000	0.000	0.000	0.022	pg151_o3_native_lto.cx7_1g
99.903	0.069	0.026	0.002	nonzero	0.000	0.000	0.000	0.000	0.000	0.022	pg152_o3_native_lto.cx7_1g
Insert response time histogram
256us	1ms	4ms	16ms	64ms	256ms	1s	4s	16s	gt	max	tag
0.000	0.000	93.094	6.797	0.109	0.000	0.000	0.000	0.000	0.000	0.033	pg1119_o3_native_lto.cx7_1g
0.000	0.000	93.261	6.657	0.082	0.000	0.000	0.000	0.000	0.000	0.028	pg1214_o3_native_lto.cx7_1g
0.000	0.000	95.871	4.097	0.033	0.000	0.000	0.000	0.000	0.000	0.024	pg1310_o3_native_lto.cx7_1g
0.000	0.000	93.352	6.581	0.067	0.000	0.000	0.000	0.000	0.000	0.027	pg147_o3_native_lto.cx7_1g
0.000	0.000	93.674	6.260	0.067	0.000	0.000	0.000	0.000	0.000	0.025	pg151_o3_native_lto.cx7_1g
0.000	0.000	93.860	6.084	0.056	0.000	0.000	0.000	0.000	0.000	0.028	pg152_o3_native_lto.cx7_1g