Introduction
This is a report for the insert benchmark with 20M docs and 4 client(s). It is generated by scripts (bash, awk, sed) and Tufte might not be impressed. An overview of the insert benchmark is here and a short update is here. Below, by DBMS, I mean DBMS+version.config. An example is my8020.c10b40 where my means MySQL, 8020 is version 8.0.20 and c10b40 is the name for the configuration file.
The test server has 8 AMD cores, 16G RAM and an NVMe SSD. It is described here as the Beelink. The benchmark was run with 4 clients and there were 1 or 2 connections per client (1 for queries, 1 for inserts). It uses 4 tables, 1 per client. It loads 20M rows without secondary indexes, creates secondary indexes, loads another 20M rows then does 3 read+write tests for one hour each that do queries as fast as possible with 100, 500 and then 1000 writes/second/client concurrent with the queries. The database is cached by the storage engine and the only IO is for writes. Clients and the DBMS share one server. The per-database configs are in the per-database subdirectories here.
The tested DBMS are:
- pg1119_o3_native_lto.cx7 - Postgres 11.19, the cx7 config and the build used: -O3 -march=native -mtune=native
- pg1214_o3_native_lto.cx7 - Postgres 12.14, the cx7 config and the build used: -O3 -march=native -mtune=native
- pg1310_o3_native_lto.cx7 - Postgres 13.10, the cx7 config and the build used: -O3 -march=native -mtune=native
- pg147_o3_native_lto.cx7 - Postgres 14.7, the cx7 config and the build used: -O3 -march=native -mtune=native
- pg151_o3_native_lto.cx7 - Postgres 15.1, the cx7 config and the build used: -O3 -march=native -mtune=native
- pg152_o3_native_lto.cx7 - Postgres 15.2, the cx7 config and the build used: -O3 -march=native -mtune=native
- pg16prebeta - Postgres 16 from the main branch at git sha 1ab763fc2, the cx7 config and the build used: -O3 -march=native -mtune=native
Contents
- Summary
- l.i0: load without secondary indexes
- l.x: create secondary indexes
- l.i1: continue load after secondary indexes created
- q100.1: range queries with 100 insert/s per client
- q500.1: range queries with 500 insert/s per client
- q1000.1: range queries with 1000 insert/s per client
Summary
The numbers are inserts/s for l.i0 and l.i1, indexed docs (or rows) /s for l.x and queries/s for q*.2. The values are the average rate over the entire test for inserts (IPS) and queries (QPS). The range of values for IPS and QPS is split into 3 parts: bottom 25%, middle 50%, top 25%. Values in the bottom 25% have a red background, values in the top 25% have a green background and values in the middle have no color. A gray background is used for values that can be ignored because the DBMS did not sustain the target insert rate. Red backgrounds are not used when the minimum value is within 80% of the max value.
| dbms | l.i0 | l.x | l.i1 | q100.1 | q500.1 | q1000.1 |
|---|---|---|---|---|---|---|
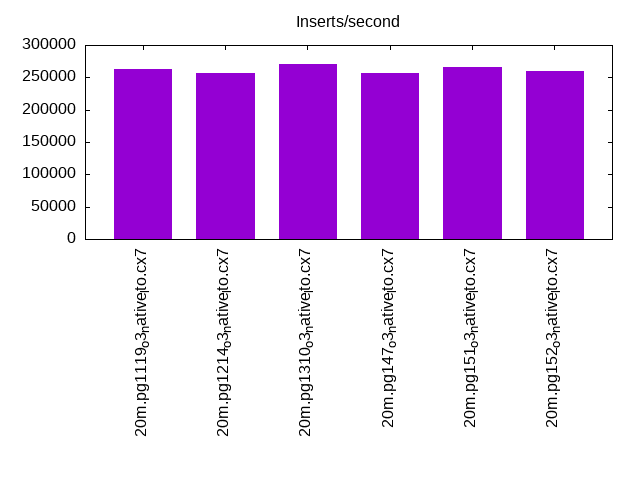
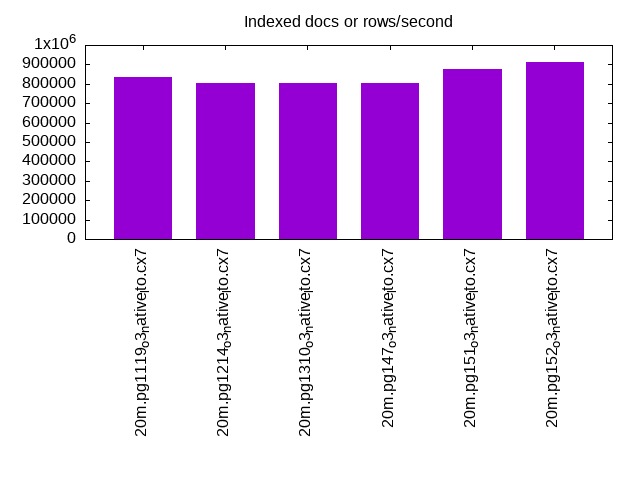
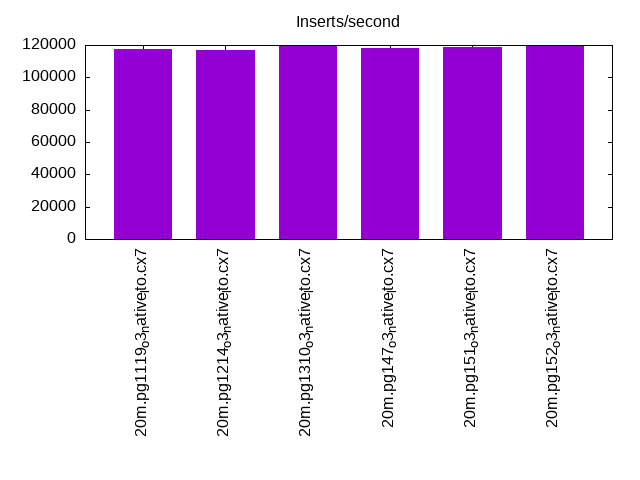
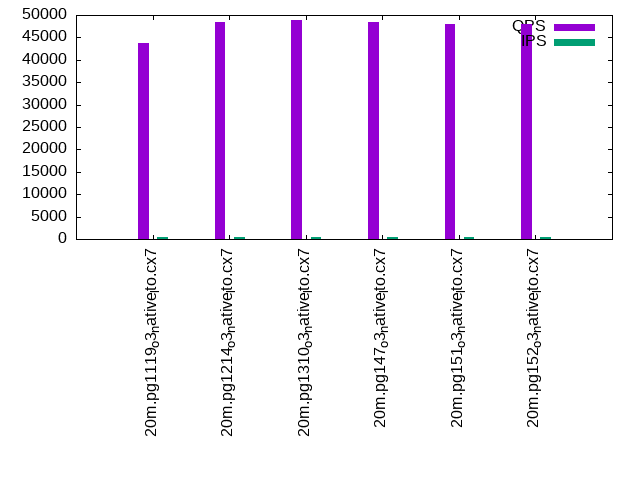
| 20m.pg1119_o3_native_lto.cx7 | 263158 | 837500 | 117647 | 43786 | 42860 | 42161 |
| 20m.pg1214_o3_native_lto.cx7 | 256410 | 804000 | 116959 | 48486 | 47656 | 46773 |
| 20m.pg1310_o3_native_lto.cx7 | 270270 | 804000 | 119760 | 48826 | 47845 | 47054 |
| 20m.pg147_o3_native_lto.cx7 | 256410 | 804000 | 118343 | 48511 | 47323 | 46619 |
| 20m.pg151_o3_native_lto.cx7 | 266667 | 873913 | 119048 | 48015 | 47362 | 46328 |
| 20m.pg152_o3_native_lto.cx7 | 259740 | 913636 | 119760 | 48005 | 46734 | 46187 |
This table has relative throughput, throughput for the DBMS relative to the DBMS in the first line, using the absolute throughput from the previous table.
| dbms | l.i0 | l.x | l.i1 | q100.1 | q500.1 | q1000.1 |
|---|---|---|---|---|---|---|
| 20m.pg1119_o3_native_lto.cx7 | 1.00 | 1.00 | 1.00 | 1.00 | 1.00 | 1.00 |
| 20m.pg1214_o3_native_lto.cx7 | 0.97 | 0.96 | 0.99 | 1.11 | 1.11 | 1.11 |
| 20m.pg1310_o3_native_lto.cx7 | 1.03 | 0.96 | 1.02 | 1.12 | 1.12 | 1.12 |
| 20m.pg147_o3_native_lto.cx7 | 0.97 | 0.96 | 1.01 | 1.11 | 1.10 | 1.11 |
| 20m.pg151_o3_native_lto.cx7 | 1.01 | 1.04 | 1.01 | 1.10 | 1.11 | 1.10 |
| 20m.pg152_o3_native_lto.cx7 | 0.99 | 1.09 | 1.02 | 1.10 | 1.09 | 1.10 |
This lists the average rate of inserts/s for the tests that do inserts concurrent with queries. For such tests the query rate is listed in the table above. The read+write tests are setup so that the insert rate should match the target rate every second. Cells that are not at least 95% of the target have a red background to indicate a failure to satisfy the target.
| dbms | q100.1 | q500.1 | q1000.1 |
|---|---|---|---|
| pg1119_o3_native_lto.cx7 | 399 | 1993 | 3989 |
| pg1214_o3_native_lto.cx7 | 399 | 1994 | 3989 |
| pg1310_o3_native_lto.cx7 | 399 | 1994 | 3989 |
| pg147_o3_native_lto.cx7 | 399 | 1994 | 3989 |
| pg151_o3_native_lto.cx7 | 399 | 1994 | 3989 |
| pg152_o3_native_lto.cx7 | 399 | 1993 | 3989 |
| target | 400 | 2000 | 4000 |
l.i0
l.i0: load without secondary indexes. Graphs for performance per 1-second interval are here.
Average throughput:
Insert response time histogram: each cell has the percentage of responses that take <= the time in the header and max is the max response time in seconds. For the max column values in the top 25% of the range have a red background and in the bottom 25% of the range have a green background. The red background is not used when the min value is within 80% of the max value.
| dbms | 256us | 1ms | 4ms | 16ms | 64ms | 256ms | 1s | 4s | 16s | gt | max |
|---|---|---|---|---|---|---|---|---|---|---|---|
| pg1119_o3_native_lto.cx7 | 99.975 | 0.026 | 0.012 | ||||||||
| pg1214_o3_native_lto.cx7 | 99.976 | 0.024 | 0.012 | ||||||||
| pg1310_o3_native_lto.cx7 | 0.003 | 99.972 | 0.026 | 0.013 | |||||||
| pg147_o3_native_lto.cx7 | 99.983 | 0.017 | 0.010 | ||||||||
| pg151_o3_native_lto.cx7 | 99.968 | 0.032 | 0.011 | ||||||||
| pg152_o3_native_lto.cx7 | 99.953 | 0.047 | 0.011 |
Performance metrics for the DBMS listed above. Some are normalized by throughput, others are not. Legend for results is here.
ips	qps	rps	rmbps	wps	wmbps	rpq	rkbpq	wpi	wkbpi	csps	cpups	cspq	cpupq	dbgb1	dbgb2	rss	maxop	p50	p99	tag
263158	0	0	0.0	309.2	113.7	0.000	0.000	0.001	0.443	25920	71.3	0.098	22	1.9	5.2	0.0	0.012	78615	36196	20m.pg1119_o3_native_lto.cx7
256410	0	0	0.0	285.3	102.8	0.000	0.000	0.001	0.411	25778	70.8	0.101	22	1.9	5.2	0.0	0.012	75418	28769	20m.pg1214_o3_native_lto.cx7
270270	0	0	0.0	304.4	109.6	0.000	0.000	0.001	0.415	26468	71.0	0.098	21	1.9	5.2	0.0	0.013	80912	8890	20m.pg1310_o3_native_lto.cx7
256410	0	0	0.0	303.9	112.3	0.000	0.000	0.001	0.448	25691	70.7	0.100	22	1.9	5.2	0.0	0.010	76915	17287	20m.pg147_o3_native_lto.cx7
266667	0	0	0.0	293.2	105.7	0.000	0.000	0.001	0.406	26154	68.8	0.098	21	1.9	5.2	0.0	0.011	79838	22176	20m.pg151_o3_native_lto.cx7
259740	0	0	0.0	293.3	105.6	0.000	0.000	0.001	0.416	25958	69.0	0.100	21	1.9	5.2	0.0	0.011	79343	300	20m.pg152_o3_native_lto.cx7
l.x
l.x: create secondary indexes.
Average throughput:
Performance metrics for the DBMS listed above. Some are normalized by throughput, others are not. Legend for results is here.
ips	qps	rps	rmbps	wps	wmbps	rpq	rkbpq	wpi	wkbpi	csps	cpups	cspq	cpupq	dbgb1	dbgb2	rss	maxop	p50	p99	tag
837500	0	0	0.0	353.8	161.7	0.000	0.000	0.000	0.198	1730	44.4	0.002	4	3.7	8.6	0.0	0.003	NA	NA	20m.pg1119_o3_native_lto.cx7
804000	0	0	0.0	349.1	159.7	0.000	0.000	0.000	0.203	1512	41.6	0.002	4	3.7	8.6	0.0	0.003	NA	NA	20m.pg1214_o3_native_lto.cx7
804000	0	0	0.0	376.3	171.4	0.000	0.000	0.000	0.218	1334	41.2	0.002	4	3.7	8.6	0.0	0.003	NA	NA	20m.pg1310_o3_native_lto.cx7
804000	0	0	0.0	448.3	206.3	0.000	0.000	0.001	0.263	1962	38.5	0.002	4	3.7	8.6	0.0	0.003	NA	NA	20m.pg147_o3_native_lto.cx7
873913	0	0	0.0	399.4	185.2	0.000	0.000	0.000	0.217	1265	39.4	0.001	4	3.7	8.6	0.0	0.004	NA	NA	20m.pg151_o3_native_lto.cx7
913636	0	0	0.0	402.2	186.0	0.000	0.000	0.000	0.208	1747	38.0	0.002	3	3.7	8.6	0.0	0.004	NA	NA	20m.pg152_o3_native_lto.cx7
l.i1
l.i1: continue load after secondary indexes created. Graphs for performance per 1-second interval are here.
Average throughput:
Insert response time histogram: each cell has the percentage of responses that take <= the time in the header and max is the max response time in seconds. For the max column values in the top 25% of the range have a red background and in the bottom 25% of the range have a green background. The red background is not used when the min value is within 80% of the max value.
| dbms | 256us | 1ms | 4ms | 16ms | 64ms | 256ms | 1s | 4s | 16s | gt | max |
|---|---|---|---|---|---|---|---|---|---|---|---|
| pg1119_o3_native_lto.cx7 | 99.981 | 0.017 | 0.001 | 0.051 | |||||||
| pg1214_o3_native_lto.cx7 | 99.987 | 0.013 | 0.013 | ||||||||
| pg1310_o3_native_lto.cx7 | 99.988 | 0.012 | 0.014 | ||||||||
| pg147_o3_native_lto.cx7 | 99.984 | 0.016 | 0.014 | ||||||||
| pg151_o3_native_lto.cx7 | 99.987 | 0.012 | 0.001 | 0.051 | |||||||
| pg152_o3_native_lto.cx7 | 99.988 | 0.012 | 0.013 |
Performance metrics for the DBMS listed above. Some are normalized by throughput, others are not. Legend for results is here.
ips	qps	rps	rmbps	wps	wmbps	rpq	rkbpq	wpi	wkbpi	csps	cpups	cspq	cpupq	dbgb1	dbgb2	rss	maxop	p50	p99	tag
117647	0	0	0.0	354.7	122.4	0.000	0.000	0.003	1.066	23450	65.2	0.199	44	7.7	20.9	0.0	0.051	30517	21384	20m.pg1119_o3_native_lto.cx7
116959	0	0	0.0	352.0	121.0	0.000	0.000	0.003	1.059	23663	64.8	0.202	44	7.6	20.6	0.0	0.013	30767	21177	20m.pg1214_o3_native_lto.cx7
119760	0	0	0.0	361.9	124.5	0.000	0.000	0.003	1.065	24036	65.6	0.201	44	7.6	20.7	0.0	0.014	31416	21277	20m.pg1310_o3_native_lto.cx7
118343	0	0	0.0	357.6	123.6	0.000	0.000	0.003	1.070	23727	66.5	0.200	45	7.6	20.8	0.0	0.014	30866	21077	20m.pg147_o3_native_lto.cx7
119048	0	0	0.0	358.8	124.1	0.000	0.000	0.003	1.067	24075	66.2	0.202	44	7.6	20.7	0.0	0.051	31266	20827	20m.pg151_o3_native_lto.cx7
119760	0	0	0.0	362.2	124.3	0.000	0.000	0.003	1.063	23927	66.2	0.200	44	7.6	20.7	0.0	0.013	31227	21226	20m.pg152_o3_native_lto.cx7
q100.1
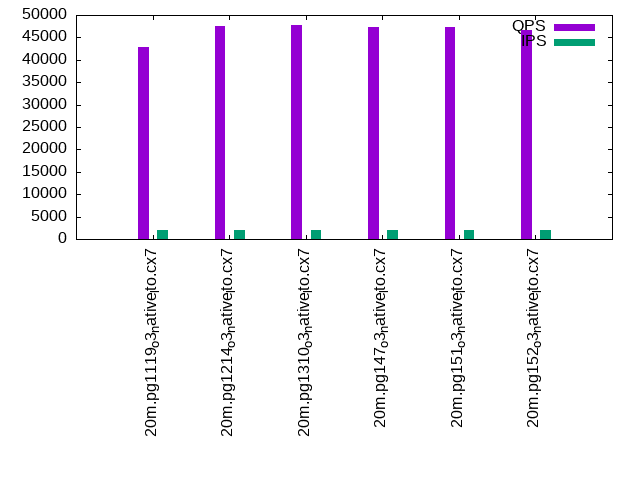
q100.1: range queries with 100 insert/s per client. Graphs for performance per 1-second interval are here.
Average throughput:
Query response time histogram: each cell has the percentage of responses that take <= the time in the header and max is the max response time in seconds. For max values in the top 25% of the range have a red background and in the bottom 25% of the range have a green background. The red background is not used when the min value is within 80% of the max value.
| dbms | 256us | 1ms | 4ms | 16ms | 64ms | 256ms | 1s | 4s | 16s | gt | max |
|---|---|---|---|---|---|---|---|---|---|---|---|
| pg1119_o3_native_lto.cx7 | 99.984 | 0.010 | 0.006 | nonzero | 0.010 | ||||||
| pg1214_o3_native_lto.cx7 | 99.986 | 0.008 | 0.005 | nonzero | 0.011 | ||||||
| pg1310_o3_native_lto.cx7 | 99.986 | 0.008 | 0.005 | nonzero | nonzero | 0.017 | |||||
| pg147_o3_native_lto.cx7 | 99.985 | 0.009 | 0.006 | nonzero | 0.010 | ||||||
| pg151_o3_native_lto.cx7 | 99.986 | 0.009 | 0.005 | nonzero | 0.010 | ||||||
| pg152_o3_native_lto.cx7 | 99.985 | 0.010 | 0.005 | nonzero | 0.010 |
Insert response time histogram: each cell has the percentage of responses that take <= the time in the header and max is the max response time in seconds. For max values in the top 25% of the range have a red background and in the bottom 25% of the range have a green background. The red background is not used when the min value is within 80% of the max value.
| dbms | 256us | 1ms | 4ms | 16ms | 64ms | 256ms | 1s | 4s | 16s | gt | max |
|---|---|---|---|---|---|---|---|---|---|---|---|
| pg1119_o3_native_lto.cx7 | 99.764 | 0.236 | 0.014 | ||||||||
| pg1214_o3_native_lto.cx7 | 99.681 | 0.319 | 0.014 | ||||||||
| pg1310_o3_native_lto.cx7 | 99.833 | 0.167 | 0.014 | ||||||||
| pg147_o3_native_lto.cx7 | 99.681 | 0.319 | 0.012 | ||||||||
| pg151_o3_native_lto.cx7 | 99.792 | 0.208 | 0.011 | ||||||||
| pg152_o3_native_lto.cx7 | 99.799 | 0.201 | 0.016 |
Performance metrics for the DBMS listed above. Some are normalized by throughput, others are not. Legend for results is here.
ips	qps	rps	rmbps	wps	wmbps	rpq	rkbpq	wpi	wkbpi	csps	cpups	cspq	cpupq	dbgb1	dbgb2	rss	maxop	p50	p99	tag
399	43786	0	0.0	387.2	15.9	0.000	0.000	0.971	40.793	167046	50.6	3.815	92	7.9	22.0	0.0	0.010	11108	9653	20m.pg1119_o3_native_lto.cx7
399	48486	0	0.0	371.2	15.7	0.000	0.000	0.931	40.248	184914	50.7	3.814	84	7.7	21.6	0.0	0.011	12167	11284	20m.pg1214_o3_native_lto.cx7
399	48826	0	0.0	378.2	15.8	0.000	0.000	0.948	40.459	186201	50.7	3.814	83	7.8	21.7	0.0	0.017	12179	11076	20m.pg1310_o3_native_lto.cx7
399	48511	0	0.0	353.5	15.5	0.000	0.000	0.886	39.845	184981	50.7	3.813	84	7.8	22.5	0.0	0.010	12179	10948	20m.pg147_o3_native_lto.cx7
399	48015	0	0.0	354.7	15.5	0.000	0.000	0.890	39.840	183159	50.6	3.815	84	7.8	22.5	0.0	0.010	11975	10596	20m.pg151_o3_native_lto.cx7
399	48005	0	0.0	355.0	15.5	0.000	0.000	0.890	39.853	183033	50.6	3.813	84	7.8	22.5	0.0	0.010	12003	10868	20m.pg152_o3_native_lto.cx7
q500.1
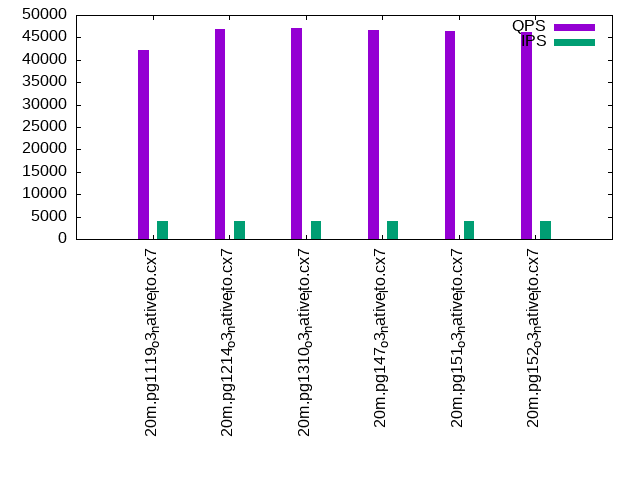
q500.1: range queries with 500 insert/s per client. Graphs for performance per 1-second interval are here.
Average throughput:
Query response time histogram: each cell has the percentage of responses that take <= the time in the header and max is the max response time in seconds. For max values in the top 25% of the range have a red background and in the bottom 25% of the range have a green background. The red background is not used when the min value is within 80% of the max value.
| dbms | 256us | 1ms | 4ms | 16ms | 64ms | 256ms | 1s | 4s | 16s | gt | max |
|---|---|---|---|---|---|---|---|---|---|---|---|
| pg1119_o3_native_lto.cx7 | 99.949 | 0.032 | 0.018 | 0.001 | nonzero | 0.019 | |||||
| pg1214_o3_native_lto.cx7 | 99.963 | 0.022 | 0.015 | 0.001 | nonzero | 0.019 | |||||
| pg1310_o3_native_lto.cx7 | 99.962 | 0.021 | 0.016 | 0.001 | nonzero | 0.020 | |||||
| pg147_o3_native_lto.cx7 | 99.954 | 0.027 | 0.019 | 0.001 | nonzero | 0.018 | |||||
| pg151_o3_native_lto.cx7 | 99.959 | 0.024 | 0.016 | 0.001 | nonzero | 0.017 | |||||
| pg152_o3_native_lto.cx7 | 99.955 | 0.027 | 0.017 | nonzero | nonzero | 0.016 |
Insert response time histogram: each cell has the percentage of responses that take <= the time in the header and max is the max response time in seconds. For max values in the top 25% of the range have a red background and in the bottom 25% of the range have a green background. The red background is not used when the min value is within 80% of the max value.
| dbms | 256us | 1ms | 4ms | 16ms | 64ms | 256ms | 1s | 4s | 16s | gt | max |
|---|---|---|---|---|---|---|---|---|---|---|---|
| pg1119_o3_native_lto.cx7 | 98.786 | 1.189 | 0.025 | 0.024 | |||||||
| pg1214_o3_native_lto.cx7 | 97.403 | 2.524 | 0.074 | 0.031 | |||||||
| pg1310_o3_native_lto.cx7 | 96.985 | 2.878 | 0.137 | 0.046 | |||||||
| pg147_o3_native_lto.cx7 | 98.522 | 1.410 | 0.068 | 0.026 | |||||||
| pg151_o3_native_lto.cx7 | 98.467 | 1.514 | 0.019 | 0.024 | |||||||
| pg152_o3_native_lto.cx7 | 99.362 | 0.629 | 0.008 | 0.020 |
Performance metrics for the DBMS listed above. Some are normalized by throughput, others are not. Legend for results is here.
ips	qps	rps	rmbps	wps	wmbps	rpq	rkbpq	wpi	wkbpi	csps	cpups	cspq	cpupq	dbgb1	dbgb2	rss	maxop	p50	p99	tag
1993	42860	0	0.0	326.4	25.3	0.000	0.000	0.164	12.979	162957	51.4	3.802	96	9.4	19.4	0.0	0.019	10900	9190	20m.pg1119_o3_native_lto.cx7
1994	47656	0	0.0	295.7	24.9	0.000	0.000	0.148	12.809	180824	51.5	3.794	86	9.3	19.3	0.0	0.019	11891	10565	20m.pg1214_o3_native_lto.cx7
1994	47845	0	0.0	305.2	25.2	0.000	0.000	0.153	12.917	181582	51.5	3.795	86	9.4	19.3	0.0	0.020	12083	10872	20m.pg1310_o3_native_lto.cx7
1994	47323	0	0.0	364.1	23.9	0.000	0.000	0.183	12.278	179711	51.4	3.797	87	9.4	22.0	0.0	0.018	11923	9752	20m.pg147_o3_native_lto.cx7
1994	47362	0	0.0	364.6	23.9	0.000	0.000	0.183	12.253	179771	51.4	3.796	87	9.4	22.0	0.0	0.017	11923	10261	20m.pg151_o3_native_lto.cx7
1993	46734	0	0.0	365.8	23.9	0.000	0.000	0.184	12.264	177485	51.3	3.798	88	9.4	22.0	0.0	0.016	11843	10229	20m.pg152_o3_native_lto.cx7
q1000.1
q1000.1: range queries with 1000 insert/s per client. Graphs for performance per 1-second interval are here.
Average throughput:
Query response time histogram: each cell has the percentage of responses that take <= the time in the header and max is the max response time in seconds. For max values in the top 25% of the range have a red background and in the bottom 25% of the range have a green background. The red background is not used when the min value is within 80% of the max value.
| dbms | 256us | 1ms | 4ms | 16ms | 64ms | 256ms | 1s | 4s | 16s | gt | max |
|---|---|---|---|---|---|---|---|---|---|---|---|
| pg1119_o3_native_lto.cx7 | 99.906 | 0.067 | 0.025 | 0.002 | nonzero | 0.039 | |||||
| pg1214_o3_native_lto.cx7 | 99.918 | 0.057 | 0.024 | 0.002 | nonzero | 0.057 | |||||
| pg1310_o3_native_lto.cx7 | 99.921 | 0.053 | 0.024 | 0.002 | nonzero | 0.040 | |||||
| pg147_o3_native_lto.cx7 | 99.903 | 0.065 | 0.030 | 0.001 | nonzero | 0.043 | |||||
| pg151_o3_native_lto.cx7 | 99.916 | 0.057 | 0.027 | 0.001 | nonzero | 0.051 | |||||
| pg152_o3_native_lto.cx7 | 99.911 | 0.059 | 0.029 | 0.001 | nonzero | nonzero | 0.067 |
Insert response time histogram: each cell has the percentage of responses that take <= the time in the header and max is the max response time in seconds. For max values in the top 25% of the range have a red background and in the bottom 25% of the range have a green background. The red background is not used when the min value is within 80% of the max value.
| dbms | 256us | 1ms | 4ms | 16ms | 64ms | 256ms | 1s | 4s | 16s | gt | max |
|---|---|---|---|---|---|---|---|---|---|---|---|
| pg1119_o3_native_lto.cx7 | 98.271 | 1.699 | 0.026 | 0.004 | 0.097 | ||||||
| pg1214_o3_native_lto.cx7 | 97.892 | 2.046 | 0.056 | 0.006 | 0.077 | ||||||
| pg1310_o3_native_lto.cx7 | 97.253 | 2.665 | 0.075 | 0.006 | 0.111 | ||||||
| pg147_o3_native_lto.cx7 | 98.044 | 1.908 | 0.040 | 0.008 | 0.099 | ||||||
| pg151_o3_native_lto.cx7 | 97.628 | 2.318 | 0.044 | 0.010 | 0.090 | ||||||
| pg152_o3_native_lto.cx7 | 98.497 | 1.475 | 0.022 | 0.006 | 0.118 |
Performance metrics for the DBMS listed above. Some are normalized by throughput, others are not. Legend for results is here.
ips	qps	rps	rmbps	wps	wmbps	rpq	rkbpq	wpi	wkbpi	csps	cpups	cspq	cpupq	dbgb1	dbgb2	rss	maxop	p50	p99	tag
3989	42161	22	0.5	352.2	35.8	0.001	0.012	0.088	9.185	158783	52.5	3.766	100	11.8	20.4	0.0	0.039	10697	8902	20m.pg1119_o3_native_lto.cx7
3989	46773	26	0.5	391.8	36.7	0.001	0.011	0.098	9.420	176085	52.6	3.765	90	11.9	20.5	0.0	0.057	11811	10233	20m.pg1214_o3_native_lto.cx7
3989	47054	28	0.6	373.8	36.2	0.001	0.012	0.094	9.286	177213	52.6	3.766	89	11.9	20.4	0.0	0.040	11896	10360	20m.pg1310_o3_native_lto.cx7
3989	46619	31	0.3	507.4	34.4	0.001	0.006	0.127	8.835	175764	52.5	3.770	90	11.9	22.7	0.0	0.043	11767	9925	20m.pg147_o3_native_lto.cx7
3989	46328	34	0.3	503.4	34.4	0.001	0.006	0.126	8.843	174435	52.5	3.765	91	11.9	22.7	0.0	0.051	11683	9525	20m.pg151_o3_native_lto.cx7
3989	46187	34	0.3	502.6	34.5	0.001	0.006	0.126	8.854	174093	52.3	3.769	91	11.9	22.7	0.0	0.067	11652	9669	20m.pg152_o3_native_lto.cx7
l.i0
l.i0: load without secondary indexes
Performance metrics for all DBMS, not just the ones listed above. Some are normalized by throughput, others are not. Legend for results is here.
ips	qps	rps	rmbps	wps	wmbps	rpq	rkbpq	wpi	wkbpi	csps	cpups	cspq	cpupq	dbgb1	dbgb2	rss	maxop	p50	p99	tag
263158	0	0	0.0	309.2	113.7	0.000	0.000	0.001	0.443	25920	71.3	0.098	22	1.9	5.2	0.0	0.012	78615	36196	20m.pg1119_o3_native_lto.cx7
256410	0	0	0.0	285.3	102.8	0.000	0.000	0.001	0.411	25778	70.8	0.101	22	1.9	5.2	0.0	0.012	75418	28769	20m.pg1214_o3_native_lto.cx7
270270	0	0	0.0	304.4	109.6	0.000	0.000	0.001	0.415	26468	71.0	0.098	21	1.9	5.2	0.0	0.013	80912	8890	20m.pg1310_o3_native_lto.cx7
256410	0	0	0.0	303.9	112.3	0.000	0.000	0.001	0.448	25691	70.7	0.100	22	1.9	5.2	0.0	0.010	76915	17287	20m.pg147_o3_native_lto.cx7
266667	0	0	0.0	293.2	105.7	0.000	0.000	0.001	0.406	26154	68.8	0.098	21	1.9	5.2	0.0	0.011	79838	22176	20m.pg151_o3_native_lto.cx7
259740	0	0	0.0	293.3	105.6	0.000	0.000	0.001	0.416	25958	69.0	0.100	21	1.9	5.2	0.0	0.011	79343	300	20m.pg152_o3_native_lto.cx7
l.x
l.x: create secondary indexes
Performance metrics for all DBMS, not just the ones listed above. Some are normalized by throughput, others are not. Legend for results is here.
ips	qps	rps	rmbps	wps	wmbps	rpq	rkbpq	wpi	wkbpi	csps	cpups	cspq	cpupq	dbgb1	dbgb2	rss	maxop	p50	p99	tag
837500	0	0	0.0	353.8	161.7	0.000	0.000	0.000	0.198	1730	44.4	0.002	4	3.7	8.6	0.0	0.003	NA	NA	20m.pg1119_o3_native_lto.cx7
804000	0	0	0.0	349.1	159.7	0.000	0.000	0.000	0.203	1512	41.6	0.002	4	3.7	8.6	0.0	0.003	NA	NA	20m.pg1214_o3_native_lto.cx7
804000	0	0	0.0	376.3	171.4	0.000	0.000	0.000	0.218	1334	41.2	0.002	4	3.7	8.6	0.0	0.003	NA	NA	20m.pg1310_o3_native_lto.cx7
804000	0	0	0.0	448.3	206.3	0.000	0.000	0.001	0.263	1962	38.5	0.002	4	3.7	8.6	0.0	0.003	NA	NA	20m.pg147_o3_native_lto.cx7
873913	0	0	0.0	399.4	185.2	0.000	0.000	0.000	0.217	1265	39.4	0.001	4	3.7	8.6	0.0	0.004	NA	NA	20m.pg151_o3_native_lto.cx7
913636	0	0	0.0	402.2	186.0	0.000	0.000	0.000	0.208	1747	38.0	0.002	3	3.7	8.6	0.0	0.004	NA	NA	20m.pg152_o3_native_lto.cx7
l.i1
l.i1: continue load after secondary indexes created
Performance metrics for all DBMS, not just the ones listed above. Some are normalized by throughput, others are not. Legend for results is here.
ips	qps	rps	rmbps	wps	wmbps	rpq	rkbpq	wpi	wkbpi	csps	cpups	cspq	cpupq	dbgb1	dbgb2	rss	maxop	p50	p99	tag
117647	0	0	0.0	354.7	122.4	0.000	0.000	0.003	1.066	23450	65.2	0.199	44	7.7	20.9	0.0	0.051	30517	21384	20m.pg1119_o3_native_lto.cx7
116959	0	0	0.0	352.0	121.0	0.000	0.000	0.003	1.059	23663	64.8	0.202	44	7.6	20.6	0.0	0.013	30767	21177	20m.pg1214_o3_native_lto.cx7
119760	0	0	0.0	361.9	124.5	0.000	0.000	0.003	1.065	24036	65.6	0.201	44	7.6	20.7	0.0	0.014	31416	21277	20m.pg1310_o3_native_lto.cx7
118343	0	0	0.0	357.6	123.6	0.000	0.000	0.003	1.070	23727	66.5	0.200	45	7.6	20.8	0.0	0.014	30866	21077	20m.pg147_o3_native_lto.cx7
119048	0	0	0.0	358.8	124.1	0.000	0.000	0.003	1.067	24075	66.2	0.202	44	7.6	20.7	0.0	0.051	31266	20827	20m.pg151_o3_native_lto.cx7
119760	0	0	0.0	362.2	124.3	0.000	0.000	0.003	1.063	23927	66.2	0.200	44	7.6	20.7	0.0	0.013	31227	21226	20m.pg152_o3_native_lto.cx7
q100.1
q100.1: range queries with 100 insert/s per client
Performance metrics for all DBMS, not just the ones listed above. Some are normalized by throughput, others are not. Legend for results is here.
ips	qps	rps	rmbps	wps	wmbps	rpq	rkbpq	wpi	wkbpi	csps	cpups	cspq	cpupq	dbgb1	dbgb2	rss	maxop	p50	p99	tag
399	43786	0	0.0	387.2	15.9	0.000	0.000	0.971	40.793	167046	50.6	3.815	92	7.9	22.0	0.0	0.010	11108	9653	20m.pg1119_o3_native_lto.cx7
399	48486	0	0.0	371.2	15.7	0.000	0.000	0.931	40.248	184914	50.7	3.814	84	7.7	21.6	0.0	0.011	12167	11284	20m.pg1214_o3_native_lto.cx7
399	48826	0	0.0	378.2	15.8	0.000	0.000	0.948	40.459	186201	50.7	3.814	83	7.8	21.7	0.0	0.017	12179	11076	20m.pg1310_o3_native_lto.cx7
399	48511	0	0.0	353.5	15.5	0.000	0.000	0.886	39.845	184981	50.7	3.813	84	7.8	22.5	0.0	0.010	12179	10948	20m.pg147_o3_native_lto.cx7
399	48015	0	0.0	354.7	15.5	0.000	0.000	0.890	39.840	183159	50.6	3.815	84	7.8	22.5	0.0	0.010	11975	10596	20m.pg151_o3_native_lto.cx7
399	48005	0	0.0	355.0	15.5	0.000	0.000	0.890	39.853	183033	50.6	3.813	84	7.8	22.5	0.0	0.010	12003	10868	20m.pg152_o3_native_lto.cx7
q500.1
q500.1: range queries with 500 insert/s per client
Performance metrics for all DBMS, not just the ones listed above. Some are normalized by throughput, others are not. Legend for results is here.
ips	qps	rps	rmbps	wps	wmbps	rpq	rkbpq	wpi	wkbpi	csps	cpups	cspq	cpupq	dbgb1	dbgb2	rss	maxop	p50	p99	tag
1993	42860	0	0.0	326.4	25.3	0.000	0.000	0.164	12.979	162957	51.4	3.802	96	9.4	19.4	0.0	0.019	10900	9190	20m.pg1119_o3_native_lto.cx7
1994	47656	0	0.0	295.7	24.9	0.000	0.000	0.148	12.809	180824	51.5	3.794	86	9.3	19.3	0.0	0.019	11891	10565	20m.pg1214_o3_native_lto.cx7
1994	47845	0	0.0	305.2	25.2	0.000	0.000	0.153	12.917	181582	51.5	3.795	86	9.4	19.3	0.0	0.020	12083	10872	20m.pg1310_o3_native_lto.cx7
1994	47323	0	0.0	364.1	23.9	0.000	0.000	0.183	12.278	179711	51.4	3.797	87	9.4	22.0	0.0	0.018	11923	9752	20m.pg147_o3_native_lto.cx7
1994	47362	0	0.0	364.6	23.9	0.000	0.000	0.183	12.253	179771	51.4	3.796	87	9.4	22.0	0.0	0.017	11923	10261	20m.pg151_o3_native_lto.cx7
1993	46734	0	0.0	365.8	23.9	0.000	0.000	0.184	12.264	177485	51.3	3.798	88	9.4	22.0	0.0	0.016	11843	10229	20m.pg152_o3_native_lto.cx7
q1000.1
q1000.1: range queries with 1000 insert/s per client
Performance metrics for all DBMS, not just the ones listed above. Some are normalized by throughput, others are not. Legend for results is here.
ips	qps	rps	rmbps	wps	wmbps	rpq	rkbpq	wpi	wkbpi	csps	cpups	cspq	cpupq	dbgb1	dbgb2	rss	maxop	p50	p99	tag
3989	42161	22	0.5	352.2	35.8	0.001	0.012	0.088	9.185	158783	52.5	3.766	100	11.8	20.4	0.0	0.039	10697	8902	20m.pg1119_o3_native_lto.cx7
3989	46773	26	0.5	391.8	36.7	0.001	0.011	0.098	9.420	176085	52.6	3.765	90	11.9	20.5	0.0	0.057	11811	10233	20m.pg1214_o3_native_lto.cx7
3989	47054	28	0.6	373.8	36.2	0.001	0.012	0.094	9.286	177213	52.6	3.766	89	11.9	20.4	0.0	0.040	11896	10360	20m.pg1310_o3_native_lto.cx7
3989	46619	31	0.3	507.4	34.4	0.001	0.006	0.127	8.835	175764	52.5	3.770	90	11.9	22.7	0.0	0.043	11767	9925	20m.pg147_o3_native_lto.cx7
3989	46328	34	0.3	503.4	34.4	0.001	0.006	0.126	8.843	174435	52.5	3.765	91	11.9	22.7	0.0	0.051	11683	9525	20m.pg151_o3_native_lto.cx7
3989	46187	34	0.3	502.6	34.5	0.001	0.006	0.126	8.854	174093	52.3	3.769	91	11.9	22.7	0.0	0.067	11652	9669	20m.pg152_o3_native_lto.cx7
l.i0
- l.i0: load without secondary indexes
- Legend for results is here.
- Each entry lists the percentage of responses that fit in that bucket (slower than max time for previous bucket, faster than min time for next bucket).
Insert response time histogram
256us	1ms	4ms	16ms	64ms	256ms	1s	4s	16s	gt	max	tag
0.000	0.000	99.975	0.026	0.000	0.000	0.000	0.000	0.000	0.000	0.012	pg1119_o3_native_lto.cx7
0.000	0.000	99.976	0.024	0.000	0.000	0.000	0.000	0.000	0.000	0.012	pg1214_o3_native_lto.cx7
0.000	0.003	99.972	0.026	0.000	0.000	0.000	0.000	0.000	0.000	0.013	pg1310_o3_native_lto.cx7
0.000	0.000	99.983	0.017	0.000	0.000	0.000	0.000	0.000	0.000	0.010	pg147_o3_native_lto.cx7
0.000	0.000	99.968	0.032	0.000	0.000	0.000	0.000	0.000	0.000	0.011	pg151_o3_native_lto.cx7
0.000	0.000	99.953	0.047	0.000	0.000	0.000	0.000	0.000	0.000	0.011	pg152_o3_native_lto.cx7
l.x
- l.x: create secondary indexes
- Legend for results is here.
- Each entry lists the percentage of responses that fit in that bucket (slower than max time for previous bucket, faster than min time for next bucket).
TODO - determine whether there is data for create index response time
l.i1
- l.i1: continue load after secondary indexes created
- Legend for results is here.
- Each entry lists the percentage of responses that fit in that bucket (slower than max time for previous bucket, faster than min time for next bucket).
Insert response time histogram
256us	1ms	4ms	16ms	64ms	256ms	1s	4s	16s	gt	max	tag
0.000	0.000	99.981	0.017	0.001	0.000	0.000	0.000	0.000	0.000	0.051	pg1119_o3_native_lto.cx7
0.000	0.000	99.987	0.013	0.000	0.000	0.000	0.000	0.000	0.000	0.013	pg1214_o3_native_lto.cx7
0.000	0.000	99.988	0.012	0.000	0.000	0.000	0.000	0.000	0.000	0.014	pg1310_o3_native_lto.cx7
0.000	0.000	99.984	0.016	0.000	0.000	0.000	0.000	0.000	0.000	0.014	pg147_o3_native_lto.cx7
0.000	0.000	99.987	0.012	0.001	0.000	0.000	0.000	0.000	0.000	0.051	pg151_o3_native_lto.cx7
0.000	0.000	99.988	0.012	0.000	0.000	0.000	0.000	0.000	0.000	0.013	pg152_o3_native_lto.cx7
q100.1
- q100.1: range queries with 100 insert/s per client
- Legend for results is here.
- Each entry lists the percentage of responses that fit in that bucket (slower than max time for previous bucket, faster than min time for next bucket).
Query response time histogram
256us	1ms	4ms	16ms	64ms	256ms	1s	4s	16s	gt	max	tag
99.984	0.010	0.006	nonzero	0.000	0.000	0.000	0.000	0.000	0.000	0.010	pg1119_o3_native_lto.cx7
99.986	0.008	0.005	nonzero	0.000	0.000	0.000	0.000	0.000	0.000	0.011	pg1214_o3_native_lto.cx7
99.986	0.008	0.005	nonzero	nonzero	0.000	0.000	0.000	0.000	0.000	0.017	pg1310_o3_native_lto.cx7
99.985	0.009	0.006	nonzero	0.000	0.000	0.000	0.000	0.000	0.000	0.010	pg147_o3_native_lto.cx7
99.986	0.009	0.005	nonzero	0.000	0.000	0.000	0.000	0.000	0.000	0.010	pg151_o3_native_lto.cx7
99.985	0.010	0.005	nonzero	0.000	0.000	0.000	0.000	0.000	0.000	0.010	pg152_o3_native_lto.cx7
Insert response time histogram
256us	1ms	4ms	16ms	64ms	256ms	1s	4s	16s	gt	max	tag
0.000	0.000	99.764	0.236	0.000	0.000	0.000	0.000	0.000	0.000	0.014	pg1119_o3_native_lto.cx7
0.000	0.000	99.681	0.319	0.000	0.000	0.000	0.000	0.000	0.000	0.014	pg1214_o3_native_lto.cx7
0.000	0.000	99.833	0.167	0.000	0.000	0.000	0.000	0.000	0.000	0.014	pg1310_o3_native_lto.cx7
0.000	0.000	99.681	0.319	0.000	0.000	0.000	0.000	0.000	0.000	0.012	pg147_o3_native_lto.cx7
0.000	0.000	99.792	0.208	0.000	0.000	0.000	0.000	0.000	0.000	0.011	pg151_o3_native_lto.cx7
0.000	0.000	99.799	0.201	0.000	0.000	0.000	0.000	0.000	0.000	0.016	pg152_o3_native_lto.cx7
q500.1
- q500.1: range queries with 500 insert/s per client
- Legend for results is here.
- Each entry lists the percentage of responses that fit in that bucket (slower than max time for previous bucket, faster than min time for next bucket).
Query response time histogram
256us	1ms	4ms	16ms	64ms	256ms	1s	4s	16s	gt	max	tag
99.949	0.032	0.018	0.001	nonzero	0.000	0.000	0.000	0.000	0.000	0.019	pg1119_o3_native_lto.cx7
99.963	0.022	0.015	0.001	nonzero	0.000	0.000	0.000	0.000	0.000	0.019	pg1214_o3_native_lto.cx7
99.962	0.021	0.016	0.001	nonzero	0.000	0.000	0.000	0.000	0.000	0.020	pg1310_o3_native_lto.cx7
99.954	0.027	0.019	0.001	nonzero	0.000	0.000	0.000	0.000	0.000	0.018	pg147_o3_native_lto.cx7
99.959	0.024	0.016	0.001	nonzero	0.000	0.000	0.000	0.000	0.000	0.017	pg151_o3_native_lto.cx7
99.955	0.027	0.017	nonzero	nonzero	0.000	0.000	0.000	0.000	0.000	0.016	pg152_o3_native_lto.cx7
Insert response time histogram
256us	1ms	4ms	16ms	64ms	256ms	1s	4s	16s	gt	max	tag
0.000	0.000	98.786	1.189	0.025	0.000	0.000	0.000	0.000	0.000	0.024	pg1119_o3_native_lto.cx7
0.000	0.000	97.403	2.524	0.074	0.000	0.000	0.000	0.000	0.000	0.031	pg1214_o3_native_lto.cx7
0.000	0.000	96.985	2.878	0.137	0.000	0.000	0.000	0.000	0.000	0.046	pg1310_o3_native_lto.cx7
0.000	0.000	98.522	1.410	0.068	0.000	0.000	0.000	0.000	0.000	0.026	pg147_o3_native_lto.cx7
0.000	0.000	98.467	1.514	0.019	0.000	0.000	0.000	0.000	0.000	0.024	pg151_o3_native_lto.cx7
0.000	0.000	99.362	0.629	0.008	0.000	0.000	0.000	0.000	0.000	0.020	pg152_o3_native_lto.cx7
q1000.1
- q1000.1: range queries with 1000 insert/s per client
- Legend for results is here.
- Each entry lists the percentage of responses that fit in that bucket (slower than max time for previous bucket, faster than min time for next bucket).
Query response time histogram
256us	1ms	4ms	16ms	64ms	256ms	1s	4s	16s	gt	max	tag
99.906	0.067	0.025	0.002	nonzero	0.000	0.000	0.000	0.000	0.000	0.039	pg1119_o3_native_lto.cx7
99.918	0.057	0.024	0.002	nonzero	0.000	0.000	0.000	0.000	0.000	0.057	pg1214_o3_native_lto.cx7
99.921	0.053	0.024	0.002	nonzero	0.000	0.000	0.000	0.000	0.000	0.040	pg1310_o3_native_lto.cx7
99.903	0.065	0.030	0.001	nonzero	0.000	0.000	0.000	0.000	0.000	0.043	pg147_o3_native_lto.cx7
99.916	0.057	0.027	0.001	nonzero	0.000	0.000	0.000	0.000	0.000	0.051	pg151_o3_native_lto.cx7
99.911	0.059	0.029	0.001	nonzero	nonzero	0.000	0.000	0.000	0.000	0.067	pg152_o3_native_lto.cx7
Insert response time histogram
256us	1ms	4ms	16ms	64ms	256ms	1s	4s	16s	gt	max	tag
0.000	0.000	98.271	1.699	0.026	0.004	0.000	0.000	0.000	0.000	0.097	pg1119_o3_native_lto.cx7
0.000	0.000	97.892	2.046	0.056	0.006	0.000	0.000	0.000	0.000	0.077	pg1214_o3_native_lto.cx7
0.000	0.000	97.253	2.665	0.075	0.006	0.000	0.000	0.000	0.000	0.111	pg1310_o3_native_lto.cx7
0.000	0.000	98.044	1.908	0.040	0.008	0.000	0.000	0.000	0.000	0.099	pg147_o3_native_lto.cx7
0.000	0.000	97.628	2.318	0.044	0.010	0.000	0.000	0.000	0.000	0.090	pg151_o3_native_lto.cx7
0.000	0.000	98.497	1.475	0.022	0.006	0.000	0.000	0.000	0.000	0.118	pg152_o3_native_lto.cx7