Introduction
This is a report for the insert benchmark with 20M docs and 1 client(s). It is generated by scripts (bash, awk, sed) and Tufte might not be impressed. An overview of the insert benchmark is here and a short update is here. Below, by DBMS, I mean DBMS+version.config. An example is my8020.c10b40 where my means MySQL, 8020 is version 8.0.20 and c10b40 is the name for the configuration file.
The test server has 8 AMD cores, 16G RAM and an NVMe SSD. It is described here as the Beelink. The benchmark was run with 1 client and there were 1 or 2 connections per client (1 for queries, 1 for inserts). It uses 1 table. It loads 20M rows without secondary indexes, creates secondary indexes, loads another 20M rows then does 3 read+write tests for one hour each that do queries as fast as possible with 100, 500 and then 1000 writes/second/client concurrent with the queries. The database is cached by the storage engine and the only IO is for writes. Clients and the DBMS share one server. The per-database configs are in the per-database subdirectories here.
The tested DBMS are:
- pg1119_o3_native_lto.cx7 - Postgres 11.19, the cx7 config and the build used: -O3 -march=native -mtune=native
- pg1214_o3_native_lto.cx7 - Postgres 12.14, the cx7 config and the build used: -O3 -march=native -mtune=native
- pg1310_o3_native_lto.cx7 - Postgres 13.10, the cx7 config and the build used: -O3 -march=native -mtune=native
- pg147_o3_native_lto.cx7 - Postgres 14.7, the cx7 config and the build used: -O3 -march=native -mtune=native
- pg151_o3_native_lto.cx7 - Postgres 15.1, the cx7 config and the build used: -O3 -march=native -mtune=native
- pg152_o3_native_lto.cx7 - Postgres 15.2, the cx7 config and the build used: -O3 -march=native -mtune=native
Contents
- Summary
- l.i0: load without secondary indexes
- l.x: create secondary indexes
- l.i1: continue load after secondary indexes created
- q100.1: range queries with 100 insert/s per client
- q500.1: range queries with 500 insert/s per client
- q1000.1: range queries with 1000 insert/s per client
Summary
The numbers are inserts/s for l.i0 and l.i1, indexed docs (or rows) /s for l.x and queries/s for q*.2. The values are the average rate over the entire test for inserts (IPS) and queries (QPS). The range of values for IPS and QPS is split into 3 parts: bottom 25%, middle 50%, top 25%. Values in the bottom 25% have a red background, values in the top 25% have a green background and values in the middle have no color. A gray background is used for values that can be ignored because the DBMS did not sustain the target insert rate. Red backgrounds are not used when the minimum value is within 80% of the max value.
| dbms | l.i0 | l.x | l.i1 | q100.1 | q500.1 | q1000.1 |
|---|---|---|---|---|---|---|
| 20m.pg1119_o3_native_lto.cx7 | 81967 | 251250 | 30912 | 8063 | 8109 | 8120 |
| 20m.pg1214_o3_native_lto.cx7 | 80645 | 245122 | 30349 | 8831 | 8866 | 8808 |
| 20m.pg1310_o3_native_lto.cx7 | 85106 | 248148 | 30864 | 9103 | 8991 | 8944 |
| 20m.pg147_o3_native_lto.cx7 | 79681 | 242169 | 30441 | 9024 | 8738 | 8782 |
| 20m.pg151_o3_native_lto.cx7 | 85470 | 261039 | 31056 | 8894 | 8880 | 8912 |
| 20m.pg152_o3_native_lto.cx7 | 85470 | 257692 | 31250 | 8962 | 8824 | 8839 |
This table has relative throughput, throughput for the DBMS relative to the DBMS in the first line, using the absolute throughput from the previous table.
| dbms | l.i0 | l.x | l.i1 | q100.1 | q500.1 | q1000.1 |
|---|---|---|---|---|---|---|
| 20m.pg1119_o3_native_lto.cx7 | 1.00 | 1.00 | 1.00 | 1.00 | 1.00 | 1.00 |
| 20m.pg1214_o3_native_lto.cx7 | 0.98 | 0.98 | 0.98 | 1.10 | 1.09 | 1.08 |
| 20m.pg1310_o3_native_lto.cx7 | 1.04 | 0.99 | 1.00 | 1.13 | 1.11 | 1.10 |
| 20m.pg147_o3_native_lto.cx7 | 0.97 | 0.96 | 0.98 | 1.12 | 1.08 | 1.08 |
| 20m.pg151_o3_native_lto.cx7 | 1.04 | 1.04 | 1.00 | 1.10 | 1.10 | 1.10 |
| 20m.pg152_o3_native_lto.cx7 | 1.04 | 1.03 | 1.01 | 1.11 | 1.09 | 1.09 |
This lists the average rate of inserts/s for the tests that do inserts concurrent with queries. For such tests the query rate is listed in the table above. The read+write tests are setup so that the insert rate should match the target rate every second. Cells that are not at least 95% of the target have a red background to indicate a failure to satisfy the target.
| dbms | q100.1 | q500.1 | q1000.1 |
|---|---|---|---|
| pg1119_o3_native_lto.cx7 | 100 | 499 | 998 |
| pg1214_o3_native_lto.cx7 | 100 | 499 | 998 |
| pg1310_o3_native_lto.cx7 | 100 | 499 | 998 |
| pg147_o3_native_lto.cx7 | 100 | 499 | 998 |
| pg151_o3_native_lto.cx7 | 100 | 499 | 997 |
| pg152_o3_native_lto.cx7 | 100 | 499 | 998 |
| target | 100 | 500 | 1000 |
l.i0
l.i0: load without secondary indexes. Graphs for performance per 1-second interval are here.
Average throughput:

Insert response time histogram: each cell has the percentage of responses that take <= the time in the header and max is the max response time in seconds. For the max column values in the top 25% of the range have a red background and in the bottom 25% of the range have a green background. The red background is not used when the min value is within 80% of the max value.
| dbms | 256us | 1ms | 4ms | 16ms | 64ms | 256ms | 1s | 4s | 16s | gt | max |
|---|---|---|---|---|---|---|---|---|---|---|---|
| pg1119_o3_native_lto.cx7 | 100.000 | 0.003 | |||||||||
| pg1214_o3_native_lto.cx7 | 100.000 | 0.004 | |||||||||
| pg1310_o3_native_lto.cx7 | 0.016 | 99.984 | 0.004 | ||||||||
| pg147_o3_native_lto.cx7 | 100.000 | 0.003 | |||||||||
| pg151_o3_native_lto.cx7 | 0.060 | 99.940 | 0.001 | 0.006 | |||||||
| pg152_o3_native_lto.cx7 | 0.070 | 99.930 | 0.001 | 0.006 |
Performance metrics for the DBMS listed above. Some are normalized by throughput, others are not. Legend for results is here.
ips	qps	rps	rmbps	wps	wmbps	rpq	rkbpq	wpi	wkbpi	csps	cpups	cspq	cpupq	dbgb1	dbgb2	rss	maxop	p50	p99	tag
81967	0	0	0.0	96.7	35.0	0.000	0.000	0.001	0.437	9991	22.6	0.122	22	1.9	5.2	0.0	0.003	82682	74353	20m.pg1119_o3_native_lto.cx7
80645	0	0	0.0	93.7	34.1	0.000	0.000	0.001	0.433	9791	22.6	0.121	22	1.9	5.2	0.0	0.004	81022	56601	20m.pg1214_o3_native_lto.cx7
85106	0	0	0.0	99.1	36.1	0.000	0.000	0.001	0.434	10298	22.7	0.121	21	1.9	5.2	0.7	0.004	85235	74731	20m.pg1310_o3_native_lto.cx7
79681	0	0	0.0	93.7	33.9	0.000	0.000	0.001	0.436	9725	22.4	0.122	22	1.9	5.2	0.0	0.003	79887	77213	20m.pg147_o3_native_lto.cx7
85470	0	0	0.0	99.9	36.5	0.000	0.000	0.001	0.437	10360	22.7	0.121	21	1.9	5.2	0.0	0.006	86007	70817	20m.pg151_o3_native_lto.cx7
85470	0	0	0.0	100.2	36.5	0.000	0.000	0.001	0.437	10369	22.8	0.121	21	1.9	5.2	0.0	0.006	86019	73918	20m.pg152_o3_native_lto.cx7
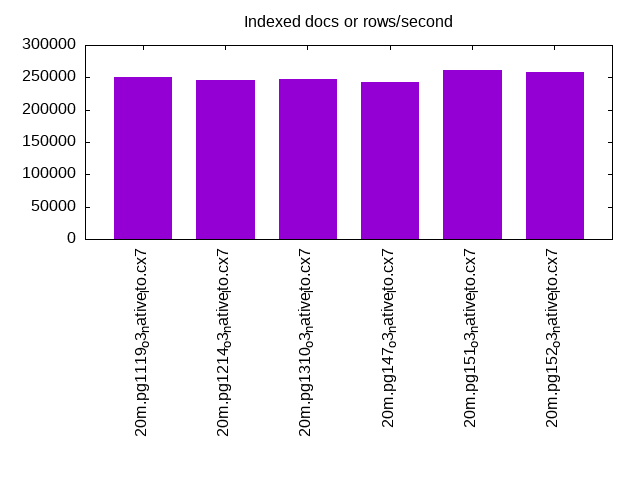
l.x
l.x: create secondary indexes.
Average throughput:
Performance metrics for the DBMS listed above. Some are normalized by throughput, others are not. Legend for results is here.
ips	qps	rps	rmbps	wps	wmbps	rpq	rkbpq	wpi	wkbpi	csps	cpups	cspq	cpupq	dbgb1	dbgb2	rss	maxop	p50	p99	tag
251250	0	0	0.0	148.4	65.5	0.000	0.000	0.001	0.267	733	12.4	0.003	4	3.7	8.6	0.0	0.004	NA	NA	20m.pg1119_o3_native_lto.cx7
245122	0	0	0.0	127.5	54.8	0.000	0.000	0.001	0.229	759	12.5	0.003	4	3.7	8.6	0.0	0.003	NA	NA	20m.pg1214_o3_native_lto.cx7
248148	0	0	0.0	125.5	56.0	0.000	0.000	0.001	0.231	780	12.5	0.003	4	3.7	8.6	0.0	0.003	NA	NA	20m.pg1310_o3_native_lto.cx7
242169	0	0	0.0	117.7	51.7	0.000	0.000	0.000	0.219	679	12.4	0.003	4	3.7	8.6	0.0	0.003	NA	NA	20m.pg147_o3_native_lto.cx7
261039	0	0	0.0	124.1	54.0	0.000	0.000	0.000	0.212	716	12.4	0.003	4	3.7	8.6	0.0	0.003	NA	NA	20m.pg151_o3_native_lto.cx7
257692	0	0	0.0	129.7	56.9	0.000	0.000	0.001	0.226	747	12.6	0.003	4	3.7	8.6	0.0	0.003	NA	NA	20m.pg152_o3_native_lto.cx7
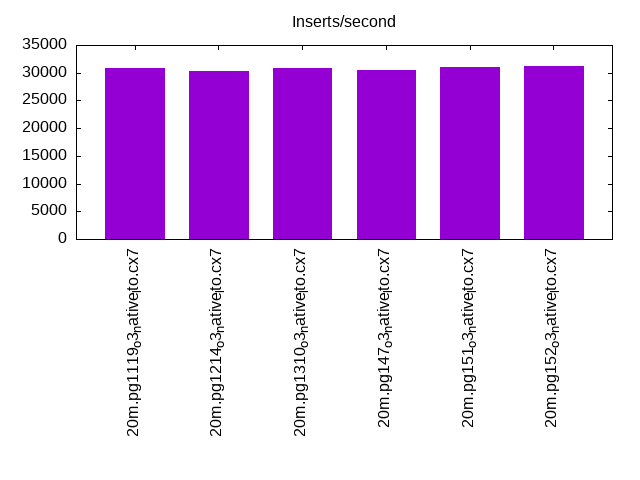
l.i1
l.i1: continue load after secondary indexes created. Graphs for performance per 1-second interval are here.
Average throughput:
Insert response time histogram: each cell has the percentage of responses that take <= the time in the header and max is the max response time in seconds. For the max column values in the top 25% of the range have a red background and in the bottom 25% of the range have a green background. The red background is not used when the min value is within 80% of the max value.
| dbms | 256us | 1ms | 4ms | 16ms | 64ms | 256ms | 1s | 4s | 16s | gt | max |
|---|---|---|---|---|---|---|---|---|---|---|---|
| pg1119_o3_native_lto.cx7 | 99.997 | 0.003 | 0.008 | ||||||||
| pg1214_o3_native_lto.cx7 | 99.998 | 0.002 | 0.008 | ||||||||
| pg1310_o3_native_lto.cx7 | 99.996 | 0.004 | 0.013 | ||||||||
| pg147_o3_native_lto.cx7 | 99.994 | 0.006 | 0.011 | ||||||||
| pg151_o3_native_lto.cx7 | 99.995 | 0.005 | 0.009 | ||||||||
| pg152_o3_native_lto.cx7 | 99.995 | 0.006 | 0.008 |
Performance metrics for the DBMS listed above. Some are normalized by throughput, others are not. Legend for results is here.
ips	qps	rps	rmbps	wps	wmbps	rpq	rkbpq	wpi	wkbpi	csps	cpups	cspq	cpupq	dbgb1	dbgb2	rss	maxop	p50	p99	tag
30912	0	0	0.0	194.9	52.1	0.000	0.000	0.006	1.725	7774	18.3	0.251	47	8.3	17.7	1.6	0.008	31165	23007	20m.pg1119_o3_native_lto.cx7
30349	0	0	0.0	197.1	50.9	0.000	0.000	0.006	1.717	7655	18.2	0.252	48	8.2	17.5	0.0	0.008	31114	21576	20m.pg1214_o3_native_lto.cx7
30864	0	0	0.0	179.2	52.4	0.000	0.000	0.006	1.738	7775	18.3	0.252	47	8.2	17.6	0.0	0.013	31663	21776	20m.pg1310_o3_native_lto.cx7
30441	0	0	0.0	174.7	51.5	0.000	0.000	0.006	1.733	7753	18.2	0.255	48	8.2	19.5	0.0	0.011	31260	21526	20m.pg147_o3_native_lto.cx7
31056	0	0	0.0	176.5	52.7	0.000	0.000	0.006	1.738	7841	18.2	0.252	47	8.2	19.8	0.2	0.009	31815	21875	20m.pg151_o3_native_lto.cx7
31250	0	0	0.0	177.9	53.2	0.000	0.000	0.006	1.742	7874	18.2	0.252	47	8.2	19.9	0.0	0.008	32077	21875	20m.pg152_o3_native_lto.cx7
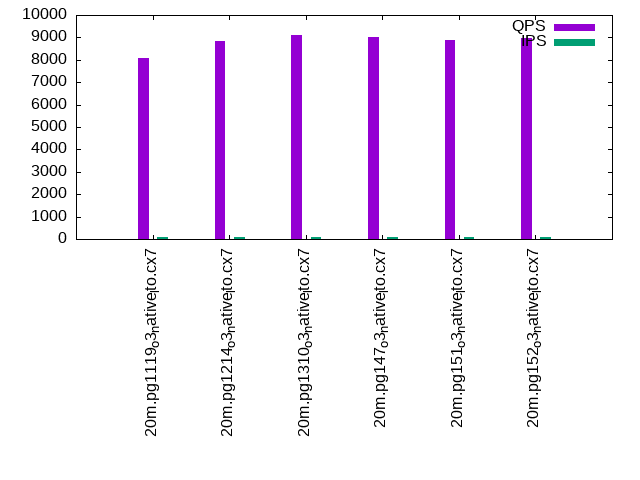
q100.1
q100.1: range queries with 100 insert/s per client. Graphs for performance per 1-second interval are here.
Average throughput:
Query response time histogram: each cell has the percentage of responses that take <= the time in the header and max is the max response time in seconds. For max values in the top 25% of the range have a red background and in the bottom 25% of the range have a green background. The red background is not used when the min value is within 80% of the max value.
| dbms | 256us | 1ms | 4ms | 16ms | 64ms | 256ms | 1s | 4s | 16s | gt | max |
|---|---|---|---|---|---|---|---|---|---|---|---|
| pg1119_o3_native_lto.cx7 | 99.921 | 0.079 | nonzero | 0.001 | |||||||
| pg1214_o3_native_lto.cx7 | 99.947 | 0.053 | nonzero | nonzero | 0.004 | ||||||
| pg1310_o3_native_lto.cx7 | 99.956 | 0.044 | nonzero | 0.003 | |||||||
| pg147_o3_native_lto.cx7 | 99.970 | 0.030 | nonzero | 0.003 | |||||||
| pg151_o3_native_lto.cx7 | 99.968 | 0.032 | nonzero | nonzero | 0.004 | ||||||
| pg152_o3_native_lto.cx7 | 99.965 | 0.034 | nonzero | 0.002 |
Insert response time histogram: each cell has the percentage of responses that take <= the time in the header and max is the max response time in seconds. For max values in the top 25% of the range have a red background and in the bottom 25% of the range have a green background. The red background is not used when the min value is within 80% of the max value.
| dbms | 256us | 1ms | 4ms | 16ms | 64ms | 256ms | 1s | 4s | 16s | gt | max |
|---|---|---|---|---|---|---|---|---|---|---|---|
| pg1119_o3_native_lto.cx7 | 99.861 | 0.139 | 0.006 | ||||||||
| pg1214_o3_native_lto.cx7 | 99.861 | 0.139 | 0.008 | ||||||||
| pg1310_o3_native_lto.cx7 | 99.889 | 0.111 | 0.007 | ||||||||
| pg147_o3_native_lto.cx7 | 99.889 | 0.111 | 0.007 | ||||||||
| pg151_o3_native_lto.cx7 | 99.889 | 0.111 | 0.008 | ||||||||
| pg152_o3_native_lto.cx7 | 99.889 | 0.111 | 0.008 |
Performance metrics for the DBMS listed above. Some are normalized by throughput, others are not. Legend for results is here.
ips	qps	rps	rmbps	wps	wmbps	rpq	rkbpq	wpi	wkbpi	csps	cpups	cspq	cpupq	dbgb1	dbgb2	rss	maxop	p50	p99	tag
100	8063	0	0.0	214.7	6.9	0.000	0.000	2.154	71.302	31059	12.7	3.852	126	8.4	16.4	0.0	0.001	7783	7628	20m.pg1119_o3_native_lto.cx7
100	8831	0	0.0	196.0	7.0	0.000	0.000	1.966	71.480	33985	13.1	3.848	119	8.2	16.1	0.0	0.004	8519	8306	20m.pg1214_o3_native_lto.cx7
100	9103	0	0.0	203.8	5.6	0.000	0.000	2.042	57.343	34999	13.8	3.845	121	8.2	15.7	0.0	0.003	8519	8326	20m.pg1310_o3_native_lto.cx7
100	9024	0	0.0	189.8	5.1	0.000	0.000	1.904	52.210	34678	13.1	3.843	116	8.2	17.9	0.0	0.003	8582	8398	20m.pg147_o3_native_lto.cx7
100	8894	0	0.0	181.3	5.4	0.000	0.000	1.818	55.269	34127	12.9	3.837	116	8.2	18.2	0.0	0.004	8568	8387	20m.pg151_o3_native_lto.cx7
100	8962	0	0.0	180.1	5.4	0.000	0.000	1.805	55.088	34378	12.9	3.836	115	8.2	18.3	0.0	0.002	8590	8414	20m.pg152_o3_native_lto.cx7
q500.1
q500.1: range queries with 500 insert/s per client. Graphs for performance per 1-second interval are here.
Average throughput:
Query response time histogram: each cell has the percentage of responses that take <= the time in the header and max is the max response time in seconds. For max values in the top 25% of the range have a red background and in the bottom 25% of the range have a green background. The red background is not used when the min value is within 80% of the max value.
| dbms | 256us | 1ms | 4ms | 16ms | 64ms | 256ms | 1s | 4s | 16s | gt | max |
|---|---|---|---|---|---|---|---|---|---|---|---|
| pg1119_o3_native_lto.cx7 | 99.914 | 0.086 | nonzero | nonzero | 0.004 | ||||||
| pg1214_o3_native_lto.cx7 | 99.957 | 0.043 | nonzero | nonzero | 0.004 | ||||||
| pg1310_o3_native_lto.cx7 | 99.953 | 0.047 | nonzero | 0.003 | |||||||
| pg147_o3_native_lto.cx7 | 99.969 | 0.031 | nonzero | 0.003 | |||||||
| pg151_o3_native_lto.cx7 | 99.974 | 0.026 | nonzero | 0.003 | |||||||
| pg152_o3_native_lto.cx7 | 99.971 | 0.029 | nonzero | 0.003 |
Insert response time histogram: each cell has the percentage of responses that take <= the time in the header and max is the max response time in seconds. For max values in the top 25% of the range have a red background and in the bottom 25% of the range have a green background. The red background is not used when the min value is within 80% of the max value.
| dbms | 256us | 1ms | 4ms | 16ms | 64ms | 256ms | 1s | 4s | 16s | gt | max |
|---|---|---|---|---|---|---|---|---|---|---|---|
| pg1119_o3_native_lto.cx7 | 99.867 | 0.133 | 0.009 | ||||||||
| pg1214_o3_native_lto.cx7 | 99.894 | 0.106 | 0.009 | ||||||||
| pg1310_o3_native_lto.cx7 | 99.889 | 0.111 | 0.007 | ||||||||
| pg147_o3_native_lto.cx7 | 99.917 | 0.083 | 0.007 | ||||||||
| pg151_o3_native_lto.cx7 | 99.922 | 0.078 | 0.008 | ||||||||
| pg152_o3_native_lto.cx7 | 99.956 | 0.044 | 0.007 |
Performance metrics for the DBMS listed above. Some are normalized by throughput, others are not. Legend for results is here.
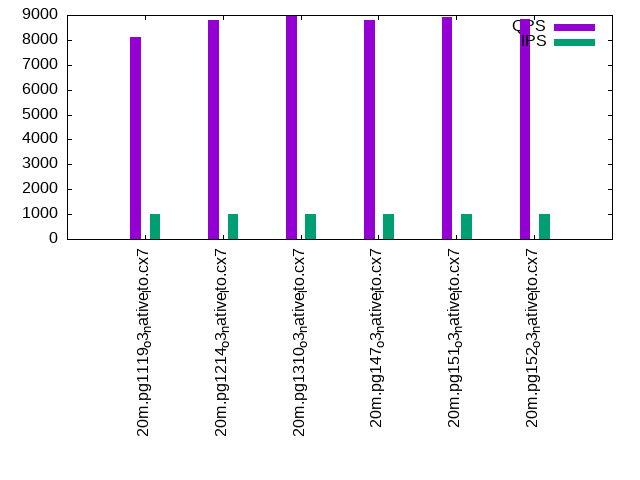
ips	qps	rps	rmbps	wps	wmbps	rpq	rkbpq	wpi	wkbpi	csps	cpups	cspq	cpupq	dbgb1	dbgb2	rss	maxop	p50	p99	tag
499	8109	0	0.0	348.1	12.4	0.000	0.000	0.698	25.445	31327	13.3	3.863	131	8.6	13.6	0.0	0.004	7703	7559	20m.pg1119_o3_native_lto.cx7
499	8866	0	0.0	328.6	12.3	0.000	0.000	0.659	25.231	34241	13.1	3.862	118	8.4	13.3	0.0	0.004	8533	8305	20m.pg1214_o3_native_lto.cx7
499	8991	0	0.0	323.6	12.1	0.000	0.000	0.649	24.943	34723	13.7	3.862	122	8.4	13.3	0.0	0.003	8533	8314	20m.pg1310_o3_native_lto.cx7
499	8738	0	0.0	325.2	11.5	0.000	0.000	0.652	23.617	33700	13.0	3.857	119	8.4	14.5	0.0	0.003	8526	8317	20m.pg147_o3_native_lto.cx7
499	8880	0	0.0	322.1	11.4	0.000	0.000	0.646	23.491	34209	13.1	3.852	118	8.4	14.6	0.0	0.003	8544	8388	20m.pg151_o3_native_lto.cx7
499	8824	0	0.0	322.2	11.4	0.000	0.000	0.646	23.480	33975	13.0	3.850	118	8.4	14.7	0.0	0.003	8485	8278	20m.pg152_o3_native_lto.cx7
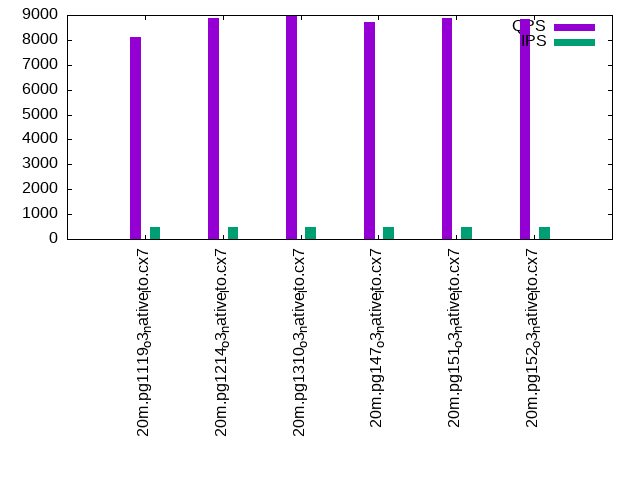
q1000.1
q1000.1: range queries with 1000 insert/s per client. Graphs for performance per 1-second interval are here.
Average throughput:
Query response time histogram: each cell has the percentage of responses that take <= the time in the header and max is the max response time in seconds. For max values in the top 25% of the range have a red background and in the bottom 25% of the range have a green background. The red background is not used when the min value is within 80% of the max value.
| dbms | 256us | 1ms | 4ms | 16ms | 64ms | 256ms | 1s | 4s | 16s | gt | max |
|---|---|---|---|---|---|---|---|---|---|---|---|
| pg1119_o3_native_lto.cx7 | 99.903 | 0.096 | nonzero | 0.003 | |||||||
| pg1214_o3_native_lto.cx7 | 99.948 | 0.052 | nonzero | nonzero | 0.004 | ||||||
| pg1310_o3_native_lto.cx7 | 99.950 | 0.049 | nonzero | nonzero | 0.005 | ||||||
| pg147_o3_native_lto.cx7 | 99.968 | 0.032 | nonzero | 0.004 | |||||||
| pg151_o3_native_lto.cx7 | 99.978 | 0.022 | nonzero | 0.003 | |||||||
| pg152_o3_native_lto.cx7 | 99.967 | 0.032 | nonzero | 0.003 |
Insert response time histogram: each cell has the percentage of responses that take <= the time in the header and max is the max response time in seconds. For max values in the top 25% of the range have a red background and in the bottom 25% of the range have a green background. The red background is not used when the min value is within 80% of the max value.
| dbms | 256us | 1ms | 4ms | 16ms | 64ms | 256ms | 1s | 4s | 16s | gt | max |
|---|---|---|---|---|---|---|---|---|---|---|---|
| pg1119_o3_native_lto.cx7 | 99.944 | 0.056 | 0.008 | ||||||||
| pg1214_o3_native_lto.cx7 | 99.967 | 0.033 | 0.007 | ||||||||
| pg1310_o3_native_lto.cx7 | 99.917 | 0.083 | 0.011 | ||||||||
| pg147_o3_native_lto.cx7 | 99.978 | 0.022 | 0.009 | ||||||||
| pg151_o3_native_lto.cx7 | 99.928 | 0.072 | 0.008 | ||||||||
| pg152_o3_native_lto.cx7 | 99.953 | 0.047 | 0.007 |
Performance metrics for the DBMS listed above. Some are normalized by throughput, others are not. Legend for results is here.
ips	qps	rps	rmbps	wps	wmbps	rpq	rkbpq	wpi	wkbpi	csps	cpups	cspq	cpupq	dbgb1	dbgb2	rss	maxop	p50	p99	tag
998	8120	0	0.0	323.1	17.8	0.000	0.000	0.324	18.229	31515	14.3	3.881	141	9.3	13.7	0.0	0.003	7716	7448	20m.pg1119_o3_native_lto.cx7
998	8808	0	0.0	279.5	17.4	0.000	0.000	0.280	17.892	34148	14.0	3.877	127	9.0	13.4	0.0	0.004	8422	8186	20m.pg1214_o3_native_lto.cx7
998	8944	0	0.0	280.7	17.4	0.000	0.000	0.281	17.836	34665	14.0	3.876	125	9.0	13.4	0.0	0.005	8569	8391	20m.pg1310_o3_native_lto.cx7
998	8782	0	0.0	323.8	16.3	0.000	0.000	0.325	16.768	33986	13.8	3.870	126	9.0	14.5	0.0	0.004	8501	8339	20m.pg147_o3_native_lto.cx7
997	8912	0	0.0	323.3	16.3	0.000	0.000	0.324	16.749	34463	13.6	3.867	122	9.0	14.6	0.0	0.003	8645	8472	20m.pg151_o3_native_lto.cx7
998	8839	0	0.0	323.6	16.3	0.000	0.000	0.324	16.724	34173	13.9	3.866	126	9.0	14.6	0.0	0.003	8485	8301	20m.pg152_o3_native_lto.cx7
l.i0
l.i0: load without secondary indexes
Performance metrics for all DBMS, not just the ones listed above. Some are normalized by throughput, others are not. Legend for results is here.
ips	qps	rps	rmbps	wps	wmbps	rpq	rkbpq	wpi	wkbpi	csps	cpups	cspq	cpupq	dbgb1	dbgb2	rss	maxop	p50	p99	tag
81967	0	0	0.0	96.7	35.0	0.000	0.000	0.001	0.437	9991	22.6	0.122	22	1.9	5.2	0.0	0.003	82682	74353	20m.pg1119_o3_native_lto.cx7
80645	0	0	0.0	93.7	34.1	0.000	0.000	0.001	0.433	9791	22.6	0.121	22	1.9	5.2	0.0	0.004	81022	56601	20m.pg1214_o3_native_lto.cx7
85106	0	0	0.0	99.1	36.1	0.000	0.000	0.001	0.434	10298	22.7	0.121	21	1.9	5.2	0.7	0.004	85235	74731	20m.pg1310_o3_native_lto.cx7
79681	0	0	0.0	93.7	33.9	0.000	0.000	0.001	0.436	9725	22.4	0.122	22	1.9	5.2	0.0	0.003	79887	77213	20m.pg147_o3_native_lto.cx7
85470	0	0	0.0	99.9	36.5	0.000	0.000	0.001	0.437	10360	22.7	0.121	21	1.9	5.2	0.0	0.006	86007	70817	20m.pg151_o3_native_lto.cx7
85470	0	0	0.0	100.2	36.5	0.000	0.000	0.001	0.437	10369	22.8	0.121	21	1.9	5.2	0.0	0.006	86019	73918	20m.pg152_o3_native_lto.cx7
l.x
l.x: create secondary indexes
Performance metrics for all DBMS, not just the ones listed above. Some are normalized by throughput, others are not. Legend for results is here.
ips	qps	rps	rmbps	wps	wmbps	rpq	rkbpq	wpi	wkbpi	csps	cpups	cspq	cpupq	dbgb1	dbgb2	rss	maxop	p50	p99	tag
251250	0	0	0.0	148.4	65.5	0.000	0.000	0.001	0.267	733	12.4	0.003	4	3.7	8.6	0.0	0.004	NA	NA	20m.pg1119_o3_native_lto.cx7
245122	0	0	0.0	127.5	54.8	0.000	0.000	0.001	0.229	759	12.5	0.003	4	3.7	8.6	0.0	0.003	NA	NA	20m.pg1214_o3_native_lto.cx7
248148	0	0	0.0	125.5	56.0	0.000	0.000	0.001	0.231	780	12.5	0.003	4	3.7	8.6	0.0	0.003	NA	NA	20m.pg1310_o3_native_lto.cx7
242169	0	0	0.0	117.7	51.7	0.000	0.000	0.000	0.219	679	12.4	0.003	4	3.7	8.6	0.0	0.003	NA	NA	20m.pg147_o3_native_lto.cx7
261039	0	0	0.0	124.1	54.0	0.000	0.000	0.000	0.212	716	12.4	0.003	4	3.7	8.6	0.0	0.003	NA	NA	20m.pg151_o3_native_lto.cx7
257692	0	0	0.0	129.7	56.9	0.000	0.000	0.001	0.226	747	12.6	0.003	4	3.7	8.6	0.0	0.003	NA	NA	20m.pg152_o3_native_lto.cx7
l.i1
l.i1: continue load after secondary indexes created
Performance metrics for all DBMS, not just the ones listed above. Some are normalized by throughput, others are not. Legend for results is here.
ips	qps	rps	rmbps	wps	wmbps	rpq	rkbpq	wpi	wkbpi	csps	cpups	cspq	cpupq	dbgb1	dbgb2	rss	maxop	p50	p99	tag
30912	0	0	0.0	194.9	52.1	0.000	0.000	0.006	1.725	7774	18.3	0.251	47	8.3	17.7	1.6	0.008	31165	23007	20m.pg1119_o3_native_lto.cx7
30349	0	0	0.0	197.1	50.9	0.000	0.000	0.006	1.717	7655	18.2	0.252	48	8.2	17.5	0.0	0.008	31114	21576	20m.pg1214_o3_native_lto.cx7
30864	0	0	0.0	179.2	52.4	0.000	0.000	0.006	1.738	7775	18.3	0.252	47	8.2	17.6	0.0	0.013	31663	21776	20m.pg1310_o3_native_lto.cx7
30441	0	0	0.0	174.7	51.5	0.000	0.000	0.006	1.733	7753	18.2	0.255	48	8.2	19.5	0.0	0.011	31260	21526	20m.pg147_o3_native_lto.cx7
31056	0	0	0.0	176.5	52.7	0.000	0.000	0.006	1.738	7841	18.2	0.252	47	8.2	19.8	0.2	0.009	31815	21875	20m.pg151_o3_native_lto.cx7
31250	0	0	0.0	177.9	53.2	0.000	0.000	0.006	1.742	7874	18.2	0.252	47	8.2	19.9	0.0	0.008	32077	21875	20m.pg152_o3_native_lto.cx7
q100.1
q100.1: range queries with 100 insert/s per client
Performance metrics for all DBMS, not just the ones listed above. Some are normalized by throughput, others are not. Legend for results is here.
ips	qps	rps	rmbps	wps	wmbps	rpq	rkbpq	wpi	wkbpi	csps	cpups	cspq	cpupq	dbgb1	dbgb2	rss	maxop	p50	p99	tag
100	8063	0	0.0	214.7	6.9	0.000	0.000	2.154	71.302	31059	12.7	3.852	126	8.4	16.4	0.0	0.001	7783	7628	20m.pg1119_o3_native_lto.cx7
100	8831	0	0.0	196.0	7.0	0.000	0.000	1.966	71.480	33985	13.1	3.848	119	8.2	16.1	0.0	0.004	8519	8306	20m.pg1214_o3_native_lto.cx7
100	9103	0	0.0	203.8	5.6	0.000	0.000	2.042	57.343	34999	13.8	3.845	121	8.2	15.7	0.0	0.003	8519	8326	20m.pg1310_o3_native_lto.cx7
100	9024	0	0.0	189.8	5.1	0.000	0.000	1.904	52.210	34678	13.1	3.843	116	8.2	17.9	0.0	0.003	8582	8398	20m.pg147_o3_native_lto.cx7
100	8894	0	0.0	181.3	5.4	0.000	0.000	1.818	55.269	34127	12.9	3.837	116	8.2	18.2	0.0	0.004	8568	8387	20m.pg151_o3_native_lto.cx7
100	8962	0	0.0	180.1	5.4	0.000	0.000	1.805	55.088	34378	12.9	3.836	115	8.2	18.3	0.0	0.002	8590	8414	20m.pg152_o3_native_lto.cx7
q500.1
q500.1: range queries with 500 insert/s per client
Performance metrics for all DBMS, not just the ones listed above. Some are normalized by throughput, others are not. Legend for results is here.
ips	qps	rps	rmbps	wps	wmbps	rpq	rkbpq	wpi	wkbpi	csps	cpups	cspq	cpupq	dbgb1	dbgb2	rss	maxop	p50	p99	tag
499	8109	0	0.0	348.1	12.4	0.000	0.000	0.698	25.445	31327	13.3	3.863	131	8.6	13.6	0.0	0.004	7703	7559	20m.pg1119_o3_native_lto.cx7
499	8866	0	0.0	328.6	12.3	0.000	0.000	0.659	25.231	34241	13.1	3.862	118	8.4	13.3	0.0	0.004	8533	8305	20m.pg1214_o3_native_lto.cx7
499	8991	0	0.0	323.6	12.1	0.000	0.000	0.649	24.943	34723	13.7	3.862	122	8.4	13.3	0.0	0.003	8533	8314	20m.pg1310_o3_native_lto.cx7
499	8738	0	0.0	325.2	11.5	0.000	0.000	0.652	23.617	33700	13.0	3.857	119	8.4	14.5	0.0	0.003	8526	8317	20m.pg147_o3_native_lto.cx7
499	8880	0	0.0	322.1	11.4	0.000	0.000	0.646	23.491	34209	13.1	3.852	118	8.4	14.6	0.0	0.003	8544	8388	20m.pg151_o3_native_lto.cx7
499	8824	0	0.0	322.2	11.4	0.000	0.000	0.646	23.480	33975	13.0	3.850	118	8.4	14.7	0.0	0.003	8485	8278	20m.pg152_o3_native_lto.cx7
q1000.1
q1000.1: range queries with 1000 insert/s per client
Performance metrics for all DBMS, not just the ones listed above. Some are normalized by throughput, others are not. Legend for results is here.
ips	qps	rps	rmbps	wps	wmbps	rpq	rkbpq	wpi	wkbpi	csps	cpups	cspq	cpupq	dbgb1	dbgb2	rss	maxop	p50	p99	tag
998	8120	0	0.0	323.1	17.8	0.000	0.000	0.324	18.229	31515	14.3	3.881	141	9.3	13.7	0.0	0.003	7716	7448	20m.pg1119_o3_native_lto.cx7
998	8808	0	0.0	279.5	17.4	0.000	0.000	0.280	17.892	34148	14.0	3.877	127	9.0	13.4	0.0	0.004	8422	8186	20m.pg1214_o3_native_lto.cx7
998	8944	0	0.0	280.7	17.4	0.000	0.000	0.281	17.836	34665	14.0	3.876	125	9.0	13.4	0.0	0.005	8569	8391	20m.pg1310_o3_native_lto.cx7
998	8782	0	0.0	323.8	16.3	0.000	0.000	0.325	16.768	33986	13.8	3.870	126	9.0	14.5	0.0	0.004	8501	8339	20m.pg147_o3_native_lto.cx7
997	8912	0	0.0	323.3	16.3	0.000	0.000	0.324	16.749	34463	13.6	3.867	122	9.0	14.6	0.0	0.003	8645	8472	20m.pg151_o3_native_lto.cx7
998	8839	0	0.0	323.6	16.3	0.000	0.000	0.324	16.724	34173	13.9	3.866	126	9.0	14.6	0.0	0.003	8485	8301	20m.pg152_o3_native_lto.cx7
l.i0
- l.i0: load without secondary indexes
- Legend for results is here.
- Each entry lists the percentage of responses that fit in that bucket (slower than max time for previous bucket, faster than min time for next bucket).
Insert response time histogram
256us	1ms	4ms	16ms	64ms	256ms	1s	4s	16s	gt	max	tag
0.000	0.000	100.000	0.000	0.000	0.000	0.000	0.000	0.000	0.000	0.003	pg1119_o3_native_lto.cx7
0.000	0.000	100.000	0.000	0.000	0.000	0.000	0.000	0.000	0.000	0.004	pg1214_o3_native_lto.cx7
0.000	0.016	99.984	0.000	0.000	0.000	0.000	0.000	0.000	0.000	0.004	pg1310_o3_native_lto.cx7
0.000	0.000	100.000	0.000	0.000	0.000	0.000	0.000	0.000	0.000	0.003	pg147_o3_native_lto.cx7
0.000	0.060	99.940	0.001	0.000	0.000	0.000	0.000	0.000	0.000	0.006	pg151_o3_native_lto.cx7
0.000	0.070	99.930	0.001	0.000	0.000	0.000	0.000	0.000	0.000	0.006	pg152_o3_native_lto.cx7
l.x
- l.x: create secondary indexes
- Legend for results is here.
- Each entry lists the percentage of responses that fit in that bucket (slower than max time for previous bucket, faster than min time for next bucket).
TODO - determine whether there is data for create index response time
l.i1
- l.i1: continue load after secondary indexes created
- Legend for results is here.
- Each entry lists the percentage of responses that fit in that bucket (slower than max time for previous bucket, faster than min time for next bucket).
Insert response time histogram
256us	1ms	4ms	16ms	64ms	256ms	1s	4s	16s	gt	max	tag
0.000	0.000	99.997	0.003	0.000	0.000	0.000	0.000	0.000	0.000	0.008	pg1119_o3_native_lto.cx7
0.000	0.000	99.998	0.002	0.000	0.000	0.000	0.000	0.000	0.000	0.008	pg1214_o3_native_lto.cx7
0.000	0.000	99.996	0.004	0.000	0.000	0.000	0.000	0.000	0.000	0.013	pg1310_o3_native_lto.cx7
0.000	0.000	99.994	0.006	0.000	0.000	0.000	0.000	0.000	0.000	0.011	pg147_o3_native_lto.cx7
0.000	0.000	99.995	0.005	0.000	0.000	0.000	0.000	0.000	0.000	0.009	pg151_o3_native_lto.cx7
0.000	0.000	99.995	0.006	0.000	0.000	0.000	0.000	0.000	0.000	0.008	pg152_o3_native_lto.cx7
q100.1
- q100.1: range queries with 100 insert/s per client
- Legend for results is here.
- Each entry lists the percentage of responses that fit in that bucket (slower than max time for previous bucket, faster than min time for next bucket).
Query response time histogram
256us	1ms	4ms	16ms	64ms	256ms	1s	4s	16s	gt	max	tag
99.921	0.079	nonzero	0.000	0.000	0.000	0.000	0.000	0.000	0.000	0.001	pg1119_o3_native_lto.cx7
99.947	0.053	nonzero	nonzero	0.000	0.000	0.000	0.000	0.000	0.000	0.004	pg1214_o3_native_lto.cx7
99.956	0.044	nonzero	0.000	0.000	0.000	0.000	0.000	0.000	0.000	0.003	pg1310_o3_native_lto.cx7
99.970	0.030	nonzero	0.000	0.000	0.000	0.000	0.000	0.000	0.000	0.003	pg147_o3_native_lto.cx7
99.968	0.032	nonzero	nonzero	0.000	0.000	0.000	0.000	0.000	0.000	0.004	pg151_o3_native_lto.cx7
99.965	0.034	nonzero	0.000	0.000	0.000	0.000	0.000	0.000	0.000	0.002	pg152_o3_native_lto.cx7
Insert response time histogram
256us	1ms	4ms	16ms	64ms	256ms	1s	4s	16s	gt	max	tag
0.000	0.000	99.861	0.139	0.000	0.000	0.000	0.000	0.000	0.000	0.006	pg1119_o3_native_lto.cx7
0.000	0.000	99.861	0.139	0.000	0.000	0.000	0.000	0.000	0.000	0.008	pg1214_o3_native_lto.cx7
0.000	0.000	99.889	0.111	0.000	0.000	0.000	0.000	0.000	0.000	0.007	pg1310_o3_native_lto.cx7
0.000	0.000	99.889	0.111	0.000	0.000	0.000	0.000	0.000	0.000	0.007	pg147_o3_native_lto.cx7
0.000	0.000	99.889	0.111	0.000	0.000	0.000	0.000	0.000	0.000	0.008	pg151_o3_native_lto.cx7
0.000	0.000	99.889	0.111	0.000	0.000	0.000	0.000	0.000	0.000	0.008	pg152_o3_native_lto.cx7
q500.1
- q500.1: range queries with 500 insert/s per client
- Legend for results is here.
- Each entry lists the percentage of responses that fit in that bucket (slower than max time for previous bucket, faster than min time for next bucket).
Query response time histogram
256us	1ms	4ms	16ms	64ms	256ms	1s	4s	16s	gt	max	tag
99.914	0.086	nonzero	nonzero	0.000	0.000	0.000	0.000	0.000	0.000	0.004	pg1119_o3_native_lto.cx7
99.957	0.043	nonzero	nonzero	0.000	0.000	0.000	0.000	0.000	0.000	0.004	pg1214_o3_native_lto.cx7
99.953	0.047	nonzero	0.000	0.000	0.000	0.000	0.000	0.000	0.000	0.003	pg1310_o3_native_lto.cx7
99.969	0.031	nonzero	0.000	0.000	0.000	0.000	0.000	0.000	0.000	0.003	pg147_o3_native_lto.cx7
99.974	0.026	nonzero	0.000	0.000	0.000	0.000	0.000	0.000	0.000	0.003	pg151_o3_native_lto.cx7
99.971	0.029	nonzero	0.000	0.000	0.000	0.000	0.000	0.000	0.000	0.003	pg152_o3_native_lto.cx7
Insert response time histogram
256us	1ms	4ms	16ms	64ms	256ms	1s	4s	16s	gt	max	tag
0.000	0.000	99.867	0.133	0.000	0.000	0.000	0.000	0.000	0.000	0.009	pg1119_o3_native_lto.cx7
0.000	0.000	99.894	0.106	0.000	0.000	0.000	0.000	0.000	0.000	0.009	pg1214_o3_native_lto.cx7
0.000	0.000	99.889	0.111	0.000	0.000	0.000	0.000	0.000	0.000	0.007	pg1310_o3_native_lto.cx7
0.000	0.000	99.917	0.083	0.000	0.000	0.000	0.000	0.000	0.000	0.007	pg147_o3_native_lto.cx7
0.000	0.000	99.922	0.078	0.000	0.000	0.000	0.000	0.000	0.000	0.008	pg151_o3_native_lto.cx7
0.000	0.000	99.956	0.044	0.000	0.000	0.000	0.000	0.000	0.000	0.007	pg152_o3_native_lto.cx7
q1000.1
- q1000.1: range queries with 1000 insert/s per client
- Legend for results is here.
- Each entry lists the percentage of responses that fit in that bucket (slower than max time for previous bucket, faster than min time for next bucket).
Query response time histogram
256us	1ms	4ms	16ms	64ms	256ms	1s	4s	16s	gt	max	tag
99.903	0.096	nonzero	0.000	0.000	0.000	0.000	0.000	0.000	0.000	0.003	pg1119_o3_native_lto.cx7
99.948	0.052	nonzero	nonzero	0.000	0.000	0.000	0.000	0.000	0.000	0.004	pg1214_o3_native_lto.cx7
99.950	0.049	nonzero	nonzero	0.000	0.000	0.000	0.000	0.000	0.000	0.005	pg1310_o3_native_lto.cx7
99.968	0.032	nonzero	0.000	0.000	0.000	0.000	0.000	0.000	0.000	0.004	pg147_o3_native_lto.cx7
99.978	0.022	nonzero	0.000	0.000	0.000	0.000	0.000	0.000	0.000	0.003	pg151_o3_native_lto.cx7
99.967	0.032	nonzero	0.000	0.000	0.000	0.000	0.000	0.000	0.000	0.003	pg152_o3_native_lto.cx7
Insert response time histogram
256us	1ms	4ms	16ms	64ms	256ms	1s	4s	16s	gt	max	tag
0.000	0.000	99.944	0.056	0.000	0.000	0.000	0.000	0.000	0.000	0.008	pg1119_o3_native_lto.cx7
0.000	0.000	99.967	0.033	0.000	0.000	0.000	0.000	0.000	0.000	0.007	pg1214_o3_native_lto.cx7
0.000	0.000	99.917	0.083	0.000	0.000	0.000	0.000	0.000	0.000	0.011	pg1310_o3_native_lto.cx7
0.000	0.000	99.978	0.022	0.000	0.000	0.000	0.000	0.000	0.000	0.009	pg147_o3_native_lto.cx7
0.000	0.000	99.928	0.072	0.000	0.000	0.000	0.000	0.000	0.000	0.008	pg151_o3_native_lto.cx7
0.000	0.000	99.953	0.047	0.000	0.000	0.000	0.000	0.000	0.000	0.007	pg152_o3_native_lto.cx7