Introduction
This is a report for the insert benchmark with 20M docs and 1 client(s). It is generated by scripts (bash, awk, sed) and Tufte might not be impressed. An overview of the insert benchmark is here and a short update is here. Below, by DBMS, I mean DBMS+version.config. An example is my8020.c10b40 where my means MySQL, 8020 is version 8.0.20 and c10b40 is the name for the configuration file.
The test server has 8 AMD cores, 16G RAM and an NVMe SSD. It is described here as the Beelink. The benchmark was run with 1 client and there were 1 or 2 connections per client (1 for queries, 1 for inserts). It uses 1 table. It loads 20M rows without secondary indexes, creates secondary indexes, loads another 20M rows then does 3 read+write tests for one hour each that do queries as fast as possible with 100, 500 and then 1000 writes/second/client concurrent with the queries. The database is cached by the OS but not by the database. Clients and the DBMS share one server. The per-database configs are in the per-database subdirectories here.
The tested DBMS are:
- pg1119_o3_native_lto.cx7_1g - Postgres 11.19, the cx7_1g config and the build used: -O3 -march=native -mtune=native
- pg1214_o3_native_lto.cx7_1g - Postgres 12.14, the cx7_1g config and the build used: -O3 -march=native -mtune=native
- pg1310_o3_native_lto.cx7_1g - Postgres 13.10, the cx7_1g config and the build used: -O3 -march=native -mtune=native
- pg147_o3_native_lto.cx7_1g - Postgres 14.7, the cx7_1g config and the build used: -O3 -march=native -mtune=native
- pg151_o3_native_lto.cx7_1g - Postgres 15.1, the cx7_1g config and the build used: -O3 -march=native -mtune=native
- pg152_o3_native_lto.cx7_1g - Postgres 15.2, the cx7_1g config and the build used: -O3 -march=native -mtune=native
Contents
- Summary
- l.i0: load without secondary indexes
- l.x: create secondary indexes
- l.i1: continue load after secondary indexes created
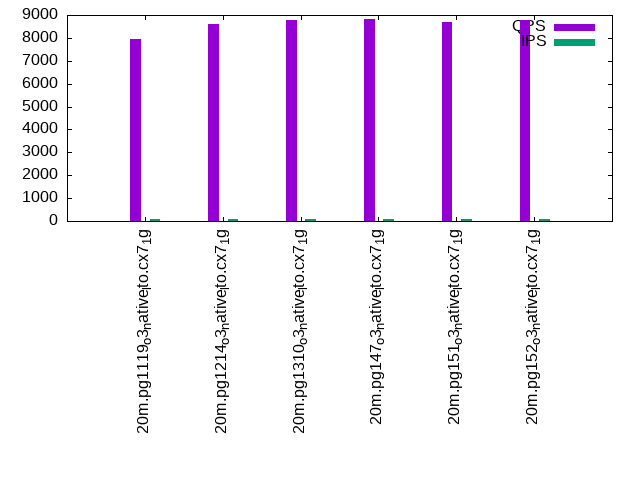
- q100.1: range queries with 100 insert/s per client
- q500.1: range queries with 500 insert/s per client
- q1000.1: range queries with 1000 insert/s per client
Summary
The numbers are inserts/s for l.i0 and l.i1, indexed docs (or rows) /s for l.x and queries/s for q*.2. The values are the average rate over the entire test for inserts (IPS) and queries (QPS). The range of values for IPS and QPS is split into 3 parts: bottom 25%, middle 50%, top 25%. Values in the bottom 25% have a red background, values in the top 25% have a green background and values in the middle have no color. A gray background is used for values that can be ignored because the DBMS did not sustain the target insert rate. Red backgrounds are not used when the minimum value is within 80% of the max value.
| dbms | l.i0 | l.x | l.i1 | q100.1 | q500.1 | q1000.1 |
|---|---|---|---|---|---|---|
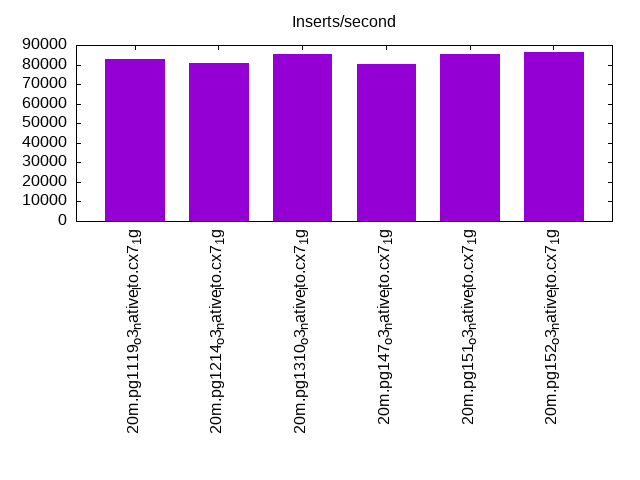
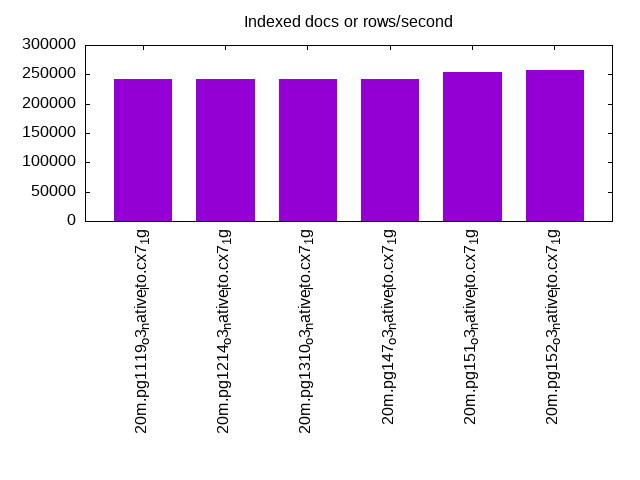
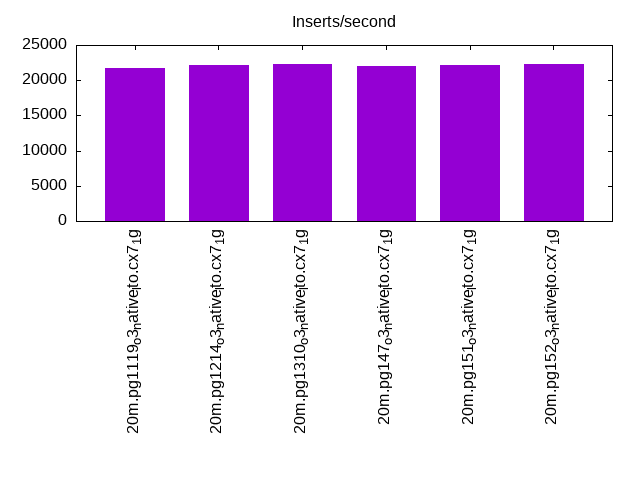
| 20m.pg1119_o3_native_lto.cx7_1g | 82645 | 242169 | 21763 | 7952 | 8069 | 8086 |
| 20m.pg1214_o3_native_lto.cx7_1g | 80972 | 242169 | 22099 | 8620 | 8698 | 8761 |
| 20m.pg1310_o3_native_lto.cx7_1g | 85470 | 242169 | 22371 | 8765 | 8865 | 8927 |
| 20m.pg147_o3_native_lto.cx7_1g | 80321 | 242169 | 22075 | 8804 | 8920 | 8842 |
| 20m.pg151_o3_native_lto.cx7_1g | 85470 | 254430 | 22124 | 8685 | 8835 | 8824 |
| 20m.pg152_o3_native_lto.cx7_1g | 86580 | 257692 | 22296 | 8791 | 8598 | 8802 |
This table has relative throughput, throughput for the DBMS relative to the DBMS in the first line, using the absolute throughput from the previous table.
| dbms | l.i0 | l.x | l.i1 | q100.1 | q500.1 | q1000.1 |
|---|---|---|---|---|---|---|
| 20m.pg1119_o3_native_lto.cx7_1g | 1.00 | 1.00 | 1.00 | 1.00 | 1.00 | 1.00 |
| 20m.pg1214_o3_native_lto.cx7_1g | 0.98 | 1.00 | 1.02 | 1.08 | 1.08 | 1.08 |
| 20m.pg1310_o3_native_lto.cx7_1g | 1.03 | 1.00 | 1.03 | 1.10 | 1.10 | 1.10 |
| 20m.pg147_o3_native_lto.cx7_1g | 0.97 | 1.00 | 1.01 | 1.11 | 1.11 | 1.09 |
| 20m.pg151_o3_native_lto.cx7_1g | 1.03 | 1.05 | 1.02 | 1.09 | 1.09 | 1.09 |
| 20m.pg152_o3_native_lto.cx7_1g | 1.05 | 1.06 | 1.02 | 1.11 | 1.07 | 1.09 |
This lists the average rate of inserts/s for the tests that do inserts concurrent with queries. For such tests the query rate is listed in the table above. The read+write tests are setup so that the insert rate should match the target rate every second. Cells that are not at least 95% of the target have a red background to indicate a failure to satisfy the target.
| dbms | q100.1 | q500.1 | q1000.1 |
|---|---|---|---|
| pg1119_o3_native_lto.cx7_1g | 100 | 499 | 998 |
| pg1214_o3_native_lto.cx7_1g | 100 | 499 | 998 |
| pg1310_o3_native_lto.cx7_1g | 100 | 499 | 998 |
| pg147_o3_native_lto.cx7_1g | 100 | 499 | 998 |
| pg151_o3_native_lto.cx7_1g | 100 | 499 | 998 |
| pg152_o3_native_lto.cx7_1g | 100 | 499 | 998 |
| target | 100 | 500 | 1000 |
l.i0
l.i0: load without secondary indexes. Graphs for performance per 1-second interval are here.
Average throughput:
Insert response time histogram: each cell has the percentage of responses that take <= the time in the header and max is the max response time in seconds. For the max column values in the top 25% of the range have a red background and in the bottom 25% of the range have a green background. The red background is not used when the min value is within 80% of the max value.
| dbms | 256us | 1ms | 4ms | 16ms | 64ms | 256ms | 1s | 4s | 16s | gt | max |
|---|---|---|---|---|---|---|---|---|---|---|---|
| pg1119_o3_native_lto.cx7_1g | 99.999 | 0.001 | 0.004 | ||||||||
| pg1214_o3_native_lto.cx7_1g | 99.999 | 0.001 | 0.004 | ||||||||
| pg1310_o3_native_lto.cx7_1g | 0.015 | 99.984 | 0.001 | 0.004 | |||||||
| pg147_o3_native_lto.cx7_1g | 99.999 | 0.001 | 0.004 | ||||||||
| pg151_o3_native_lto.cx7_1g | 0.003 | 99.995 | 0.002 | 0.006 | |||||||
| pg152_o3_native_lto.cx7_1g | 0.255 | 99.744 | 0.001 | 0.010 |
Performance metrics for the DBMS listed above. Some are normalized by throughput, others are not. Legend for results is here.
ips	qps	rps	rmbps	wps	wmbps	rpq	rkbpq	wpi	wkbpi	csps	cpups	cspq	cpupq	dbgb1	dbgb2	rss	maxop	p50	p99	tag
82645	0	0	0.0	164.3	39.3	0.000	0.000	0.002	0.487	10033	23.7	0.121	23	1.9	5.2	0.0	0.004	83205	72421	20m.pg1119_o3_native_lto.cx7_1g
80972	0	0	0.0	187.9	38.5	0.000	0.000	0.002	0.487	9852	23.7	0.122	23	1.9	5.2	0.0	0.004	81408	70425	20m.pg1214_o3_native_lto.cx7_1g
85470	0	0	0.0	161.5	40.6	0.000	0.000	0.002	0.486	10355	25.3	0.121	24	1.9	5.2	0.0	0.004	85906	76718	20m.pg1310_o3_native_lto.cx7_1g
80321	0	0	0.0	177.8	38.0	0.000	0.000	0.002	0.484	9754	22.8	0.121	23	1.9	5.2	0.0	0.004	80247	70223	20m.pg147_o3_native_lto.cx7_1g
85470	0	0	0.0	165.5	40.4	0.000	0.000	0.002	0.484	10268	23.7	0.120	22	1.9	5.2	0.1	0.006	85406	74421	20m.pg151_o3_native_lto.cx7_1g
86580	0	0	0.0	168.9	41.1	0.000	0.000	0.002	0.486	10454	22.6	0.121	21	1.9	5.2	0.0	0.010	86981	76160	20m.pg152_o3_native_lto.cx7_1g
l.x
l.x: create secondary indexes.
Average throughput:
Performance metrics for the DBMS listed above. Some are normalized by throughput, others are not. Legend for results is here.
ips	qps	rps	rmbps	wps	wmbps	rpq	rkbpq	wpi	wkbpi	csps	cpups	cspq	cpupq	dbgb1	dbgb2	rss	maxop	p50	p99	tag
242169	0	0	0.0	414.7	56.3	0.000	0.000	0.002	0.238	815	12.2	0.003	4	3.7	8.6	0.0	0.003	NA	NA	20m.pg1119_o3_native_lto.cx7_1g
242169	0	0	0.0	449.0	55.2	0.000	0.000	0.002	0.233	760	12.2	0.003	4	3.7	8.6	0.0	0.003	NA	NA	20m.pg1214_o3_native_lto.cx7_1g
242169	0	0	0.0	133.0	52.1	0.000	0.000	0.001	0.220	747	12.2	0.003	4	3.7	8.6	0.0	0.003	NA	NA	20m.pg1310_o3_native_lto.cx7_1g
242169	0	0	0.0	138.0	50.3	0.000	0.000	0.001	0.213	719	12.1	0.003	4	3.7	8.6	0.0	0.003	NA	NA	20m.pg147_o3_native_lto.cx7_1g
254430	0	0	0.0	127.0	50.7	0.000	0.000	0.000	0.204	767	12.4	0.003	4	3.7	8.6	0.0	0.003	NA	NA	20m.pg151_o3_native_lto.cx7_1g
257692	0	0	0.0	152.6	54.0	0.000	0.000	0.001	0.214	738	11.9	0.003	4	3.7	8.6	0.0	0.003	NA	NA	20m.pg152_o3_native_lto.cx7_1g
l.i1
l.i1: continue load after secondary indexes created. Graphs for performance per 1-second interval are here.
Average throughput:
Insert response time histogram: each cell has the percentage of responses that take <= the time in the header and max is the max response time in seconds. For the max column values in the top 25% of the range have a red background and in the bottom 25% of the range have a green background. The red background is not used when the min value is within 80% of the max value.
| dbms | 256us | 1ms | 4ms | 16ms | 64ms | 256ms | 1s | 4s | 16s | gt | max |
|---|---|---|---|---|---|---|---|---|---|---|---|
| pg1119_o3_native_lto.cx7_1g | 99.989 | 0.011 | 0.015 | ||||||||
| pg1214_o3_native_lto.cx7_1g | 99.991 | 0.009 | 0.011 | ||||||||
| pg1310_o3_native_lto.cx7_1g | 99.991 | 0.009 | 0.016 | ||||||||
| pg147_o3_native_lto.cx7_1g | 99.987 | 0.013 | 0.001 | 0.017 | |||||||
| pg151_o3_native_lto.cx7_1g | 99.987 | 0.013 | nonzero | 0.021 | |||||||
| pg152_o3_native_lto.cx7_1g | 99.989 | 0.011 | nonzero | 0.019 |
Performance metrics for the DBMS listed above. Some are normalized by throughput, others are not. Legend for results is here.
ips	qps	rps	rmbps	wps	wmbps	rpq	rkbpq	wpi	wkbpi	csps	cpups	cspq	cpupq	dbgb1	dbgb2	rss	maxop	p50	p99	tag
21763	0	15	0.2	22888.8	268.2	0.001	0.008	1.052	12.617	6993	20.5	0.321	75	8.3	16.3	0.0	0.015	21775	19129	20m.pg1119_o3_native_lto.cx7_1g
22099	0	18	0.2	23108.1	271.3	0.001	0.010	1.046	12.572	7098	20.5	0.321	74	8.2	16.1	0.0	0.011	22336	17531	20m.pg1214_o3_native_lto.cx7_1g
22371	0	16	0.2	23138.9	274.3	0.001	0.008	1.034	12.555	7208	20.7	0.322	74	8.2	16.0	0.0	0.016	22584	17696	20m.pg1310_o3_native_lto.cx7_1g
22075	0	71	0.5	22897.8	273.4	0.003	0.023	1.037	12.682	7413	20.1	0.336	73	8.2	17.5	0.0	0.017	22374	17598	20m.pg147_o3_native_lto.cx7_1g
22124	0	73	0.5	23182.6	274.3	0.003	0.024	1.048	12.694	7158	20.0	0.324	72	8.2	17.5	0.0	0.021	22425	17530	20m.pg151_o3_native_lto.cx7_1g
22296	0	70	0.5	23146.9	277.8	0.003	0.022	1.038	12.757	7271	20.1	0.326	72	8.2	18.3	0.0	0.019	22575	17679	20m.pg152_o3_native_lto.cx7_1g
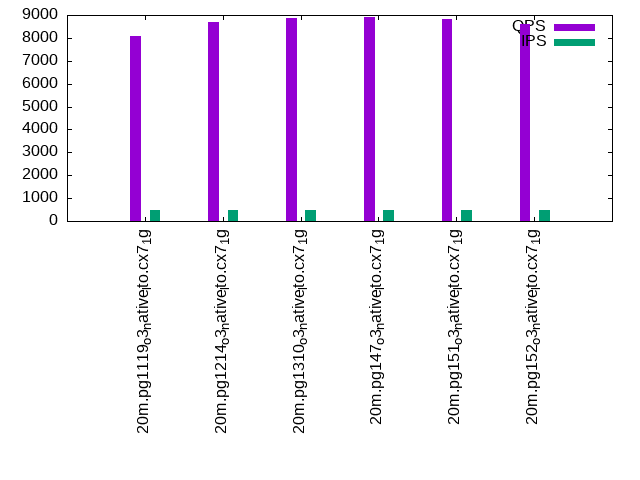
q100.1
q100.1: range queries with 100 insert/s per client. Graphs for performance per 1-second interval are here.
Average throughput:
Query response time histogram: each cell has the percentage of responses that take <= the time in the header and max is the max response time in seconds. For max values in the top 25% of the range have a red background and in the bottom 25% of the range have a green background. The red background is not used when the min value is within 80% of the max value.
| dbms | 256us | 1ms | 4ms | 16ms | 64ms | 256ms | 1s | 4s | 16s | gt | max |
|---|---|---|---|---|---|---|---|---|---|---|---|
| pg1119_o3_native_lto.cx7_1g | 99.931 | 0.068 | 0.001 | nonzero | 0.006 | ||||||
| pg1214_o3_native_lto.cx7_1g | 99.965 | 0.034 | 0.001 | nonzero | 0.006 | ||||||
| pg1310_o3_native_lto.cx7_1g | 99.972 | 0.028 | nonzero | nonzero | 0.010 | ||||||
| pg147_o3_native_lto.cx7_1g | 99.947 | 0.052 | 0.001 | nonzero | 0.010 | ||||||
| pg151_o3_native_lto.cx7_1g | 99.945 | 0.054 | 0.001 | nonzero | 0.010 | ||||||
| pg152_o3_native_lto.cx7_1g | 99.948 | 0.051 | 0.001 | nonzero | 0.010 |
Insert response time histogram: each cell has the percentage of responses that take <= the time in the header and max is the max response time in seconds. For max values in the top 25% of the range have a red background and in the bottom 25% of the range have a green background. The red background is not used when the min value is within 80% of the max value.
| dbms | 256us | 1ms | 4ms | 16ms | 64ms | 256ms | 1s | 4s | 16s | gt | max |
|---|---|---|---|---|---|---|---|---|---|---|---|
| pg1119_o3_native_lto.cx7_1g | 98.944 | 1.056 | 0.012 | ||||||||
| pg1214_o3_native_lto.cx7_1g | 99.583 | 0.417 | 0.012 | ||||||||
| pg1310_o3_native_lto.cx7_1g | 99.944 | 0.056 | 0.005 | ||||||||
| pg147_o3_native_lto.cx7_1g | 99.806 | 0.194 | 0.012 | ||||||||
| pg151_o3_native_lto.cx7_1g | 99.611 | 0.389 | 0.012 | ||||||||
| pg152_o3_native_lto.cx7_1g | 99.889 | 0.111 | 0.012 |
Performance metrics for the DBMS listed above. Some are normalized by throughput, others are not. Legend for results is here.
ips	qps	rps	rmbps	wps	wmbps	rpq	rkbpq	wpi	wkbpi	csps	cpups	cspq	cpupq	dbgb1	dbgb2	rss	maxop	p50	p99	tag
100	7952	3	0.0	336.5	4.2	0.000	0.005	3.371	43.313	30661	13.6	3.856	137	8.3	15.2	0.0	0.006	7701	7495	20m.pg1119_o3_native_lto.cx7_1g
100	8620	0	0.0	335.9	4.2	0.000	0.000	3.369	43.506	33214	13.3	3.853	123	8.2	15.1	0.0	0.006	8358	8167	20m.pg1214_o3_native_lto.cx7_1g
100	8765	0	0.0	359.8	4.7	0.000	0.000	3.609	47.946	33764	13.3	3.852	121	8.2	13.9	0.0	0.010	8486	8255	20m.pg1310_o3_native_lto.cx7_1g
100	8804	1	0.0	374.9	4.5	0.000	0.001	3.757	46.488	33814	13.2	3.841	120	8.2	15.9	0.0	0.010	8566	8278	20m.pg147_o3_native_lto.cx7_1g
100	8685	2	0.0	357.5	4.5	0.000	0.001	3.582	45.753	33326	13.3	3.837	123	8.2	15.8	0.0	0.010	8454	8295	20m.pg151_o3_native_lto.cx7_1g
100	8791	2	0.0	402.4	5.1	0.000	0.001	4.036	52.224	33750	13.1	3.839	119	8.2	16.4	0.0	0.010	8517	8389	20m.pg152_o3_native_lto.cx7_1g
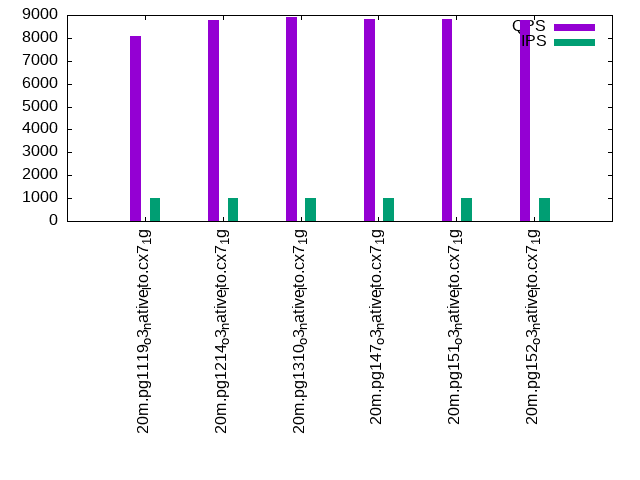
q500.1
q500.1: range queries with 500 insert/s per client. Graphs for performance per 1-second interval are here.
Average throughput:
Query response time histogram: each cell has the percentage of responses that take <= the time in the header and max is the max response time in seconds. For max values in the top 25% of the range have a red background and in the bottom 25% of the range have a green background. The red background is not used when the min value is within 80% of the max value.
| dbms | 256us | 1ms | 4ms | 16ms | 64ms | 256ms | 1s | 4s | 16s | gt | max |
|---|---|---|---|---|---|---|---|---|---|---|---|
| pg1119_o3_native_lto.cx7_1g | 99.946 | 0.054 | nonzero | 0.003 | |||||||
| pg1214_o3_native_lto.cx7_1g | 99.944 | 0.056 | 0.001 | nonzero | 0.006 | ||||||
| pg1310_o3_native_lto.cx7_1g | 99.967 | 0.033 | nonzero | 0.003 | |||||||
| pg147_o3_native_lto.cx7_1g | 99.971 | 0.029 | nonzero | nonzero | 0.005 | ||||||
| pg151_o3_native_lto.cx7_1g | 99.970 | 0.030 | nonzero | nonzero | 0.005 | ||||||
| pg152_o3_native_lto.cx7_1g | 99.972 | 0.028 | nonzero | nonzero | 0.004 |
Insert response time histogram: each cell has the percentage of responses that take <= the time in the header and max is the max response time in seconds. For max values in the top 25% of the range have a red background and in the bottom 25% of the range have a green background. The red background is not used when the min value is within 80% of the max value.
| dbms | 256us | 1ms | 4ms | 16ms | 64ms | 256ms | 1s | 4s | 16s | gt | max |
|---|---|---|---|---|---|---|---|---|---|---|---|
| pg1119_o3_native_lto.cx7_1g | 99.567 | 0.433 | 0.015 | ||||||||
| pg1214_o3_native_lto.cx7_1g | 99.794 | 0.206 | 0.012 | ||||||||
| pg1310_o3_native_lto.cx7_1g | 99.844 | 0.156 | 0.012 | ||||||||
| pg147_o3_native_lto.cx7_1g | 99.833 | 0.167 | 0.012 | ||||||||
| pg151_o3_native_lto.cx7_1g | 99.733 | 0.267 | 0.012 | ||||||||
| pg152_o3_native_lto.cx7_1g | 99.783 | 0.217 | 0.012 |
Performance metrics for the DBMS listed above. Some are normalized by throughput, others are not. Legend for results is here.
ips	qps	rps	rmbps	wps	wmbps	rpq	rkbpq	wpi	wkbpi	csps	cpups	cspq	cpupq	dbgb1	dbgb2	rss	maxop	p50	p99	tag
499	8069	0	0.0	1366.6	16.9	0.000	0.000	2.740	34.621	31233	14.0	3.871	139	8.6	13.3	0.0	0.003	7719	7607	20m.pg1119_o3_native_lto.cx7_1g
499	8698	0	0.0	1355.8	16.8	0.000	0.000	2.717	34.397	33850	14.6	3.892	134	8.4	13.1	0.0	0.006	8326	8135	20m.pg1214_o3_native_lto.cx7_1g
499	8865	0	0.0	1371.7	16.8	0.000	0.000	2.748	34.416	34242	14.3	3.863	129	8.4	12.6	0.0	0.003	8550	8421	20m.pg1310_o3_native_lto.cx7_1g
499	8920	10	0.1	1370.5	16.8	0.001	0.008	2.748	34.510	34396	13.9	3.856	125	8.4	13.9	0.0	0.005	8550	8420	20m.pg147_o3_native_lto.cx7_1g
499	8835	10	0.1	1369.8	16.8	0.001	0.009	2.745	34.432	34014	13.8	3.850	125	8.4	13.7	0.0	0.005	8502	8406	20m.pg151_o3_native_lto.cx7_1g
499	8598	10	0.1	1367.0	16.7	0.001	0.009	2.740	34.343	33131	13.9	3.853	129	8.4	13.9	0.0	0.004	8294	8213	20m.pg152_o3_native_lto.cx7_1g
q1000.1
q1000.1: range queries with 1000 insert/s per client. Graphs for performance per 1-second interval are here.
Average throughput:
Query response time histogram: each cell has the percentage of responses that take <= the time in the header and max is the max response time in seconds. For max values in the top 25% of the range have a red background and in the bottom 25% of the range have a green background. The red background is not used when the min value is within 80% of the max value.
| dbms | 256us | 1ms | 4ms | 16ms | 64ms | 256ms | 1s | 4s | 16s | gt | max |
|---|---|---|---|---|---|---|---|---|---|---|---|
| pg1119_o3_native_lto.cx7_1g | 99.944 | 0.056 | nonzero | 0.003 | |||||||
| pg1214_o3_native_lto.cx7_1g | 99.957 | 0.043 | nonzero | nonzero | 0.010 | ||||||
| pg1310_o3_native_lto.cx7_1g | 99.962 | 0.037 | nonzero | nonzero | 0.007 | ||||||
| pg147_o3_native_lto.cx7_1g | 99.972 | 0.028 | nonzero | 0.003 | |||||||
| pg151_o3_native_lto.cx7_1g | 99.973 | 0.027 | nonzero | nonzero | 0.006 | ||||||
| pg152_o3_native_lto.cx7_1g | 99.973 | 0.027 | nonzero | nonzero | 0.010 |
Insert response time histogram: each cell has the percentage of responses that take <= the time in the header and max is the max response time in seconds. For max values in the top 25% of the range have a red background and in the bottom 25% of the range have a green background. The red background is not used when the min value is within 80% of the max value.
| dbms | 256us | 1ms | 4ms | 16ms | 64ms | 256ms | 1s | 4s | 16s | gt | max |
|---|---|---|---|---|---|---|---|---|---|---|---|
| pg1119_o3_native_lto.cx7_1g | 99.881 | 0.119 | 0.012 | ||||||||
| pg1214_o3_native_lto.cx7_1g | 99.842 | 0.158 | 0.005 | ||||||||
| pg1310_o3_native_lto.cx7_1g | 99.678 | 0.322 | 0.015 | ||||||||
| pg147_o3_native_lto.cx7_1g | 99.692 | 0.308 | 0.012 | ||||||||
| pg151_o3_native_lto.cx7_1g | 99.486 | 0.514 | 0.012 | ||||||||
| pg152_o3_native_lto.cx7_1g | 99.483 | 0.517 | 0.012 |
Performance metrics for the DBMS listed above. Some are normalized by throughput, others are not. Legend for results is here.
ips	qps	rps	rmbps	wps	wmbps	rpq	rkbpq	wpi	wkbpi	csps	cpups	cspq	cpupq	dbgb1	dbgb2	rss	maxop	p50	p99	tag
998	8086	0	0.0	2660.2	29.3	0.000	0.000	2.665	30.032	31464	14.9	3.891	147	9.3	13.6	0.0	0.003	7671	7479	20m.pg1119_o3_native_lto.cx7_1g
998	8761	0	0.0	2635.9	29.1	0.000	0.000	2.640	29.873	34040	15.3	3.885	140	9.0	13.3	0.0	0.010	8342	8197	20m.pg1214_o3_native_lto.cx7_1g
998	8927	5	0.1	2665.4	29.7	0.001	0.006	2.670	30.502	34687	15.5	3.886	139	9.0	13.1	0.0	0.007	8502	8363	20m.pg1310_o3_native_lto.cx7_1g
998	8842	1	0.0	2660.4	29.3	0.000	0.001	2.667	30.045	34297	14.2	3.879	128	9.0	14.2	0.0	0.003	8502	8373	20m.pg147_o3_native_lto.cx7_1g
998	8824	3	0.0	2663.8	29.3	0.000	0.002	2.668	30.041	34155	14.3	3.871	130	9.0	14.1	0.0	0.006	8518	8357	20m.pg151_o3_native_lto.cx7_1g
998	8802	3	0.0	2659.5	29.2	0.000	0.002	2.664	29.977	34078	14.2	3.872	129	9.0	14.2	0.0	0.010	8422	8309	20m.pg152_o3_native_lto.cx7_1g
l.i0
l.i0: load without secondary indexes
Performance metrics for all DBMS, not just the ones listed above. Some are normalized by throughput, others are not. Legend for results is here.
ips	qps	rps	rmbps	wps	wmbps	rpq	rkbpq	wpi	wkbpi	csps	cpups	cspq	cpupq	dbgb1	dbgb2	rss	maxop	p50	p99	tag
82645	0	0	0.0	164.3	39.3	0.000	0.000	0.002	0.487	10033	23.7	0.121	23	1.9	5.2	0.0	0.004	83205	72421	20m.pg1119_o3_native_lto.cx7_1g
80972	0	0	0.0	187.9	38.5	0.000	0.000	0.002	0.487	9852	23.7	0.122	23	1.9	5.2	0.0	0.004	81408	70425	20m.pg1214_o3_native_lto.cx7_1g
85470	0	0	0.0	161.5	40.6	0.000	0.000	0.002	0.486	10355	25.3	0.121	24	1.9	5.2	0.0	0.004	85906	76718	20m.pg1310_o3_native_lto.cx7_1g
80321	0	0	0.0	177.8	38.0	0.000	0.000	0.002	0.484	9754	22.8	0.121	23	1.9	5.2	0.0	0.004	80247	70223	20m.pg147_o3_native_lto.cx7_1g
85470	0	0	0.0	165.5	40.4	0.000	0.000	0.002	0.484	10268	23.7	0.120	22	1.9	5.2	0.1	0.006	85406	74421	20m.pg151_o3_native_lto.cx7_1g
86580	0	0	0.0	168.9	41.1	0.000	0.000	0.002	0.486	10454	22.6	0.121	21	1.9	5.2	0.0	0.010	86981	76160	20m.pg152_o3_native_lto.cx7_1g
l.x
l.x: create secondary indexes
Performance metrics for all DBMS, not just the ones listed above. Some are normalized by throughput, others are not. Legend for results is here.
ips	qps	rps	rmbps	wps	wmbps	rpq	rkbpq	wpi	wkbpi	csps	cpups	cspq	cpupq	dbgb1	dbgb2	rss	maxop	p50	p99	tag
242169	0	0	0.0	414.7	56.3	0.000	0.000	0.002	0.238	815	12.2	0.003	4	3.7	8.6	0.0	0.003	NA	NA	20m.pg1119_o3_native_lto.cx7_1g
242169	0	0	0.0	449.0	55.2	0.000	0.000	0.002	0.233	760	12.2	0.003	4	3.7	8.6	0.0	0.003	NA	NA	20m.pg1214_o3_native_lto.cx7_1g
242169	0	0	0.0	133.0	52.1	0.000	0.000	0.001	0.220	747	12.2	0.003	4	3.7	8.6	0.0	0.003	NA	NA	20m.pg1310_o3_native_lto.cx7_1g
242169	0	0	0.0	138.0	50.3	0.000	0.000	0.001	0.213	719	12.1	0.003	4	3.7	8.6	0.0	0.003	NA	NA	20m.pg147_o3_native_lto.cx7_1g
254430	0	0	0.0	127.0	50.7	0.000	0.000	0.000	0.204	767	12.4	0.003	4	3.7	8.6	0.0	0.003	NA	NA	20m.pg151_o3_native_lto.cx7_1g
257692	0	0	0.0	152.6	54.0	0.000	0.000	0.001	0.214	738	11.9	0.003	4	3.7	8.6	0.0	0.003	NA	NA	20m.pg152_o3_native_lto.cx7_1g
l.i1
l.i1: continue load after secondary indexes created
Performance metrics for all DBMS, not just the ones listed above. Some are normalized by throughput, others are not. Legend for results is here.
ips	qps	rps	rmbps	wps	wmbps	rpq	rkbpq	wpi	wkbpi	csps	cpups	cspq	cpupq	dbgb1	dbgb2	rss	maxop	p50	p99	tag
21763	0	15	0.2	22888.8	268.2	0.001	0.008	1.052	12.617	6993	20.5	0.321	75	8.3	16.3	0.0	0.015	21775	19129	20m.pg1119_o3_native_lto.cx7_1g
22099	0	18	0.2	23108.1	271.3	0.001	0.010	1.046	12.572	7098	20.5	0.321	74	8.2	16.1	0.0	0.011	22336	17531	20m.pg1214_o3_native_lto.cx7_1g
22371	0	16	0.2	23138.9	274.3	0.001	0.008	1.034	12.555	7208	20.7	0.322	74	8.2	16.0	0.0	0.016	22584	17696	20m.pg1310_o3_native_lto.cx7_1g
22075	0	71	0.5	22897.8	273.4	0.003	0.023	1.037	12.682	7413	20.1	0.336	73	8.2	17.5	0.0	0.017	22374	17598	20m.pg147_o3_native_lto.cx7_1g
22124	0	73	0.5	23182.6	274.3	0.003	0.024	1.048	12.694	7158	20.0	0.324	72	8.2	17.5	0.0	0.021	22425	17530	20m.pg151_o3_native_lto.cx7_1g
22296	0	70	0.5	23146.9	277.8	0.003	0.022	1.038	12.757	7271	20.1	0.326	72	8.2	18.3	0.0	0.019	22575	17679	20m.pg152_o3_native_lto.cx7_1g
q100.1
q100.1: range queries with 100 insert/s per client
Performance metrics for all DBMS, not just the ones listed above. Some are normalized by throughput, others are not. Legend for results is here.
ips	qps	rps	rmbps	wps	wmbps	rpq	rkbpq	wpi	wkbpi	csps	cpups	cspq	cpupq	dbgb1	dbgb2	rss	maxop	p50	p99	tag
100	7952	3	0.0	336.5	4.2	0.000	0.005	3.371	43.313	30661	13.6	3.856	137	8.3	15.2	0.0	0.006	7701	7495	20m.pg1119_o3_native_lto.cx7_1g
100	8620	0	0.0	335.9	4.2	0.000	0.000	3.369	43.506	33214	13.3	3.853	123	8.2	15.1	0.0	0.006	8358	8167	20m.pg1214_o3_native_lto.cx7_1g
100	8765	0	0.0	359.8	4.7	0.000	0.000	3.609	47.946	33764	13.3	3.852	121	8.2	13.9	0.0	0.010	8486	8255	20m.pg1310_o3_native_lto.cx7_1g
100	8804	1	0.0	374.9	4.5	0.000	0.001	3.757	46.488	33814	13.2	3.841	120	8.2	15.9	0.0	0.010	8566	8278	20m.pg147_o3_native_lto.cx7_1g
100	8685	2	0.0	357.5	4.5	0.000	0.001	3.582	45.753	33326	13.3	3.837	123	8.2	15.8	0.0	0.010	8454	8295	20m.pg151_o3_native_lto.cx7_1g
100	8791	2	0.0	402.4	5.1	0.000	0.001	4.036	52.224	33750	13.1	3.839	119	8.2	16.4	0.0	0.010	8517	8389	20m.pg152_o3_native_lto.cx7_1g
q500.1
q500.1: range queries with 500 insert/s per client
Performance metrics for all DBMS, not just the ones listed above. Some are normalized by throughput, others are not. Legend for results is here.
ips	qps	rps	rmbps	wps	wmbps	rpq	rkbpq	wpi	wkbpi	csps	cpups	cspq	cpupq	dbgb1	dbgb2	rss	maxop	p50	p99	tag
499	8069	0	0.0	1366.6	16.9	0.000	0.000	2.740	34.621	31233	14.0	3.871	139	8.6	13.3	0.0	0.003	7719	7607	20m.pg1119_o3_native_lto.cx7_1g
499	8698	0	0.0	1355.8	16.8	0.000	0.000	2.717	34.397	33850	14.6	3.892	134	8.4	13.1	0.0	0.006	8326	8135	20m.pg1214_o3_native_lto.cx7_1g
499	8865	0	0.0	1371.7	16.8	0.000	0.000	2.748	34.416	34242	14.3	3.863	129	8.4	12.6	0.0	0.003	8550	8421	20m.pg1310_o3_native_lto.cx7_1g
499	8920	10	0.1	1370.5	16.8	0.001	0.008	2.748	34.510	34396	13.9	3.856	125	8.4	13.9	0.0	0.005	8550	8420	20m.pg147_o3_native_lto.cx7_1g
499	8835	10	0.1	1369.8	16.8	0.001	0.009	2.745	34.432	34014	13.8	3.850	125	8.4	13.7	0.0	0.005	8502	8406	20m.pg151_o3_native_lto.cx7_1g
499	8598	10	0.1	1367.0	16.7	0.001	0.009	2.740	34.343	33131	13.9	3.853	129	8.4	13.9	0.0	0.004	8294	8213	20m.pg152_o3_native_lto.cx7_1g
q1000.1
q1000.1: range queries with 1000 insert/s per client
Performance metrics for all DBMS, not just the ones listed above. Some are normalized by throughput, others are not. Legend for results is here.
ips	qps	rps	rmbps	wps	wmbps	rpq	rkbpq	wpi	wkbpi	csps	cpups	cspq	cpupq	dbgb1	dbgb2	rss	maxop	p50	p99	tag
998	8086	0	0.0	2660.2	29.3	0.000	0.000	2.665	30.032	31464	14.9	3.891	147	9.3	13.6	0.0	0.003	7671	7479	20m.pg1119_o3_native_lto.cx7_1g
998	8761	0	0.0	2635.9	29.1	0.000	0.000	2.640	29.873	34040	15.3	3.885	140	9.0	13.3	0.0	0.010	8342	8197	20m.pg1214_o3_native_lto.cx7_1g
998	8927	5	0.1	2665.4	29.7	0.001	0.006	2.670	30.502	34687	15.5	3.886	139	9.0	13.1	0.0	0.007	8502	8363	20m.pg1310_o3_native_lto.cx7_1g
998	8842	1	0.0	2660.4	29.3	0.000	0.001	2.667	30.045	34297	14.2	3.879	128	9.0	14.2	0.0	0.003	8502	8373	20m.pg147_o3_native_lto.cx7_1g
998	8824	3	0.0	2663.8	29.3	0.000	0.002	2.668	30.041	34155	14.3	3.871	130	9.0	14.1	0.0	0.006	8518	8357	20m.pg151_o3_native_lto.cx7_1g
998	8802	3	0.0	2659.5	29.2	0.000	0.002	2.664	29.977	34078	14.2	3.872	129	9.0	14.2	0.0	0.010	8422	8309	20m.pg152_o3_native_lto.cx7_1g
l.i0
- l.i0: load without secondary indexes
- Legend for results is here.
- Each entry lists the percentage of responses that fit in that bucket (slower than max time for previous bucket, faster than min time for next bucket).
Insert response time histogram
256us	1ms	4ms	16ms	64ms	256ms	1s	4s	16s	gt	max	tag
0.000	0.000	99.999	0.001	0.000	0.000	0.000	0.000	0.000	0.000	0.004	pg1119_o3_native_lto.cx7_1g
0.000	0.000	99.999	0.001	0.000	0.000	0.000	0.000	0.000	0.000	0.004	pg1214_o3_native_lto.cx7_1g
0.000	0.015	99.984	0.001	0.000	0.000	0.000	0.000	0.000	0.000	0.004	pg1310_o3_native_lto.cx7_1g
0.000	0.000	99.999	0.001	0.000	0.000	0.000	0.000	0.000	0.000	0.004	pg147_o3_native_lto.cx7_1g
0.000	0.003	99.995	0.002	0.000	0.000	0.000	0.000	0.000	0.000	0.006	pg151_o3_native_lto.cx7_1g
0.000	0.255	99.744	0.001	0.000	0.000	0.000	0.000	0.000	0.000	0.010	pg152_o3_native_lto.cx7_1g
l.x
- l.x: create secondary indexes
- Legend for results is here.
- Each entry lists the percentage of responses that fit in that bucket (slower than max time for previous bucket, faster than min time for next bucket).
TODO - determine whether there is data for create index response time
l.i1
- l.i1: continue load after secondary indexes created
- Legend for results is here.
- Each entry lists the percentage of responses that fit in that bucket (slower than max time for previous bucket, faster than min time for next bucket).
Insert response time histogram
256us	1ms	4ms	16ms	64ms	256ms	1s	4s	16s	gt	max	tag
0.000	0.000	99.989	0.011	0.000	0.000	0.000	0.000	0.000	0.000	0.015	pg1119_o3_native_lto.cx7_1g
0.000	0.000	99.991	0.009	0.000	0.000	0.000	0.000	0.000	0.000	0.011	pg1214_o3_native_lto.cx7_1g
0.000	0.000	99.991	0.009	0.000	0.000	0.000	0.000	0.000	0.000	0.016	pg1310_o3_native_lto.cx7_1g
0.000	0.000	99.987	0.013	0.001	0.000	0.000	0.000	0.000	0.000	0.017	pg147_o3_native_lto.cx7_1g
0.000	0.000	99.987	0.013	nonzero	0.000	0.000	0.000	0.000	0.000	0.021	pg151_o3_native_lto.cx7_1g
0.000	0.000	99.989	0.011	nonzero	0.000	0.000	0.000	0.000	0.000	0.019	pg152_o3_native_lto.cx7_1g
q100.1
- q100.1: range queries with 100 insert/s per client
- Legend for results is here.
- Each entry lists the percentage of responses that fit in that bucket (slower than max time for previous bucket, faster than min time for next bucket).
Query response time histogram
256us	1ms	4ms	16ms	64ms	256ms	1s	4s	16s	gt	max	tag
99.931	0.068	0.001	nonzero	0.000	0.000	0.000	0.000	0.000	0.000	0.006	pg1119_o3_native_lto.cx7_1g
99.965	0.034	0.001	nonzero	0.000	0.000	0.000	0.000	0.000	0.000	0.006	pg1214_o3_native_lto.cx7_1g
99.972	0.028	nonzero	nonzero	0.000	0.000	0.000	0.000	0.000	0.000	0.010	pg1310_o3_native_lto.cx7_1g
99.947	0.052	0.001	nonzero	0.000	0.000	0.000	0.000	0.000	0.000	0.010	pg147_o3_native_lto.cx7_1g
99.945	0.054	0.001	nonzero	0.000	0.000	0.000	0.000	0.000	0.000	0.010	pg151_o3_native_lto.cx7_1g
99.948	0.051	0.001	nonzero	0.000	0.000	0.000	0.000	0.000	0.000	0.010	pg152_o3_native_lto.cx7_1g
Insert response time histogram
256us	1ms	4ms	16ms	64ms	256ms	1s	4s	16s	gt	max	tag
0.000	0.000	98.944	1.056	0.000	0.000	0.000	0.000	0.000	0.000	0.012	pg1119_o3_native_lto.cx7_1g
0.000	0.000	99.583	0.417	0.000	0.000	0.000	0.000	0.000	0.000	0.012	pg1214_o3_native_lto.cx7_1g
0.000	0.000	99.944	0.056	0.000	0.000	0.000	0.000	0.000	0.000	0.005	pg1310_o3_native_lto.cx7_1g
0.000	0.000	99.806	0.194	0.000	0.000	0.000	0.000	0.000	0.000	0.012	pg147_o3_native_lto.cx7_1g
0.000	0.000	99.611	0.389	0.000	0.000	0.000	0.000	0.000	0.000	0.012	pg151_o3_native_lto.cx7_1g
0.000	0.000	99.889	0.111	0.000	0.000	0.000	0.000	0.000	0.000	0.012	pg152_o3_native_lto.cx7_1g
q500.1
- q500.1: range queries with 500 insert/s per client
- Legend for results is here.
- Each entry lists the percentage of responses that fit in that bucket (slower than max time for previous bucket, faster than min time for next bucket).
Query response time histogram
256us	1ms	4ms	16ms	64ms	256ms	1s	4s	16s	gt	max	tag
99.946	0.054	nonzero	0.000	0.000	0.000	0.000	0.000	0.000	0.000	0.003	pg1119_o3_native_lto.cx7_1g
99.944	0.056	0.001	nonzero	0.000	0.000	0.000	0.000	0.000	0.000	0.006	pg1214_o3_native_lto.cx7_1g
99.967	0.033	nonzero	0.000	0.000	0.000	0.000	0.000	0.000	0.000	0.003	pg1310_o3_native_lto.cx7_1g
99.971	0.029	nonzero	nonzero	0.000	0.000	0.000	0.000	0.000	0.000	0.005	pg147_o3_native_lto.cx7_1g
99.970	0.030	nonzero	nonzero	0.000	0.000	0.000	0.000	0.000	0.000	0.005	pg151_o3_native_lto.cx7_1g
99.972	0.028	nonzero	nonzero	0.000	0.000	0.000	0.000	0.000	0.000	0.004	pg152_o3_native_lto.cx7_1g
Insert response time histogram
256us	1ms	4ms	16ms	64ms	256ms	1s	4s	16s	gt	max	tag
0.000	0.000	99.567	0.433	0.000	0.000	0.000	0.000	0.000	0.000	0.015	pg1119_o3_native_lto.cx7_1g
0.000	0.000	99.794	0.206	0.000	0.000	0.000	0.000	0.000	0.000	0.012	pg1214_o3_native_lto.cx7_1g
0.000	0.000	99.844	0.156	0.000	0.000	0.000	0.000	0.000	0.000	0.012	pg1310_o3_native_lto.cx7_1g
0.000	0.000	99.833	0.167	0.000	0.000	0.000	0.000	0.000	0.000	0.012	pg147_o3_native_lto.cx7_1g
0.000	0.000	99.733	0.267	0.000	0.000	0.000	0.000	0.000	0.000	0.012	pg151_o3_native_lto.cx7_1g
0.000	0.000	99.783	0.217	0.000	0.000	0.000	0.000	0.000	0.000	0.012	pg152_o3_native_lto.cx7_1g
q1000.1
- q1000.1: range queries with 1000 insert/s per client
- Legend for results is here.
- Each entry lists the percentage of responses that fit in that bucket (slower than max time for previous bucket, faster than min time for next bucket).
Query response time histogram
256us	1ms	4ms	16ms	64ms	256ms	1s	4s	16s	gt	max	tag
99.944	0.056	nonzero	0.000	0.000	0.000	0.000	0.000	0.000	0.000	0.003	pg1119_o3_native_lto.cx7_1g
99.957	0.043	nonzero	nonzero	0.000	0.000	0.000	0.000	0.000	0.000	0.010	pg1214_o3_native_lto.cx7_1g
99.962	0.037	nonzero	nonzero	0.000	0.000	0.000	0.000	0.000	0.000	0.007	pg1310_o3_native_lto.cx7_1g
99.972	0.028	nonzero	0.000	0.000	0.000	0.000	0.000	0.000	0.000	0.003	pg147_o3_native_lto.cx7_1g
99.973	0.027	nonzero	nonzero	0.000	0.000	0.000	0.000	0.000	0.000	0.006	pg151_o3_native_lto.cx7_1g
99.973	0.027	nonzero	nonzero	0.000	0.000	0.000	0.000	0.000	0.000	0.010	pg152_o3_native_lto.cx7_1g
Insert response time histogram
256us	1ms	4ms	16ms	64ms	256ms	1s	4s	16s	gt	max	tag
0.000	0.000	99.881	0.119	0.000	0.000	0.000	0.000	0.000	0.000	0.012	pg1119_o3_native_lto.cx7_1g
0.000	0.000	99.842	0.158	0.000	0.000	0.000	0.000	0.000	0.000	0.005	pg1214_o3_native_lto.cx7_1g
0.000	0.000	99.678	0.322	0.000	0.000	0.000	0.000	0.000	0.000	0.015	pg1310_o3_native_lto.cx7_1g
0.000	0.000	99.692	0.308	0.000	0.000	0.000	0.000	0.000	0.000	0.012	pg147_o3_native_lto.cx7_1g
0.000	0.000	99.486	0.514	0.000	0.000	0.000	0.000	0.000	0.000	0.012	pg151_o3_native_lto.cx7_1g
0.000	0.000	99.483	0.517	0.000	0.000	0.000	0.000	0.000	0.000	0.012	pg152_o3_native_lto.cx7_1g