Introduction
This is a report for the insert benchmark with 20M docs and 4 client(s). It is generated by scripts (bash, awk, sed) and Tufte might not be impressed. An overview of the insert benchmark is here and a short update is here. Below, by DBMS, I mean DBMS+version.config. An example is my8020.c10b40 where my means MySQL, 8020 is version 8.0.20 and c10b40 is the name for the configuration file.
The test server has 8 AMD cores, 16G RAM and an NVMe SSD. It is described here as the Beelink. The benchmark was run with 4 clients and there were 1 or 2 connections per client (1 for queries, 1 for inserts). It uses 4 tables, each client has a separate table. It loads 20M rows without secondary indexes, creates secondary indexes, loads another 20M rows then does 3 read+write tests for one hour each that do queries as fast as possible with 100, 500 and then 1000 writes/second/client concurrent with the queries. The database is cached by the storage engine and the only IO is for writes. Clients and the DBMS share one server. The per-database configs are in the per-database subdirectories here.
The tested DBMS are:
- pg152_o3_native_lto.cx7 -Postgres 15.2, the cx7 config and the build used: -O3 -march=native -mtune=native
- pg16prebeta - Postgres 16 from the main branch at git sha 1ab763fc2, the cx7 config and the build used: -O3 -march=native -mtune=native
Contents
- Summary
- l.i0: load without secondary indexes
- l.x: create secondary indexes
- l.i1: continue load after secondary indexes created
- q100.1: range queries with 100 insert/s per client
- q500.1: range queries with 500 insert/s per client
- q1000.1: range queries with 1000 insert/s per client
Summary
The numbers are inserts/s for l.i0 and l.i1, indexed docs (or rows) /s for l.x and queries/s for q*.2. The values are the average rate over the entire test for inserts (IPS) and queries (QPS). The range of values for IPS and QPS is split into 3 parts: bottom 25%, middle 50%, top 25%. Values in the bottom 25% have a red background, values in the top 25% have a green background and values in the middle have no color. A gray background is used for values that can be ignored because the DBMS did not sustain the target insert rate. Red backgrounds are not used when the minimum value is within 80% of the max value.
| dbms | l.i0 | l.x | l.i1 | q100.1 | q500.1 | q1000.1 |
|---|---|---|---|---|---|---|
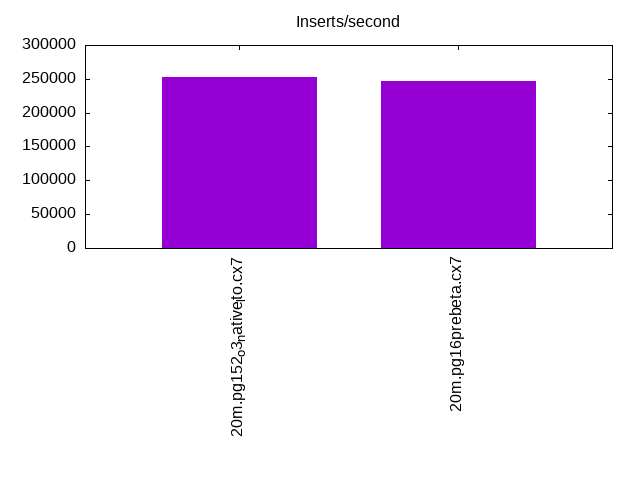
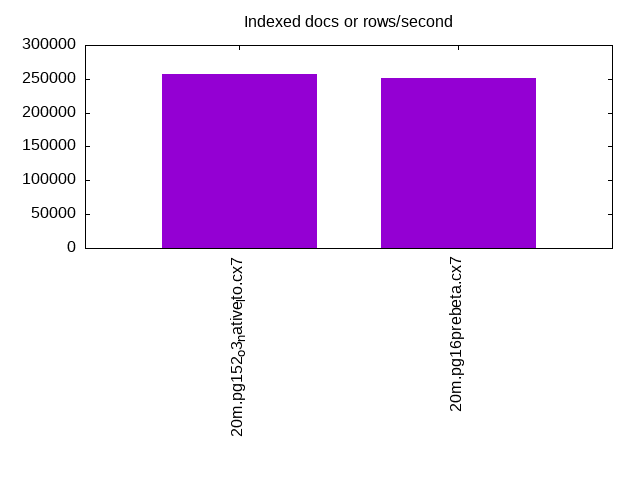
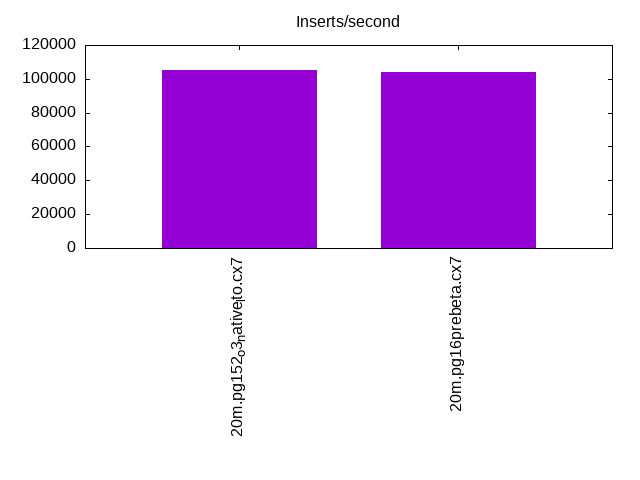
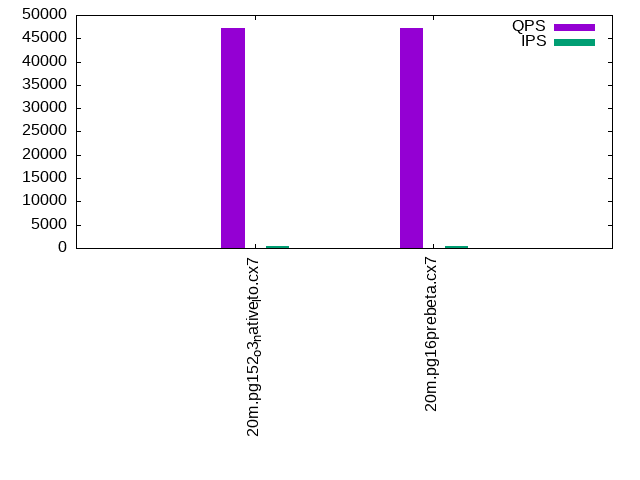
| 20m.pg152_o3_native_lto.cx7 | 253164 | 257692 | 105263 | 47118 | 46367 | 45650 |
| 20m.pg16prebeta.cx7 | 246914 | 251250 | 104167 | 47198 | 46245 | 45621 |
This table has relative throughput, throughput for the DBMS relative to the DBMS in the first line, using the absolute throughput from the previous table.
| dbms | l.i0 | l.x | l.i1 | q100.1 | q500.1 | q1000.1 |
|---|---|---|---|---|---|---|
| 20m.pg152_o3_native_lto.cx7 | 1.00 | 1.00 | 1.00 | 1.00 | 1.00 | 1.00 |
| 20m.pg16prebeta.cx7 | 0.98 | 0.98 | 0.99 | 1.00 | 1.00 | 1.00 |
This lists the average rate of inserts/s for the tests that do inserts concurrent with queries. For such tests the query rate is listed in the table above. The read+write tests are setup so that the insert rate should match the target rate every second. Cells that are not at least 95% of the target have a red background to indicate a failure to satisfy the target.
| dbms | q100.1 | q500.1 | q1000.1 |
|---|---|---|---|
| pg152_o3_native_lto.cx7 | 399 | 1994 | 3989 |
| pg16prebeta.cx7 | 399 | 1993 | 3989 |
| target | 400 | 2000 | 4000 |
l.i0
l.i0: load without secondary indexes. Graphs for performance per 1-second interval are here.
Average throughput:
Insert response time histogram: each cell has the percentage of responses that take <= the time in the header and max is the max response time in seconds. For the max column values in the top 25% of the range have a red background and in the bottom 25% of the range have a green background. The red background is not used when the min value is within 80% of the max value.
| dbms | 256us | 1ms | 4ms | 16ms | 64ms | 256ms | 1s | 4s | 16s | gt | max |
|---|---|---|---|---|---|---|---|---|---|---|---|
| pg152_o3_native_lto.cx7 | 0.011 | 99.941 | 0.049 | 0.010 | |||||||
| pg16prebeta.cx7 | 99.969 | 0.032 | 0.010 |
Performance metrics for the DBMS listed above. Some are normalized by throughput, others are not. Legend for results is here.
ips	qps	rps	rmbps	wps	wmbps	rpq	rkbpq	wpi	wkbpi	csps	cpups	cspq	cpupq	dbgb1	dbgb2	rss	maxop	p50	p99	tag
253164	0	0	0.0	306.7	111.3	0.000	0.000	0.001	0.450	27916	69.8	0.110	22	2.1	5.6	0.0	0.010	76143	70245	20m.pg152_o3_native_lto.cx7
246914	0	0	0.0	296.5	106.5	0.000	0.000	0.001	0.442	27855	69.3	0.113	22	2.1	5.6	0.0	0.010	73221	8191	20m.pg16prebeta.cx7
l.x
l.x: create secondary indexes.
Average throughput:
Performance metrics for the DBMS listed above. Some are normalized by throughput, others are not. Legend for results is here.
ips	qps	rps	rmbps	wps	wmbps	rpq	rkbpq	wpi	wkbpi	csps	cpups	cspq	cpupq	dbgb1	dbgb2	rss	maxop	p50	p99	tag
257692	0	0	0.0	132.9	61.9	0.000	0.000	0.001	0.246	741	12.7	0.003	4	3.9	9.0	0.0	0.003	NA	NA	20m.pg152_o3_native_lto.cx7
251250	0	0	0.0	115.6	53.3	0.000	0.000	0.000	0.217	706	12.7	0.003	4	3.9	9.0	0.0	0.003	NA	NA	20m.pg16prebeta.cx7
l.i1
l.i1: continue load after secondary indexes created. Graphs for performance per 1-second interval are here.
Average throughput:
Insert response time histogram: each cell has the percentage of responses that take <= the time in the header and max is the max response time in seconds. For the max column values in the top 25% of the range have a red background and in the bottom 25% of the range have a green background. The red background is not used when the min value is within 80% of the max value.
| dbms | 256us | 1ms | 4ms | 16ms | 64ms | 256ms | 1s | 4s | 16s | gt | max |
|---|---|---|---|---|---|---|---|---|---|---|---|
| pg152_o3_native_lto.cx7 | 99.797 | 0.069 | 0.134 | 0.055 | |||||||
| pg16prebeta.cx7 | 99.815 | 0.062 | 0.123 | 0.054 |
Performance metrics for the DBMS listed above. Some are normalized by throughput, others are not. Legend for results is here.
ips	qps	rps	rmbps	wps	wmbps	rpq	rkbpq	wpi	wkbpi	csps	cpups	cspq	cpupq	dbgb1	dbgb2	rss	maxop	p50	p99	tag
105263	0	4	0.0	460.7	158.8	0.000	0.000	0.004	1.544	22594	63.4	0.215	48	8.6	24.9	0.0	0.055	28317	3847	20m.pg152_o3_native_lto.cx7
104167	0	0	0.0	453.2	154.8	0.000	0.000	0.004	1.521	22316	63.7	0.214	49	8.6	24.8	0.0	0.054	27720	3645	20m.pg16prebeta.cx7
q100.1
q100.1: range queries with 100 insert/s per client. Graphs for performance per 1-second interval are here.
Average throughput:
Query response time histogram: each cell has the percentage of responses that take <= the time in the header and max is the max response time in seconds. For max values in the top 25% of the range have a red background and in the bottom 25% of the range have a green background. The red background is not used when the min value is within 80% of the max value.
| dbms | 256us | 1ms | 4ms | 16ms | 64ms | 256ms | 1s | 4s | 16s | gt | max |
|---|---|---|---|---|---|---|---|---|---|---|---|
| pg152_o3_native_lto.cx7 | 99.986 | 0.009 | 0.005 | nonzero | 0.008 | ||||||
| pg16prebeta.cx7 | 99.986 | 0.010 | 0.005 | nonzero | 0.012 |
Insert response time histogram: each cell has the percentage of responses that take <= the time in the header and max is the max response time in seconds. For max values in the top 25% of the range have a red background and in the bottom 25% of the range have a green background. The red background is not used when the min value is within 80% of the max value.
| dbms | 256us | 1ms | 4ms | 16ms | 64ms | 256ms | 1s | 4s | 16s | gt | max |
|---|---|---|---|---|---|---|---|---|---|---|---|
| pg152_o3_native_lto.cx7 | 99.569 | 0.431 | 0.008 | ||||||||
| pg16prebeta.cx7 | 99.785 | 0.215 | 0.008 |
Performance metrics for the DBMS listed above. Some are normalized by throughput, others are not. Legend for results is here.
ips	qps	rps	rmbps	wps	wmbps	rpq	rkbpq	wpi	wkbpi	csps	cpups	cspq	cpupq	dbgb1	dbgb2	rss	maxop	p50	p99	tag
399	47118	0	0.0	291.2	12.5	0.000	0.000	0.730	32.177	179672	50.5	3.813	86	8.7	25.0	0.0	0.008	11907	10772	20m.pg152_o3_native_lto.cx7
399	47198	0	0.0	291.4	12.6	0.000	0.000	0.731	32.322	179949	50.5	3.813	86	8.7	24.8	0.0	0.012	11907	10473	20m.pg16prebeta.cx7
q500.1
q500.1: range queries with 500 insert/s per client. Graphs for performance per 1-second interval are here.
Average throughput:
Query response time histogram: each cell has the percentage of responses that take <= the time in the header and max is the max response time in seconds. For max values in the top 25% of the range have a red background and in the bottom 25% of the range have a green background. The red background is not used when the min value is within 80% of the max value.
| dbms | 256us | 1ms | 4ms | 16ms | 64ms | 256ms | 1s | 4s | 16s | gt | max |
|---|---|---|---|---|---|---|---|---|---|---|---|
| pg152_o3_native_lto.cx7 | 99.960 | 0.023 | 0.016 | 0.001 | nonzero | 0.019 | |||||
| pg16prebeta.cx7 | 99.960 | 0.023 | 0.016 | 0.001 | nonzero | 0.020 |
Insert response time histogram: each cell has the percentage of responses that take <= the time in the header and max is the max response time in seconds. For max values in the top 25% of the range have a red background and in the bottom 25% of the range have a green background. The red background is not used when the min value is within 80% of the max value.
| dbms | 256us | 1ms | 4ms | 16ms | 64ms | 256ms | 1s | 4s | 16s | gt | max |
|---|---|---|---|---|---|---|---|---|---|---|---|
| pg152_o3_native_lto.cx7 | 97.618 | 2.329 | 0.053 | 0.044 | |||||||
| pg16prebeta.cx7 | 97.144 | 2.815 | 0.036 | 0.004 | 0.108 |
Performance metrics for the DBMS listed above. Some are normalized by throughput, others are not. Legend for results is here.
ips	qps	rps	rmbps	wps	wmbps	rpq	rkbpq	wpi	wkbpi	csps	cpups	cspq	cpupq	dbgb1	dbgb2	rss	maxop	p50	p99	tag
1994	46367	2	0.0	273.9	20.5	0.000	0.000	0.137	10.500	175828	51.4	3.792	89	10.2	21.5	0.0	0.019	11715	9542	20m.pg152_o3_native_lto.cx7
1993	46245	2	0.0	275.1	20.5	0.000	0.000	0.138	10.510	175445	51.3	3.794	89	10.2	21.4	0.0	0.020	11651	10309	20m.pg16prebeta.cx7
q1000.1
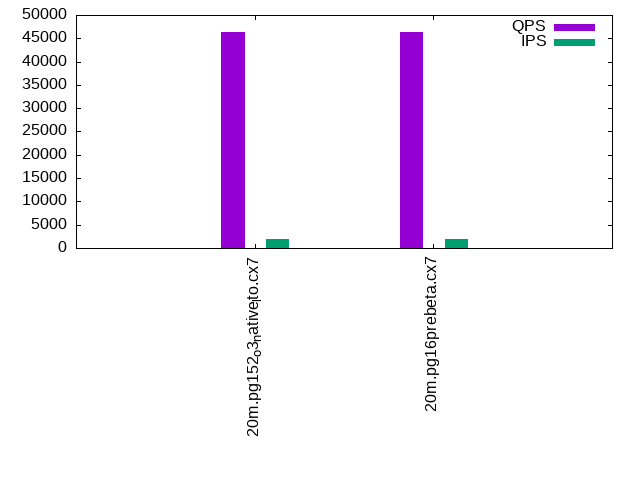
q1000.1: range queries with 1000 insert/s per client. Graphs for performance per 1-second interval are here.
Average throughput:

Query response time histogram: each cell has the percentage of responses that take <= the time in the header and max is the max response time in seconds. For max values in the top 25% of the range have a red background and in the bottom 25% of the range have a green background. The red background is not used when the min value is within 80% of the max value.
| dbms | 256us | 1ms | 4ms | 16ms | 64ms | 256ms | 1s | 4s | 16s | gt | max |
|---|---|---|---|---|---|---|---|---|---|---|---|
| pg152_o3_native_lto.cx7 | 99.922 | 0.051 | 0.026 | 0.001 | nonzero | 0.023 | |||||
| pg16prebeta.cx7 | 99.911 | 0.060 | 0.028 | 0.001 | nonzero | 0.024 |
Insert response time histogram: each cell has the percentage of responses that take <= the time in the header and max is the max response time in seconds. For max values in the top 25% of the range have a red background and in the bottom 25% of the range have a green background. The red background is not used when the min value is within 80% of the max value.
| dbms | 256us | 1ms | 4ms | 16ms | 64ms | 256ms | 1s | 4s | 16s | gt | max |
|---|---|---|---|---|---|---|---|---|---|---|---|
| pg152_o3_native_lto.cx7 | 96.085 | 3.869 | 0.045 | 0.028 | |||||||
| pg16prebeta.cx7 | 95.573 | 4.378 | 0.049 | 0.029 |
Performance metrics for the DBMS listed above. Some are normalized by throughput, others are not. Legend for results is here.
ips	qps	rps	rmbps	wps	wmbps	rpq	rkbpq	wpi	wkbpi	csps	cpups	cspq	cpupq	dbgb1	dbgb2	rss	maxop	p50	p99	tag
3989	45650	26	0.2	323.1	27.4	0.001	0.005	0.081	7.021	171630	52.4	3.760	92	12.6	21.8	0.0	0.023	11556	9877	20m.pg152_o3_native_lto.cx7
3989	45621	25	0.2	323.9	27.4	0.001	0.005	0.081	7.022	171633	52.4	3.762	92	12.6	21.7	0.0	0.024	11491	9637	20m.pg16prebeta.cx7
l.i0
l.i0: load without secondary indexes
Performance metrics for all DBMS, not just the ones listed above. Some are normalized by throughput, others are not. Legend for results is here.
ips	qps	rps	rmbps	wps	wmbps	rpq	rkbpq	wpi	wkbpi	csps	cpups	cspq	cpupq	dbgb1	dbgb2	rss	maxop	p50	p99	tag
253164	0	0	0.0	306.7	111.3	0.000	0.000	0.001	0.450	27916	69.8	0.110	22	2.1	5.6	0.0	0.010	76143	70245	20m.pg152_o3_native_lto.cx7
246914	0	0	0.0	296.5	106.5	0.000	0.000	0.001	0.442	27855	69.3	0.113	22	2.1	5.6	0.0	0.010	73221	8191	20m.pg16prebeta.cx7
l.x
l.x: create secondary indexes
Performance metrics for all DBMS, not just the ones listed above. Some are normalized by throughput, others are not. Legend for results is here.
ips	qps	rps	rmbps	wps	wmbps	rpq	rkbpq	wpi	wkbpi	csps	cpups	cspq	cpupq	dbgb1	dbgb2	rss	maxop	p50	p99	tag
257692	0	0	0.0	132.9	61.9	0.000	0.000	0.001	0.246	741	12.7	0.003	4	3.9	9.0	0.0	0.003	NA	NA	20m.pg152_o3_native_lto.cx7
251250	0	0	0.0	115.6	53.3	0.000	0.000	0.000	0.217	706	12.7	0.003	4	3.9	9.0	0.0	0.003	NA	NA	20m.pg16prebeta.cx7
l.i1
l.i1: continue load after secondary indexes created
Performance metrics for all DBMS, not just the ones listed above. Some are normalized by throughput, others are not. Legend for results is here.
ips	qps	rps	rmbps	wps	wmbps	rpq	rkbpq	wpi	wkbpi	csps	cpups	cspq	cpupq	dbgb1	dbgb2	rss	maxop	p50	p99	tag
105263	0	4	0.0	460.7	158.8	0.000	0.000	0.004	1.544	22594	63.4	0.215	48	8.6	24.9	0.0	0.055	28317	3847	20m.pg152_o3_native_lto.cx7
104167	0	0	0.0	453.2	154.8	0.000	0.000	0.004	1.521	22316	63.7	0.214	49	8.6	24.8	0.0	0.054	27720	3645	20m.pg16prebeta.cx7
q100.1
q100.1: range queries with 100 insert/s per client
Performance metrics for all DBMS, not just the ones listed above. Some are normalized by throughput, others are not. Legend for results is here.
ips	qps	rps	rmbps	wps	wmbps	rpq	rkbpq	wpi	wkbpi	csps	cpups	cspq	cpupq	dbgb1	dbgb2	rss	maxop	p50	p99	tag
399	47118	0	0.0	291.2	12.5	0.000	0.000	0.730	32.177	179672	50.5	3.813	86	8.7	25.0	0.0	0.008	11907	10772	20m.pg152_o3_native_lto.cx7
399	47198	0	0.0	291.4	12.6	0.000	0.000	0.731	32.322	179949	50.5	3.813	86	8.7	24.8	0.0	0.012	11907	10473	20m.pg16prebeta.cx7
q500.1
q500.1: range queries with 500 insert/s per client
Performance metrics for all DBMS, not just the ones listed above. Some are normalized by throughput, others are not. Legend for results is here.
ips	qps	rps	rmbps	wps	wmbps	rpq	rkbpq	wpi	wkbpi	csps	cpups	cspq	cpupq	dbgb1	dbgb2	rss	maxop	p50	p99	tag
1994	46367	2	0.0	273.9	20.5	0.000	0.000	0.137	10.500	175828	51.4	3.792	89	10.2	21.5	0.0	0.019	11715	9542	20m.pg152_o3_native_lto.cx7
1993	46245	2	0.0	275.1	20.5	0.000	0.000	0.138	10.510	175445	51.3	3.794	89	10.2	21.4	0.0	0.020	11651	10309	20m.pg16prebeta.cx7
q1000.1
q1000.1: range queries with 1000 insert/s per client
Performance metrics for all DBMS, not just the ones listed above. Some are normalized by throughput, others are not. Legend for results is here.
ips	qps	rps	rmbps	wps	wmbps	rpq	rkbpq	wpi	wkbpi	csps	cpups	cspq	cpupq	dbgb1	dbgb2	rss	maxop	p50	p99	tag
3989	45650	26	0.2	323.1	27.4	0.001	0.005	0.081	7.021	171630	52.4	3.760	92	12.6	21.8	0.0	0.023	11556	9877	20m.pg152_o3_native_lto.cx7
3989	45621	25	0.2	323.9	27.4	0.001	0.005	0.081	7.022	171633	52.4	3.762	92	12.6	21.7	0.0	0.024	11491	9637	20m.pg16prebeta.cx7
l.i0
- l.i0: load without secondary indexes
- Legend for results is here.
- Each entry lists the percentage of responses that fit in that bucket (slower than max time for previous bucket, faster than min time for next bucket).
Insert response time histogram
256us	1ms	4ms	16ms	64ms	256ms	1s	4s	16s	gt	max	tag
0.000	0.011	99.941	0.049	0.000	0.000	0.000	0.000	0.000	0.000	0.010	pg152_o3_native_lto.cx7
0.000	0.000	99.969	0.032	0.000	0.000	0.000	0.000	0.000	0.000	0.010	pg16prebeta.cx7
l.x
- l.x: create secondary indexes
- Legend for results is here.
- Each entry lists the percentage of responses that fit in that bucket (slower than max time for previous bucket, faster than min time for next bucket).
TODO - determine whether there is data for create index response time
l.i1
- l.i1: continue load after secondary indexes created
- Legend for results is here.
- Each entry lists the percentage of responses that fit in that bucket (slower than max time for previous bucket, faster than min time for next bucket).
Insert response time histogram
256us	1ms	4ms	16ms	64ms	256ms	1s	4s	16s	gt	max	tag
0.000	0.000	99.797	0.069	0.134	0.000	0.000	0.000	0.000	0.000	0.055	pg152_o3_native_lto.cx7
0.000	0.000	99.815	0.062	0.123	0.000	0.000	0.000	0.000	0.000	0.054	pg16prebeta.cx7
q100.1
- q100.1: range queries with 100 insert/s per client
- Legend for results is here.
- Each entry lists the percentage of responses that fit in that bucket (slower than max time for previous bucket, faster than min time for next bucket).
Query response time histogram
256us	1ms	4ms	16ms	64ms	256ms	1s	4s	16s	gt	max	tag
99.986	0.009	0.005	nonzero	0.000	0.000	0.000	0.000	0.000	0.000	0.008	pg152_o3_native_lto.cx7
99.986	0.010	0.005	nonzero	0.000	0.000	0.000	0.000	0.000	0.000	0.012	pg16prebeta.cx7
Insert response time histogram
256us	1ms	4ms	16ms	64ms	256ms	1s	4s	16s	gt	max	tag
0.000	0.000	99.569	0.431	0.000	0.000	0.000	0.000	0.000	0.000	0.008	pg152_o3_native_lto.cx7
0.000	0.000	99.785	0.215	0.000	0.000	0.000	0.000	0.000	0.000	0.008	pg16prebeta.cx7
q500.1
- q500.1: range queries with 500 insert/s per client
- Legend for results is here.
- Each entry lists the percentage of responses that fit in that bucket (slower than max time for previous bucket, faster than min time for next bucket).
Query response time histogram
256us	1ms	4ms	16ms	64ms	256ms	1s	4s	16s	gt	max	tag
99.960	0.023	0.016	0.001	nonzero	0.000	0.000	0.000	0.000	0.000	0.019	pg152_o3_native_lto.cx7
99.960	0.023	0.016	0.001	nonzero	0.000	0.000	0.000	0.000	0.000	0.020	pg16prebeta.cx7
Insert response time histogram
256us	1ms	4ms	16ms	64ms	256ms	1s	4s	16s	gt	max	tag
0.000	0.000	97.618	2.329	0.053	0.000	0.000	0.000	0.000	0.000	0.044	pg152_o3_native_lto.cx7
0.000	0.000	97.144	2.815	0.036	0.004	0.000	0.000	0.000	0.000	0.108	pg16prebeta.cx7
q1000.1
- q1000.1: range queries with 1000 insert/s per client
- Legend for results is here.
- Each entry lists the percentage of responses that fit in that bucket (slower than max time for previous bucket, faster than min time for next bucket).
Query response time histogram
256us	1ms	4ms	16ms	64ms	256ms	1s	4s	16s	gt	max	tag
99.922	0.051	0.026	0.001	nonzero	0.000	0.000	0.000	0.000	0.000	0.023	pg152_o3_native_lto.cx7
99.911	0.060	0.028	0.001	nonzero	0.000	0.000	0.000	0.000	0.000	0.024	pg16prebeta.cx7
Insert response time histogram
256us	1ms	4ms	16ms	64ms	256ms	1s	4s	16s	gt	max	tag
0.000	0.000	96.085	3.869	0.045	0.000	0.000	0.000	0.000	0.000	0.028	pg152_o3_native_lto.cx7
0.000	0.000	95.573	4.378	0.049	0.000	0.000	0.000	0.000	0.000	0.029	pg16prebeta.cx7