Introduction
This is a report for the insert benchmark with 20M docs and 4 client(s). It is generated by scripts (bash, awk, sed) and Tufte might not be impressed. An overview of the insert benchmark is here and a short update is here. Below, by DBMS, I mean DBMS+version.config. An example is my8020.c10b40 where my means MySQL, 8020 is version 8.0.20 and c10b40 is the name for the configuration file.
The test server has 8 AMD cores, 16G RAM and an NVMe SSD. It is described here as the Beelink. The benchmark was run with 4 clients and there were 1 or 2 connections per client (1 for queries, 1 for inserts). It uses 4 tables, each client has a separate table. It loads 20M rows without secondary indexes, creates secondary indexes, loads another 20M rows then does 3 read+write tests for one hour each that do queries as fast as possible with 100, 500 and then 1000 writes/second/client concurrent with the queries. The database is cached by OS but not by Postgres. Clients and the DBMS share one server. The per-database configs are in the per-database subdirectories here.
The tested DBMS are:
- pg152_o3_native_lto.cx7_1g -Postgres 15.2, the cx7_1g config and the build used: -O3 -march=native -mtune=native
- pg16prebeta - Postgres 16 from the main branch at git sha 1ab763fc2, the cx7_1g config and the build used: -O3 -march=native -mtune=native
Contents
- Summary
- l.i0: load without secondary indexes
- l.x: create secondary indexes
- l.i1: continue load after secondary indexes created
- q100.1: range queries with 100 insert/s per client
- q500.1: range queries with 500 insert/s per client
- q1000.1: range queries with 1000 insert/s per client
Summary
The numbers are inserts/s for l.i0 and l.i1, indexed docs (or rows) /s for l.x and queries/s for q*.2. The values are the average rate over the entire test for inserts (IPS) and queries (QPS). The range of values for IPS and QPS is split into 3 parts: bottom 25%, middle 50%, top 25%. Values in the bottom 25% have a red background, values in the top 25% have a green background and values in the middle have no color. A gray background is used for values that can be ignored because the DBMS did not sustain the target insert rate. Red backgrounds are not used when the minimum value is within 80% of the max value.
| dbms | l.i0 | l.x | l.i1 | q100.1 | q500.1 | q1000.1 |
|---|---|---|---|---|---|---|
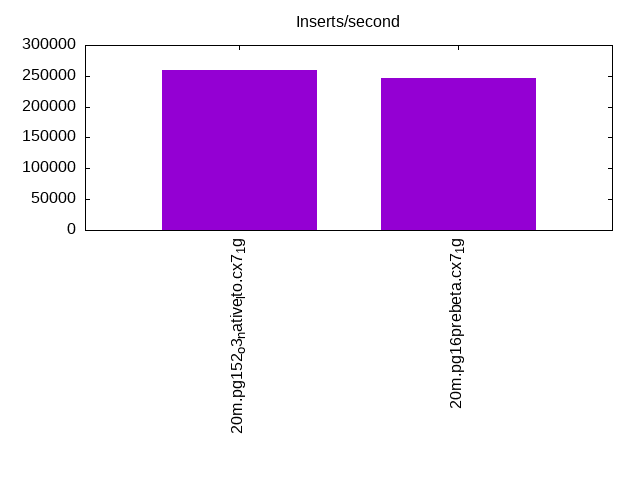
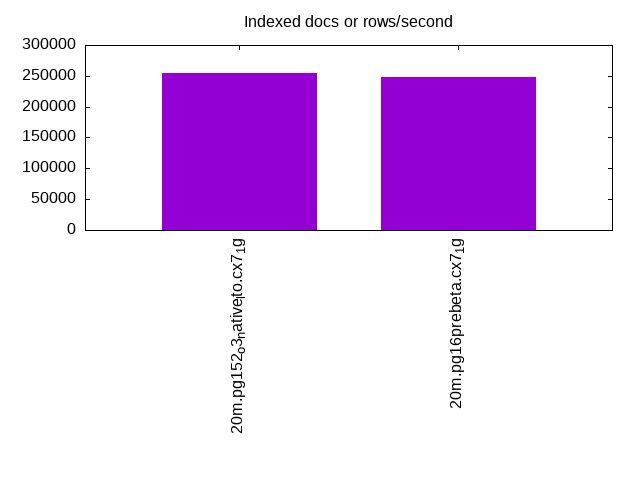
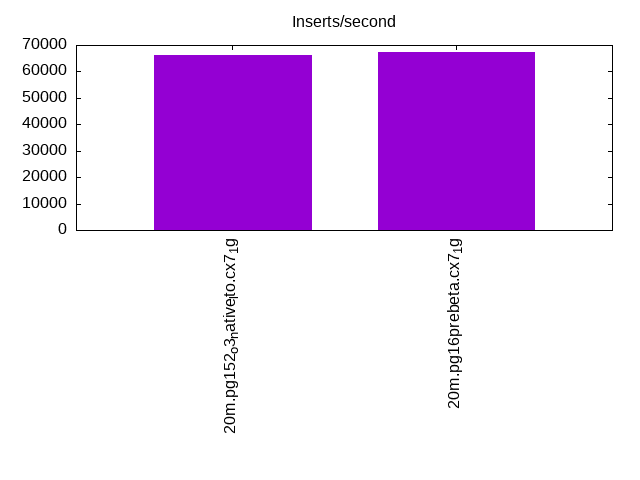
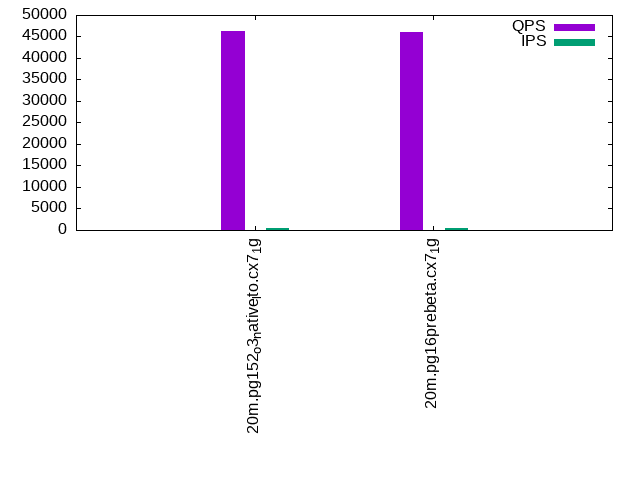
| 20m.pg152_o3_native_lto.cx7_1g | 259740 | 254430 | 66225 | 46240 | 44391 | 43172 |
| 20m.pg16prebeta.cx7_1g | 246914 | 248148 | 67340 | 45996 | 44081 | 42684 |
This table has relative throughput, throughput for the DBMS relative to the DBMS in the first line, using the absolute throughput from the previous table.
| dbms | l.i0 | l.x | l.i1 | q100.1 | q500.1 | q1000.1 |
|---|---|---|---|---|---|---|
| 20m.pg152_o3_native_lto.cx7_1g | 1.00 | 1.00 | 1.00 | 1.00 | 1.00 | 1.00 |
| 20m.pg16prebeta.cx7_1g | 0.95 | 0.98 | 1.02 | 0.99 | 0.99 | 0.99 |
This lists the average rate of inserts/s for the tests that do inserts concurrent with queries. For such tests the query rate is listed in the table above. The read+write tests are setup so that the insert rate should match the target rate every second. Cells that are not at least 95% of the target have a red background to indicate a failure to satisfy the target.
| dbms | q100.1 | q500.1 | q1000.1 |
|---|---|---|---|
| pg152_o3_native_lto.cx7_1g | 399 | 1994 | 3989 |
| pg16prebeta.cx7_1g | 399 | 1994 | 3989 |
| target | 400 | 2000 | 4000 |
l.i0
l.i0: load without secondary indexes. Graphs for performance per 1-second interval are here.
Average throughput:
Insert response time histogram: each cell has the percentage of responses that take <= the time in the header and max is the max response time in seconds. For the max column values in the top 25% of the range have a red background and in the bottom 25% of the range have a green background. The red background is not used when the min value is within 80% of the max value.
| dbms | 256us | 1ms | 4ms | 16ms | 64ms | 256ms | 1s | 4s | 16s | gt | max |
|---|---|---|---|---|---|---|---|---|---|---|---|
| pg152_o3_native_lto.cx7_1g | 0.060 | 99.874 | 0.066 | 0.011 | |||||||
| pg16prebeta.cx7_1g | 99.948 | 0.052 | 0.014 |
Performance metrics for the DBMS listed above. Some are normalized by throughput, others are not. Legend for results is here.
ips	qps	rps	rmbps	wps	wmbps	rpq	rkbpq	wpi	wkbpi	csps	cpups	cspq	cpupq	dbgb1	dbgb2	rss	maxop	p50	p99	tag
259740	0	0	0.0	405.5	131.4	0.000	0.000	0.002	0.518	28203	69.8	0.109	22	2.1	5.6	0.0	0.011	75746	1898	20m.pg152_o3_native_lto.cx7_1g
246914	0	0	0.0	393.6	124.5	0.000	0.000	0.002	0.516	27748	68.8	0.112	22	2.1	5.6	0.0	0.014	74419	31666	20m.pg16prebeta.cx7_1g
l.x
l.x: create secondary indexes.
Average throughput:
Performance metrics for the DBMS listed above. Some are normalized by throughput, others are not. Legend for results is here.
ips	qps	rps	rmbps	wps	wmbps	rpq	rkbpq	wpi	wkbpi	csps	cpups	cspq	cpupq	dbgb1	dbgb2	rss	maxop	p50	p99	tag
254430	0	0	0.0	153.3	66.2	0.000	0.000	0.001	0.266	834	12.6	0.003	4	3.9	9.0	0.0	0.003	NA	NA	20m.pg152_o3_native_lto.cx7_1g
248148	0	0	0.0	171.4	73.5	0.000	0.000	0.001	0.303	710	12.8	0.003	4	3.9	9.0	0.0	0.003	NA	NA	20m.pg16prebeta.cx7_1g
l.i1
l.i1: continue load after secondary indexes created. Graphs for performance per 1-second interval are here.
Average throughput:
Insert response time histogram: each cell has the percentage of responses that take <= the time in the header and max is the max response time in seconds. For the max column values in the top 25% of the range have a red background and in the bottom 25% of the range have a green background. The red background is not used when the min value is within 80% of the max value.
| dbms | 256us | 1ms | 4ms | 16ms | 64ms | 256ms | 1s | 4s | 16s | gt | max |
|---|---|---|---|---|---|---|---|---|---|---|---|
| pg152_o3_native_lto.cx7_1g | 97.579 | 2.345 | 0.074 | 0.001 | 0.077 | ||||||
| pg16prebeta.cx7_1g | 98.147 | 1.778 | 0.074 | 0.001 | 0.078 |
Performance metrics for the DBMS listed above. Some are normalized by throughput, others are not. Legend for results is here.
ips	qps	rps	rmbps	wps	wmbps	rpq	rkbpq	wpi	wkbpi	csps	cpups	cspq	cpupq	dbgb1	dbgb2	rss	maxop	p50	p99	tag
66225	0	179	1.3	43675.5	835.9	0.003	0.019	0.660	12.925	42728	62.3	0.645	75	8.6	25.3	0.0	0.077	16989	6043	20m.pg152_o3_native_lto.cx7_1g
67340	0	192	1.3	44741.5	858.3	0.003	0.020	0.664	13.051	40491	63.2	0.601	75	8.6	25.3	0.0	0.078	17381	7891	20m.pg16prebeta.cx7_1g
q100.1
q100.1: range queries with 100 insert/s per client. Graphs for performance per 1-second interval are here.
Average throughput:
Query response time histogram: each cell has the percentage of responses that take <= the time in the header and max is the max response time in seconds. For max values in the top 25% of the range have a red background and in the bottom 25% of the range have a green background. The red background is not used when the min value is within 80% of the max value.
| dbms | 256us | 1ms | 4ms | 16ms | 64ms | 256ms | 1s | 4s | 16s | gt | max |
|---|---|---|---|---|---|---|---|---|---|---|---|
| pg152_o3_native_lto.cx7_1g | 99.983 | 0.011 | 0.005 | nonzero | 0.009 | ||||||
| pg16prebeta.cx7_1g | 99.983 | 0.011 | 0.006 | nonzero | 0.008 |
Insert response time histogram: each cell has the percentage of responses that take <= the time in the header and max is the max response time in seconds. For max values in the top 25% of the range have a red background and in the bottom 25% of the range have a green background. The red background is not used when the min value is within 80% of the max value.
| dbms | 256us | 1ms | 4ms | 16ms | 64ms | 256ms | 1s | 4s | 16s | gt | max |
|---|---|---|---|---|---|---|---|---|---|---|---|
| pg152_o3_native_lto.cx7_1g | 99.528 | 0.472 | 0.012 | ||||||||
| pg16prebeta.cx7_1g | 99.688 | 0.312 | 0.011 |
Performance metrics for the DBMS listed above. Some are normalized by throughput, others are not. Legend for results is here.
ips	qps	rps	rmbps	wps	wmbps	rpq	rkbpq	wpi	wkbpi	csps	cpups	cspq	cpupq	dbgb1	dbgb2	rss	maxop	p50	p99	tag
399	46240	2	0.0	1278.7	15.4	0.000	0.000	3.206	39.576	176341	50.6	3.814	88	8.8	22.4	0.0	0.009	11715	10580	20m.pg152_o3_native_lto.cx7_1g
399	45996	1	0.0	1276.2	15.4	0.000	0.000	3.200	39.506	175374	50.4	3.813	88	8.7	22.3	0.0	0.008	11592	10278	20m.pg16prebeta.cx7_1g
q500.1
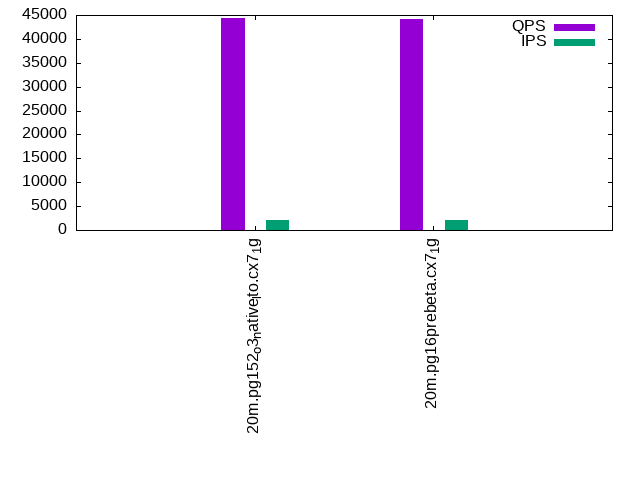
q500.1: range queries with 500 insert/s per client. Graphs for performance per 1-second interval are here.
Average throughput:
Query response time histogram: each cell has the percentage of responses that take <= the time in the header and max is the max response time in seconds. For max values in the top 25% of the range have a red background and in the bottom 25% of the range have a green background. The red background is not used when the min value is within 80% of the max value.
| dbms | 256us | 1ms | 4ms | 16ms | 64ms | 256ms | 1s | 4s | 16s | gt | max |
|---|---|---|---|---|---|---|---|---|---|---|---|
| pg152_o3_native_lto.cx7_1g | 99.942 | 0.038 | 0.019 | 0.001 | 0.016 | ||||||
| pg16prebeta.cx7_1g | 99.944 | 0.035 | 0.019 | 0.002 | nonzero | 0.018 |
Insert response time histogram: each cell has the percentage of responses that take <= the time in the header and max is the max response time in seconds. For max values in the top 25% of the range have a red background and in the bottom 25% of the range have a green background. The red background is not used when the min value is within 80% of the max value.
| dbms | 256us | 1ms | 4ms | 16ms | 64ms | 256ms | 1s | 4s | 16s | gt | max |
|---|---|---|---|---|---|---|---|---|---|---|---|
| pg152_o3_native_lto.cx7_1g | 96.400 | 3.539 | 0.061 | 0.053 | |||||||
| pg16prebeta.cx7_1g | 91.306 | 8.629 | 0.065 | 0.027 |
Performance metrics for the DBMS listed above. Some are normalized by throughput, others are not. Legend for results is here.
ips	qps	rps	rmbps	wps	wmbps	rpq	rkbpq	wpi	wkbpi	csps	cpups	cspq	cpupq	dbgb1	dbgb2	rss	maxop	p50	p99	tag
1994	44391	34	0.3	5763.2	55.3	0.001	0.006	2.890	28.376	167977	52.0	3.784	94	10.2	20.1	0.0	0.016	11172	9542	20m.pg152_o3_native_lto.cx7_1g
1994	44081	34	0.3	5759.6	55.2	0.001	0.006	2.888	28.363	166743	51.9	3.783	94	10.2	20.0	0.0	0.018	11044	9669	20m.pg16prebeta.cx7_1g
q1000.1
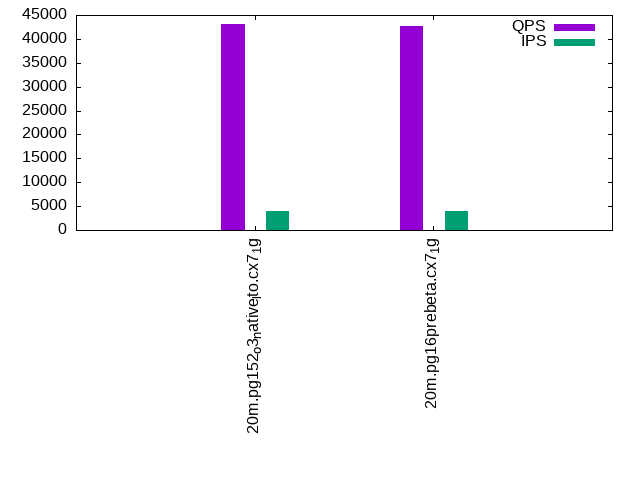
q1000.1: range queries with 1000 insert/s per client. Graphs for performance per 1-second interval are here.
Average throughput:
Query response time histogram: each cell has the percentage of responses that take <= the time in the header and max is the max response time in seconds. For max values in the top 25% of the range have a red background and in the bottom 25% of the range have a green background. The red background is not used when the min value is within 80% of the max value.
| dbms | 256us | 1ms | 4ms | 16ms | 64ms | 256ms | 1s | 4s | 16s | gt | max |
|---|---|---|---|---|---|---|---|---|---|---|---|
| pg152_o3_native_lto.cx7_1g | 99.903 | 0.069 | 0.026 | 0.002 | nonzero | 0.022 | |||||
| pg16prebeta.cx7_1g | 99.898 | 0.073 | 0.027 | 0.002 | nonzero | 0.018 |
Insert response time histogram: each cell has the percentage of responses that take <= the time in the header and max is the max response time in seconds. For max values in the top 25% of the range have a red background and in the bottom 25% of the range have a green background. The red background is not used when the min value is within 80% of the max value.
| dbms | 256us | 1ms | 4ms | 16ms | 64ms | 256ms | 1s | 4s | 16s | gt | max |
|---|---|---|---|---|---|---|---|---|---|---|---|
| pg152_o3_native_lto.cx7_1g | 93.860 | 6.084 | 0.056 | 0.028 | |||||||
| pg16prebeta.cx7_1g | 94.599 | 5.337 | 0.065 | 0.028 |
Performance metrics for the DBMS listed above. Some are normalized by throughput, others are not. Legend for results is here.
ips	qps	rps	rmbps	wps	wmbps	rpq	rkbpq	wpi	wkbpi	csps	cpups	cspq	cpupq	dbgb1	dbgb2	rss	maxop	p50	p99	tag
3989	43172	62	0.5	11390.0	100.4	0.001	0.013	2.855	25.777	160829	53.9	3.725	100	12.6	21.0	0.0	0.022	10772	9557	20m.pg152_o3_native_lto.cx7_1g
3989	42684	62	0.5	11377.0	100.3	0.001	0.013	2.852	25.744	159158	53.8	3.729	101	12.6	21.0	0.0	0.018	10804	9401	20m.pg16prebeta.cx7_1g
l.i0
l.i0: load without secondary indexes
Performance metrics for all DBMS, not just the ones listed above. Some are normalized by throughput, others are not. Legend for results is here.
ips	qps	rps	rmbps	wps	wmbps	rpq	rkbpq	wpi	wkbpi	csps	cpups	cspq	cpupq	dbgb1	dbgb2	rss	maxop	p50	p99	tag
259740	0	0	0.0	405.5	131.4	0.000	0.000	0.002	0.518	28203	69.8	0.109	22	2.1	5.6	0.0	0.011	75746	1898	20m.pg152_o3_native_lto.cx7_1g
246914	0	0	0.0	393.6	124.5	0.000	0.000	0.002	0.516	27748	68.8	0.112	22	2.1	5.6	0.0	0.014	74419	31666	20m.pg16prebeta.cx7_1g
l.x
l.x: create secondary indexes
Performance metrics for all DBMS, not just the ones listed above. Some are normalized by throughput, others are not. Legend for results is here.
ips	qps	rps	rmbps	wps	wmbps	rpq	rkbpq	wpi	wkbpi	csps	cpups	cspq	cpupq	dbgb1	dbgb2	rss	maxop	p50	p99	tag
254430	0	0	0.0	153.3	66.2	0.000	0.000	0.001	0.266	834	12.6	0.003	4	3.9	9.0	0.0	0.003	NA	NA	20m.pg152_o3_native_lto.cx7_1g
248148	0	0	0.0	171.4	73.5	0.000	0.000	0.001	0.303	710	12.8	0.003	4	3.9	9.0	0.0	0.003	NA	NA	20m.pg16prebeta.cx7_1g
l.i1
l.i1: continue load after secondary indexes created
Performance metrics for all DBMS, not just the ones listed above. Some are normalized by throughput, others are not. Legend for results is here.
ips	qps	rps	rmbps	wps	wmbps	rpq	rkbpq	wpi	wkbpi	csps	cpups	cspq	cpupq	dbgb1	dbgb2	rss	maxop	p50	p99	tag
66225	0	179	1.3	43675.5	835.9	0.003	0.019	0.660	12.925	42728	62.3	0.645	75	8.6	25.3	0.0	0.077	16989	6043	20m.pg152_o3_native_lto.cx7_1g
67340	0	192	1.3	44741.5	858.3	0.003	0.020	0.664	13.051	40491	63.2	0.601	75	8.6	25.3	0.0	0.078	17381	7891	20m.pg16prebeta.cx7_1g
q100.1
q100.1: range queries with 100 insert/s per client
Performance metrics for all DBMS, not just the ones listed above. Some are normalized by throughput, others are not. Legend for results is here.
ips	qps	rps	rmbps	wps	wmbps	rpq	rkbpq	wpi	wkbpi	csps	cpups	cspq	cpupq	dbgb1	dbgb2	rss	maxop	p50	p99	tag
399	46240	2	0.0	1278.7	15.4	0.000	0.000	3.206	39.576	176341	50.6	3.814	88	8.8	22.4	0.0	0.009	11715	10580	20m.pg152_o3_native_lto.cx7_1g
399	45996	1	0.0	1276.2	15.4	0.000	0.000	3.200	39.506	175374	50.4	3.813	88	8.7	22.3	0.0	0.008	11592	10278	20m.pg16prebeta.cx7_1g
q500.1
q500.1: range queries with 500 insert/s per client
Performance metrics for all DBMS, not just the ones listed above. Some are normalized by throughput, others are not. Legend for results is here.
ips	qps	rps	rmbps	wps	wmbps	rpq	rkbpq	wpi	wkbpi	csps	cpups	cspq	cpupq	dbgb1	dbgb2	rss	maxop	p50	p99	tag
1994	44391	34	0.3	5763.2	55.3	0.001	0.006	2.890	28.376	167977	52.0	3.784	94	10.2	20.1	0.0	0.016	11172	9542	20m.pg152_o3_native_lto.cx7_1g
1994	44081	34	0.3	5759.6	55.2	0.001	0.006	2.888	28.363	166743	51.9	3.783	94	10.2	20.0	0.0	0.018	11044	9669	20m.pg16prebeta.cx7_1g
q1000.1
q1000.1: range queries with 1000 insert/s per client
Performance metrics for all DBMS, not just the ones listed above. Some are normalized by throughput, others are not. Legend for results is here.
ips	qps	rps	rmbps	wps	wmbps	rpq	rkbpq	wpi	wkbpi	csps	cpups	cspq	cpupq	dbgb1	dbgb2	rss	maxop	p50	p99	tag
3989	43172	62	0.5	11390.0	100.4	0.001	0.013	2.855	25.777	160829	53.9	3.725	100	12.6	21.0	0.0	0.022	10772	9557	20m.pg152_o3_native_lto.cx7_1g
3989	42684	62	0.5	11377.0	100.3	0.001	0.013	2.852	25.744	159158	53.8	3.729	101	12.6	21.0	0.0	0.018	10804	9401	20m.pg16prebeta.cx7_1g
l.i0
- l.i0: load without secondary indexes
- Legend for results is here.
- Each entry lists the percentage of responses that fit in that bucket (slower than max time for previous bucket, faster than min time for next bucket).
Insert response time histogram
256us	1ms	4ms	16ms	64ms	256ms	1s	4s	16s	gt	max	tag
0.000	0.060	99.874	0.066	0.000	0.000	0.000	0.000	0.000	0.000	0.011	pg152_o3_native_lto.cx7_1g
0.000	0.000	99.948	0.052	0.000	0.000	0.000	0.000	0.000	0.000	0.014	pg16prebeta.cx7_1g
l.x
- l.x: create secondary indexes
- Legend for results is here.
- Each entry lists the percentage of responses that fit in that bucket (slower than max time for previous bucket, faster than min time for next bucket).
TODO - determine whether there is data for create index response time
l.i1
- l.i1: continue load after secondary indexes created
- Legend for results is here.
- Each entry lists the percentage of responses that fit in that bucket (slower than max time for previous bucket, faster than min time for next bucket).
Insert response time histogram
256us	1ms	4ms	16ms	64ms	256ms	1s	4s	16s	gt	max	tag
0.000	0.000	97.579	2.345	0.074	0.001	0.000	0.000	0.000	0.000	0.077	pg152_o3_native_lto.cx7_1g
0.000	0.000	98.147	1.778	0.074	0.001	0.000	0.000	0.000	0.000	0.078	pg16prebeta.cx7_1g
q100.1
- q100.1: range queries with 100 insert/s per client
- Legend for results is here.
- Each entry lists the percentage of responses that fit in that bucket (slower than max time for previous bucket, faster than min time for next bucket).
Query response time histogram
256us	1ms	4ms	16ms	64ms	256ms	1s	4s	16s	gt	max	tag
99.983	0.011	0.005	nonzero	0.000	0.000	0.000	0.000	0.000	0.000	0.009	pg152_o3_native_lto.cx7_1g
99.983	0.011	0.006	nonzero	0.000	0.000	0.000	0.000	0.000	0.000	0.008	pg16prebeta.cx7_1g
Insert response time histogram
256us	1ms	4ms	16ms	64ms	256ms	1s	4s	16s	gt	max	tag
0.000	0.000	99.528	0.472	0.000	0.000	0.000	0.000	0.000	0.000	0.012	pg152_o3_native_lto.cx7_1g
0.000	0.000	99.688	0.312	0.000	0.000	0.000	0.000	0.000	0.000	0.011	pg16prebeta.cx7_1g
q500.1
- q500.1: range queries with 500 insert/s per client
- Legend for results is here.
- Each entry lists the percentage of responses that fit in that bucket (slower than max time for previous bucket, faster than min time for next bucket).
Query response time histogram
256us	1ms	4ms	16ms	64ms	256ms	1s	4s	16s	gt	max	tag
99.942	0.038	0.019	0.001	0.000	0.000	0.000	0.000	0.000	0.000	0.016	pg152_o3_native_lto.cx7_1g
99.944	0.035	0.019	0.002	nonzero	0.000	0.000	0.000	0.000	0.000	0.018	pg16prebeta.cx7_1g
Insert response time histogram
256us	1ms	4ms	16ms	64ms	256ms	1s	4s	16s	gt	max	tag
0.000	0.000	96.400	3.539	0.061	0.000	0.000	0.000	0.000	0.000	0.053	pg152_o3_native_lto.cx7_1g
0.000	0.000	91.306	8.629	0.065	0.000	0.000	0.000	0.000	0.000	0.027	pg16prebeta.cx7_1g
q1000.1
- q1000.1: range queries with 1000 insert/s per client
- Legend for results is here.
- Each entry lists the percentage of responses that fit in that bucket (slower than max time for previous bucket, faster than min time for next bucket).
Query response time histogram
256us	1ms	4ms	16ms	64ms	256ms	1s	4s	16s	gt	max	tag
99.903	0.069	0.026	0.002	nonzero	0.000	0.000	0.000	0.000	0.000	0.022	pg152_o3_native_lto.cx7_1g
99.898	0.073	0.027	0.002	nonzero	0.000	0.000	0.000	0.000	0.000	0.018	pg16prebeta.cx7_1g
Insert response time histogram
256us	1ms	4ms	16ms	64ms	256ms	1s	4s	16s	gt	max	tag
0.000	0.000	93.860	6.084	0.056	0.000	0.000	0.000	0.000	0.000	0.028	pg152_o3_native_lto.cx7_1g
0.000	0.000	94.599	5.337	0.065	0.000	0.000	0.000	0.000	0.000	0.028	pg16prebeta.cx7_1g