Introduction
This is a report for the insert benchmark with 20M docs and 4 client(s). It is generated by scripts (bash, awk, sed) and Tufte might not be impressed. An overview of the insert benchmark is here and a short update is here. Below, by DBMS, I mean DBMS+version.config. An example is my8020.c10b40 where my means MySQL, 8020 is version 8.0.20 and c10b40 is the name for the configuration file.
The test server has 8 AMD cores, 16G RAM and an NVMe SSD. It is described here as the Beelink. The benchmark was run with 4 clients and there were 1 or 2 connections per client (1 for queries, 1 for inserts). It uses 1 table. It loads 20M rows without secondary indexes, creates secondary indexes, loads another 20M rows then does 3 read+write tests for one hour each that do queries as fast as possible with 100, 500 and then 1000 writes/second/client concurrent with the queries. The database is cached by OS but not by Postgres. Clients and the DBMS share one server. The per-database configs are in the per-database subdirectories here.
The tested DBMS are:
- pg152_o3_native_lto.cx7_1g -Postgres 15.2, the cx7_1g config and the build used: -O3 -march=native -mtune=native
- pg16prebeta - Postgres 16 from the main branch at git sha 1ab763fc2, the cx7_1g config and the build used: -O3 -march=native -mtune=native
Contents
- Summary
- l.i0: load without secondary indexes
- l.x: create secondary indexes
- l.i1: continue load after secondary indexes created
- q100.1: range queries with 100 insert/s per client
- q500.1: range queries with 500 insert/s per client
- q1000.1: range queries with 1000 insert/s per client
Summary
The numbers are inserts/s for l.i0 and l.i1, indexed docs (or rows) /s for l.x and queries/s for q*.2. The values are the average rate over the entire test for inserts (IPS) and queries (QPS). The range of values for IPS and QPS is split into 3 parts: bottom 25%, middle 50%, top 25%. Values in the bottom 25% have a red background, values in the top 25% have a green background and values in the middle have no color. A gray background is used for values that can be ignored because the DBMS did not sustain the target insert rate. Red backgrounds are not used when the minimum value is within 80% of the max value.
| dbms | l.i0 | l.x | l.i1 | q100.1 | q500.1 | q1000.1 |
|---|---|---|---|---|---|---|
| 20m.pg152_o3_native_lto.cx7_1g | 270270 | 873913 | 70175 | 47035 | 45155 | 43029 |
| 20m.pg16prebeta.cx7_1g | 259740 | 804000 | 70422 | 46561 | 44473 | 42570 |
This table has relative throughput, throughput for the DBMS relative to the DBMS in the first line, using the absolute throughput from the previous table.
| dbms | l.i0 | l.x | l.i1 | q100.1 | q500.1 | q1000.1 |
|---|---|---|---|---|---|---|
| 20m.pg152_o3_native_lto.cx7_1g | 1.00 | 1.00 | 1.00 | 1.00 | 1.00 | 1.00 |
| 20m.pg16prebeta.cx7_1g | 0.96 | 0.92 | 1.00 | 0.99 | 0.98 | 0.99 |
This lists the average rate of inserts/s for the tests that do inserts concurrent with queries. For such tests the query rate is listed in the table above. The read+write tests are setup so that the insert rate should match the target rate every second. Cells that are not at least 95% of the target have a red background to indicate a failure to satisfy the target.
| dbms | q100.1 | q500.1 | q1000.1 |
|---|---|---|---|
| pg152_o3_native_lto.cx7_1g | 399 | 1994 | 3989 |
| pg16prebeta.cx7_1g | 399 | 1994 | 3987 |
| target | 400 | 2000 | 4000 |
l.i0
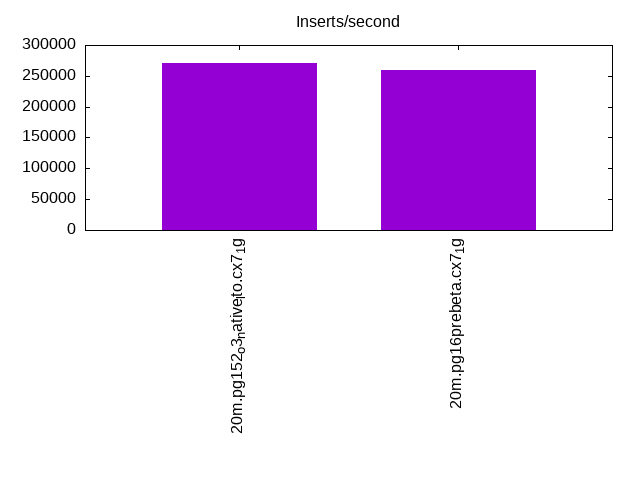
l.i0: load without secondary indexes. Graphs for performance per 1-second interval are here.
Average throughput:
Insert response time histogram: each cell has the percentage of responses that take <= the time in the header and max is the max response time in seconds. For the max column values in the top 25% of the range have a red background and in the bottom 25% of the range have a green background. The red background is not used when the min value is within 80% of the max value.
| dbms | 256us | 1ms | 4ms | 16ms | 64ms | 256ms | 1s | 4s | 16s | gt | max |
|---|---|---|---|---|---|---|---|---|---|---|---|
| pg152_o3_native_lto.cx7_1g | 0.005 | 99.933 | 0.062 | 0.001 | 0.026 | ||||||
| pg16prebeta.cx7_1g | 99.947 | 0.053 | 0.010 |
Performance metrics for the DBMS listed above. Some are normalized by throughput, others are not. Legend for results is here.
ips	qps	rps	rmbps	wps	wmbps	rpq	rkbpq	wpi	wkbpi	csps	cpups	cspq	cpupq	dbgb1	dbgb2	rss	maxop	p50	p99	tag
270270	0	0	0.0	506.9	125.2	0.000	0.000	0.002	0.474	27164	70.7	0.101	21	1.9	5.2	1.0	0.026	82436	11188	20m.pg152_o3_native_lto.cx7_1g
259740	0	0	0.0	492.2	119.9	0.000	0.000	0.002	0.473	26394	69.6	0.102	21	1.9	5.2	1.0	0.010	79115	72720	20m.pg16prebeta.cx7_1g
l.x
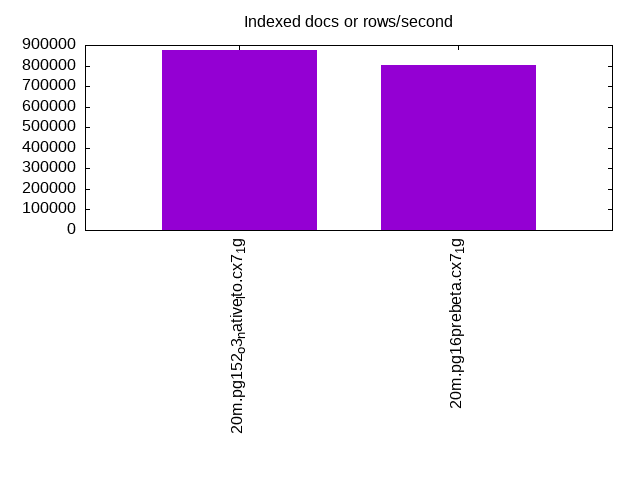
l.x: create secondary indexes.
Average throughput:
Performance metrics for the DBMS listed above. Some are normalized by throughput, others are not. Legend for results is here.
ips	qps	rps	rmbps	wps	wmbps	rpq	rkbpq	wpi	wkbpi	csps	cpups	cspq	cpupq	dbgb1	dbgb2	rss	maxop	p50	p99	tag
873913	0	0	0.0	586.3	235.9	0.000	0.000	0.001	0.276	1909	39.8	0.002	4	3.7	8.6	0.0	0.004	NA	NA	20m.pg152_o3_native_lto.cx7_1g
804000	0	0	0.0	474.1	182.6	0.000	0.000	0.001	0.233	1974	39.6	0.002	4	3.7	8.6	0.0	0.003	NA	NA	20m.pg16prebeta.cx7_1g
l.i1
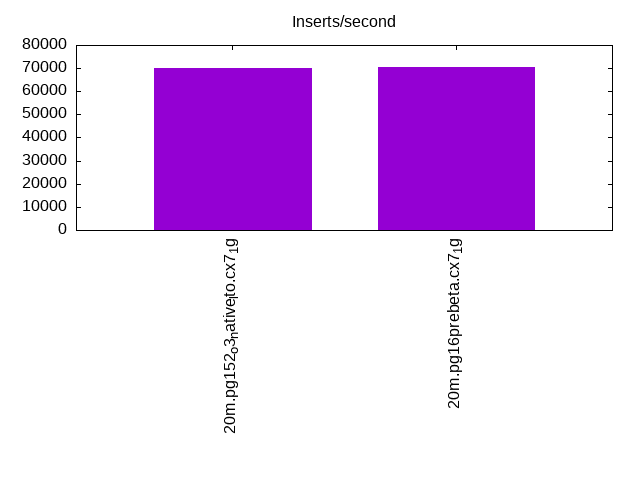
l.i1: continue load after secondary indexes created. Graphs for performance per 1-second interval are here.
Average throughput:
Insert response time histogram: each cell has the percentage of responses that take <= the time in the header and max is the max response time in seconds. For the max column values in the top 25% of the range have a red background and in the bottom 25% of the range have a green background. The red background is not used when the min value is within 80% of the max value.
| dbms | 256us | 1ms | 4ms | 16ms | 64ms | 256ms | 1s | 4s | 16s | gt | max |
|---|---|---|---|---|---|---|---|---|---|---|---|
| pg152_o3_native_lto.cx7_1g | 98.992 | 0.898 | 0.109 | 0.001 | 0.075 | ||||||
| pg16prebeta.cx7_1g | 99.004 | 0.883 | 0.112 | nonzero | 0.067 |
Performance metrics for the DBMS listed above. Some are normalized by throughput, others are not. Legend for results is here.
ips	qps	rps	rmbps	wps	wmbps	rpq	rkbpq	wpi	wkbpi	csps	cpups	cspq	cpupq	dbgb1	dbgb2	rss	maxop	p50	p99	tag
70175	0	116	0.7	54813.2	1010.9	0.002	0.011	0.781	14.751	25585	65.7	0.365	75	7.6	23.9	0.0	0.075	17930	5643	20m.pg152_o3_native_lto.cx7_1g
70422	0	116	0.7	55772.2	1020.8	0.002	0.011	0.792	14.843	24824	65.8	0.352	75	7.6	24.0	0.0	0.067	18038	5345	20m.pg16prebeta.cx7_1g
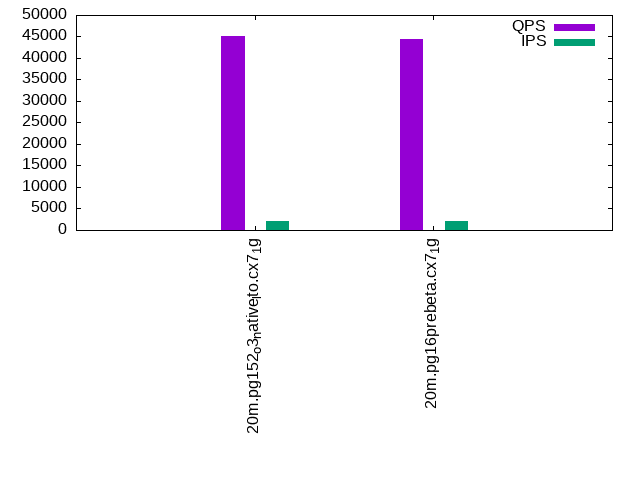
q100.1
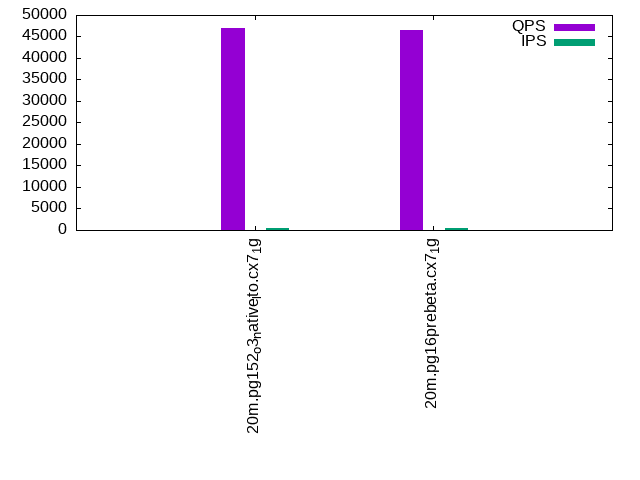
q100.1: range queries with 100 insert/s per client. Graphs for performance per 1-second interval are here.
Average throughput:
Query response time histogram: each cell has the percentage of responses that take <= the time in the header and max is the max response time in seconds. For max values in the top 25% of the range have a red background and in the bottom 25% of the range have a green background. The red background is not used when the min value is within 80% of the max value.
| dbms | 256us | 1ms | 4ms | 16ms | 64ms | 256ms | 1s | 4s | 16s | gt | max |
|---|---|---|---|---|---|---|---|---|---|---|---|
| pg152_o3_native_lto.cx7_1g | 99.983 | 0.011 | 0.005 | nonzero | 0.010 | ||||||
| pg16prebeta.cx7_1g | 99.983 | 0.012 | 0.005 | nonzero | 0.010 |
Insert response time histogram: each cell has the percentage of responses that take <= the time in the header and max is the max response time in seconds. For max values in the top 25% of the range have a red background and in the bottom 25% of the range have a green background. The red background is not used when the min value is within 80% of the max value.
| dbms | 256us | 1ms | 4ms | 16ms | 64ms | 256ms | 1s | 4s | 16s | gt | max |
|---|---|---|---|---|---|---|---|---|---|---|---|
| pg152_o3_native_lto.cx7_1g | 99.229 | 0.771 | 0.011 | ||||||||
| pg16prebeta.cx7_1g | 99.451 | 0.549 | 0.011 |
Performance metrics for the DBMS listed above. Some are normalized by throughput, others are not. Legend for results is here.
ips	qps	rps	rmbps	wps	wmbps	rpq	rkbpq	wpi	wkbpi	csps	cpups	cspq	cpupq	dbgb1	dbgb2	rss	maxop	p50	p99	tag
399	47035	10	0.1	1313.3	15.7	0.000	0.001	3.293	40.251	179317	50.5	3.812	86	7.8	23.2	0.0	0.010	11752	10628	20m.pg152_o3_native_lto.cx7_1g
399	46561	14	0.1	1319.7	15.8	0.000	0.002	3.309	40.607	177500	50.5	3.812	87	7.8	23.1	0.0	0.010	11779	10405	20m.pg16prebeta.cx7_1g
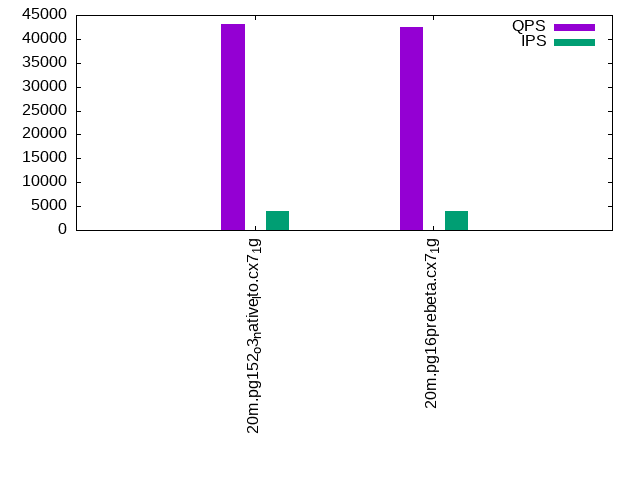
q500.1
q500.1: range queries with 500 insert/s per client. Graphs for performance per 1-second interval are here.
Average throughput:
Query response time histogram: each cell has the percentage of responses that take <= the time in the header and max is the max response time in seconds. For max values in the top 25% of the range have a red background and in the bottom 25% of the range have a green background. The red background is not used when the min value is within 80% of the max value.
| dbms | 256us | 1ms | 4ms | 16ms | 64ms | 256ms | 1s | 4s | 16s | gt | max |
|---|---|---|---|---|---|---|---|---|---|---|---|
| pg152_o3_native_lto.cx7_1g | 99.948 | 0.033 | 0.018 | 0.001 | nonzero | 0.020 | |||||
| pg16prebeta.cx7_1g | 99.948 | 0.034 | 0.017 | 0.001 | nonzero | 0.018 |
Insert response time histogram: each cell has the percentage of responses that take <= the time in the header and max is the max response time in seconds. For max values in the top 25% of the range have a red background and in the bottom 25% of the range have a green background. The red background is not used when the min value is within 80% of the max value.
| dbms | 256us | 1ms | 4ms | 16ms | 64ms | 256ms | 1s | 4s | 16s | gt | max |
|---|---|---|---|---|---|---|---|---|---|---|---|
| pg152_o3_native_lto.cx7_1g | 97.893 | 2.083 | 0.024 | 0.022 | |||||||
| pg16prebeta.cx7_1g | 97.421 | 2.550 | 0.029 | 0.027 |
Performance metrics for the DBMS listed above. Some are normalized by throughput, others are not. Legend for results is here.
ips	qps	rps	rmbps	wps	wmbps	rpq	rkbpq	wpi	wkbpi	csps	cpups	cspq	cpupq	dbgb1	dbgb2	rss	maxop	p50	p99	tag
1994	45155	55	0.4	5994.7	59.4	0.001	0.009	3.006	30.508	170838	52.0	3.783	92	9.4	20.7	0.0	0.020	11380	9526	20m.pg152_o3_native_lto.cx7_1g
1994	44473	47	0.4	5989.2	59.4	0.001	0.008	3.003	30.488	168216	51.9	3.782	93	9.4	20.7	0.0	0.018	11204	9558	20m.pg16prebeta.cx7_1g
q1000.1
q1000.1: range queries with 1000 insert/s per client. Graphs for performance per 1-second interval are here.
Average throughput:
Query response time histogram: each cell has the percentage of responses that take <= the time in the header and max is the max response time in seconds. For max values in the top 25% of the range have a red background and in the bottom 25% of the range have a green background. The red background is not used when the min value is within 80% of the max value.
| dbms | 256us | 1ms | 4ms | 16ms | 64ms | 256ms | 1s | 4s | 16s | gt | max |
|---|---|---|---|---|---|---|---|---|---|---|---|
| pg152_o3_native_lto.cx7_1g | 99.897 | 0.074 | 0.026 | 0.002 | nonzero | 0.036 | |||||
| pg16prebeta.cx7_1g | 99.888 | 0.081 | 0.028 | 0.003 | nonzero | 0.022 |
Insert response time histogram: each cell has the percentage of responses that take <= the time in the header and max is the max response time in seconds. For max values in the top 25% of the range have a red background and in the bottom 25% of the range have a green background. The red background is not used when the min value is within 80% of the max value.
| dbms | 256us | 1ms | 4ms | 16ms | 64ms | 256ms | 1s | 4s | 16s | gt | max |
|---|---|---|---|---|---|---|---|---|---|---|---|
| pg152_o3_native_lto.cx7_1g | 97.493 | 2.465 | 0.042 | 0.042 | |||||||
| pg16prebeta.cx7_1g | 96.540 | 3.401 | 0.058 | 0.001 | 0.081 |
Performance metrics for the DBMS listed above. Some are normalized by throughput, others are not. Legend for results is here.
ips	qps	rps	rmbps	wps	wmbps	rpq	rkbpq	wpi	wkbpi	csps	cpups	cspq	cpupq	dbgb1	dbgb2	rss	maxop	p50	p99	tag
3989	43029	66	0.5	11789.1	107.3	0.002	0.012	2.955	27.554	160367	53.8	3.727	100	11.9	22.0	0.0	0.036	10852	9238	20m.pg152_o3_native_lto.cx7_1g
3987	42570	81	0.6	11734.3	107.0	0.002	0.015	2.943	27.495	158723	53.8	3.729	101	11.9	22.0	0.0	0.022	10724	8970	20m.pg16prebeta.cx7_1g
l.i0
l.i0: load without secondary indexes
Performance metrics for all DBMS, not just the ones listed above. Some are normalized by throughput, others are not. Legend for results is here.
ips	qps	rps	rmbps	wps	wmbps	rpq	rkbpq	wpi	wkbpi	csps	cpups	cspq	cpupq	dbgb1	dbgb2	rss	maxop	p50	p99	tag
270270	0	0	0.0	506.9	125.2	0.000	0.000	0.002	0.474	27164	70.7	0.101	21	1.9	5.2	1.0	0.026	82436	11188	20m.pg152_o3_native_lto.cx7_1g
259740	0	0	0.0	492.2	119.9	0.000	0.000	0.002	0.473	26394	69.6	0.102	21	1.9	5.2	1.0	0.010	79115	72720	20m.pg16prebeta.cx7_1g
l.x
l.x: create secondary indexes
Performance metrics for all DBMS, not just the ones listed above. Some are normalized by throughput, others are not. Legend for results is here.
ips	qps	rps	rmbps	wps	wmbps	rpq	rkbpq	wpi	wkbpi	csps	cpups	cspq	cpupq	dbgb1	dbgb2	rss	maxop	p50	p99	tag
873913	0	0	0.0	586.3	235.9	0.000	0.000	0.001	0.276	1909	39.8	0.002	4	3.7	8.6	0.0	0.004	NA	NA	20m.pg152_o3_native_lto.cx7_1g
804000	0	0	0.0	474.1	182.6	0.000	0.000	0.001	0.233	1974	39.6	0.002	4	3.7	8.6	0.0	0.003	NA	NA	20m.pg16prebeta.cx7_1g
l.i1
l.i1: continue load after secondary indexes created
Performance metrics for all DBMS, not just the ones listed above. Some are normalized by throughput, others are not. Legend for results is here.
ips	qps	rps	rmbps	wps	wmbps	rpq	rkbpq	wpi	wkbpi	csps	cpups	cspq	cpupq	dbgb1	dbgb2	rss	maxop	p50	p99	tag
70175	0	116	0.7	54813.2	1010.9	0.002	0.011	0.781	14.751	25585	65.7	0.365	75	7.6	23.9	0.0	0.075	17930	5643	20m.pg152_o3_native_lto.cx7_1g
70422	0	116	0.7	55772.2	1020.8	0.002	0.011	0.792	14.843	24824	65.8	0.352	75	7.6	24.0	0.0	0.067	18038	5345	20m.pg16prebeta.cx7_1g
q100.1
q100.1: range queries with 100 insert/s per client
Performance metrics for all DBMS, not just the ones listed above. Some are normalized by throughput, others are not. Legend for results is here.
ips	qps	rps	rmbps	wps	wmbps	rpq	rkbpq	wpi	wkbpi	csps	cpups	cspq	cpupq	dbgb1	dbgb2	rss	maxop	p50	p99	tag
399	47035	10	0.1	1313.3	15.7	0.000	0.001	3.293	40.251	179317	50.5	3.812	86	7.8	23.2	0.0	0.010	11752	10628	20m.pg152_o3_native_lto.cx7_1g
399	46561	14	0.1	1319.7	15.8	0.000	0.002	3.309	40.607	177500	50.5	3.812	87	7.8	23.1	0.0	0.010	11779	10405	20m.pg16prebeta.cx7_1g
q500.1
q500.1: range queries with 500 insert/s per client
Performance metrics for all DBMS, not just the ones listed above. Some are normalized by throughput, others are not. Legend for results is here.
ips	qps	rps	rmbps	wps	wmbps	rpq	rkbpq	wpi	wkbpi	csps	cpups	cspq	cpupq	dbgb1	dbgb2	rss	maxop	p50	p99	tag
1994	45155	55	0.4	5994.7	59.4	0.001	0.009	3.006	30.508	170838	52.0	3.783	92	9.4	20.7	0.0	0.020	11380	9526	20m.pg152_o3_native_lto.cx7_1g
1994	44473	47	0.4	5989.2	59.4	0.001	0.008	3.003	30.488	168216	51.9	3.782	93	9.4	20.7	0.0	0.018	11204	9558	20m.pg16prebeta.cx7_1g
q1000.1
q1000.1: range queries with 1000 insert/s per client
Performance metrics for all DBMS, not just the ones listed above. Some are normalized by throughput, others are not. Legend for results is here.
ips	qps	rps	rmbps	wps	wmbps	rpq	rkbpq	wpi	wkbpi	csps	cpups	cspq	cpupq	dbgb1	dbgb2	rss	maxop	p50	p99	tag
3989	43029	66	0.5	11789.1	107.3	0.002	0.012	2.955	27.554	160367	53.8	3.727	100	11.9	22.0	0.0	0.036	10852	9238	20m.pg152_o3_native_lto.cx7_1g
3987	42570	81	0.6	11734.3	107.0	0.002	0.015	2.943	27.495	158723	53.8	3.729	101	11.9	22.0	0.0	0.022	10724	8970	20m.pg16prebeta.cx7_1g
l.i0
- l.i0: load without secondary indexes
- Legend for results is here.
- Each entry lists the percentage of responses that fit in that bucket (slower than max time for previous bucket, faster than min time for next bucket).
Insert response time histogram
256us	1ms	4ms	16ms	64ms	256ms	1s	4s	16s	gt	max	tag
0.000	0.005	99.933	0.062	0.001	0.000	0.000	0.000	0.000	0.000	0.026	pg152_o3_native_lto.cx7_1g
0.000	0.000	99.947	0.053	0.000	0.000	0.000	0.000	0.000	0.000	0.010	pg16prebeta.cx7_1g
l.x
- l.x: create secondary indexes
- Legend for results is here.
- Each entry lists the percentage of responses that fit in that bucket (slower than max time for previous bucket, faster than min time for next bucket).
TODO - determine whether there is data for create index response time
l.i1
- l.i1: continue load after secondary indexes created
- Legend for results is here.
- Each entry lists the percentage of responses that fit in that bucket (slower than max time for previous bucket, faster than min time for next bucket).
Insert response time histogram
256us	1ms	4ms	16ms	64ms	256ms	1s	4s	16s	gt	max	tag
0.000	0.000	98.992	0.898	0.109	0.001	0.000	0.000	0.000	0.000	0.075	pg152_o3_native_lto.cx7_1g
0.000	0.000	99.004	0.883	0.112	nonzero	0.000	0.000	0.000	0.000	0.067	pg16prebeta.cx7_1g
q100.1
- q100.1: range queries with 100 insert/s per client
- Legend for results is here.
- Each entry lists the percentage of responses that fit in that bucket (slower than max time for previous bucket, faster than min time for next bucket).
Query response time histogram
256us	1ms	4ms	16ms	64ms	256ms	1s	4s	16s	gt	max	tag
99.983	0.011	0.005	nonzero	0.000	0.000	0.000	0.000	0.000	0.000	0.010	pg152_o3_native_lto.cx7_1g
99.983	0.012	0.005	nonzero	0.000	0.000	0.000	0.000	0.000	0.000	0.010	pg16prebeta.cx7_1g
Insert response time histogram
256us	1ms	4ms	16ms	64ms	256ms	1s	4s	16s	gt	max	tag
0.000	0.000	99.229	0.771	0.000	0.000	0.000	0.000	0.000	0.000	0.011	pg152_o3_native_lto.cx7_1g
0.000	0.000	99.451	0.549	0.000	0.000	0.000	0.000	0.000	0.000	0.011	pg16prebeta.cx7_1g
q500.1
- q500.1: range queries with 500 insert/s per client
- Legend for results is here.
- Each entry lists the percentage of responses that fit in that bucket (slower than max time for previous bucket, faster than min time for next bucket).
Query response time histogram
256us	1ms	4ms	16ms	64ms	256ms	1s	4s	16s	gt	max	tag
99.948	0.033	0.018	0.001	nonzero	0.000	0.000	0.000	0.000	0.000	0.020	pg152_o3_native_lto.cx7_1g
99.948	0.034	0.017	0.001	nonzero	0.000	0.000	0.000	0.000	0.000	0.018	pg16prebeta.cx7_1g
Insert response time histogram
256us	1ms	4ms	16ms	64ms	256ms	1s	4s	16s	gt	max	tag
0.000	0.000	97.893	2.083	0.024	0.000	0.000	0.000	0.000	0.000	0.022	pg152_o3_native_lto.cx7_1g
0.000	0.000	97.421	2.550	0.029	0.000	0.000	0.000	0.000	0.000	0.027	pg16prebeta.cx7_1g
q1000.1
- q1000.1: range queries with 1000 insert/s per client
- Legend for results is here.
- Each entry lists the percentage of responses that fit in that bucket (slower than max time for previous bucket, faster than min time for next bucket).
Query response time histogram
256us	1ms	4ms	16ms	64ms	256ms	1s	4s	16s	gt	max	tag
99.897	0.074	0.026	0.002	nonzero	0.000	0.000	0.000	0.000	0.000	0.036	pg152_o3_native_lto.cx7_1g
99.888	0.081	0.028	0.003	nonzero	0.000	0.000	0.000	0.000	0.000	0.022	pg16prebeta.cx7_1g
Insert response time histogram
256us	1ms	4ms	16ms	64ms	256ms	1s	4s	16s	gt	max	tag
0.000	0.000	97.493	2.465	0.042	0.000	0.000	0.000	0.000	0.000	0.042	pg152_o3_native_lto.cx7_1g
0.000	0.000	96.540	3.401	0.058	0.001	0.000	0.000	0.000	0.000	0.081	pg16prebeta.cx7_1g