Introduction
This is a report for the insert benchmark with 20M docs and 1 client(s). It is generated by scripts (bash, awk, sed) and Tufte might not be impressed. An overview of the insert benchmark is here and a short update is here. Below, by DBMS, I mean DBMS+version.config. An example is my8020.c10b40 where my means MySQL, 8020 is version 8.0.20 and c10b40 is the name for the configuration file.
The test server has 8 AMD cores, 16G RAM and an NVMe SSD. It is described here as the Beelink. The benchmark was run with 1 client and there were 1 or 2 connections per client (1 for queries, 1 for inserts). It uses 1 table. It loads 20M rows without secondary indexes, creates secondary indexes, loads another 20M rows then does 3 read+write tests for one hour each that do queries as fast as possible with 100, 500 and then 1000 writes/second/client concurrent with the queries. The database is cached by OS but not by Postgres. Clients and the DBMS share one server. The per-database configs are in the per-database subdirectories here.
The tested DBMS are:
- pg152_o3_native_lto.cx7_1g -Postgres 15.2, the cx7_1g config and the build used: -O3 -march=native -mtune=native
- pg16prebeta - Postgres 16 from the main branch at git sha 1ab763fc2, the cx7_1g config and the build used: -O3 -march=native -mtune=native
Contents
- Summary
- l.i0: load without secondary indexes
- l.x: create secondary indexes
- l.i1: continue load after secondary indexes created
- q100.1: range queries with 100 insert/s per client
- q500.1: range queries with 500 insert/s per client
- q1000.1: range queries with 1000 insert/s per client
Summary
The numbers are inserts/s for l.i0 and l.i1, indexed docs (or rows) /s for l.x and queries/s for q*.2. The values are the average rate over the entire test for inserts (IPS) and queries (QPS). The range of values for IPS and QPS is split into 3 parts: bottom 25%, middle 50%, top 25%. Values in the bottom 25% have a red background, values in the top 25% have a green background and values in the middle have no color. A gray background is used for values that can be ignored because the DBMS did not sustain the target insert rate. Red backgrounds are not used when the minimum value is within 80% of the max value.
| dbms | l.i0 | l.x | l.i1 | q100.1 | q500.1 | q1000.1 |
|---|---|---|---|---|---|---|
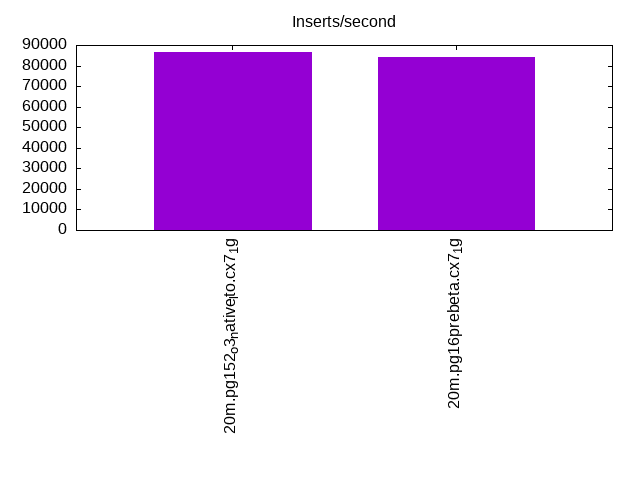
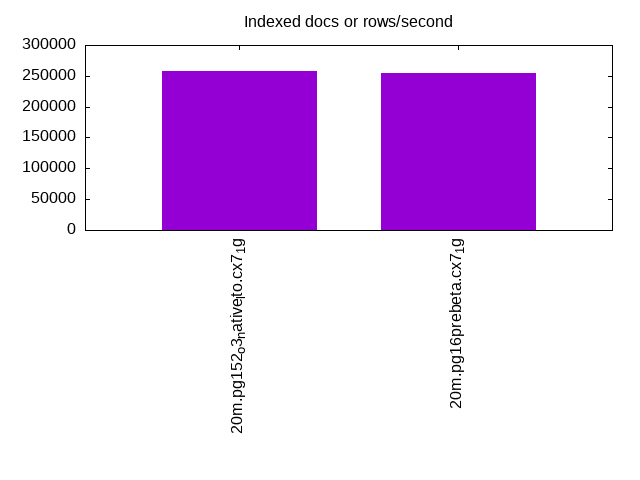
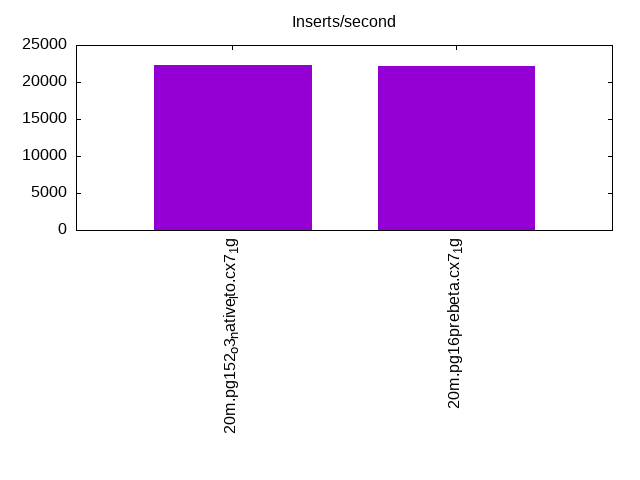
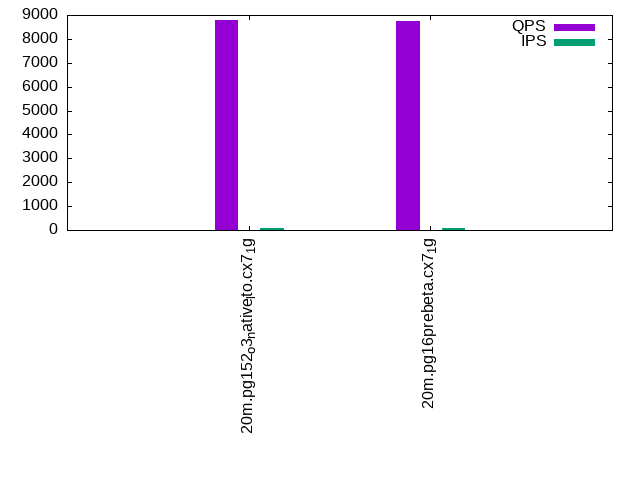
| 20m.pg152_o3_native_lto.cx7_1g | 86580 | 257692 | 22296 | 8791 | 8598 | 8802 |
| 20m.pg16prebeta.cx7_1g | 84388 | 254430 | 22173 | 8750 | 8659 | 8642 |
This table has relative throughput, throughput for the DBMS relative to the DBMS in the first line, using the absolute throughput from the previous table.
| dbms | l.i0 | l.x | l.i1 | q100.1 | q500.1 | q1000.1 |
|---|---|---|---|---|---|---|
| 20m.pg152_o3_native_lto.cx7_1g | 1.00 | 1.00 | 1.00 | 1.00 | 1.00 | 1.00 |
| 20m.pg16prebeta.cx7_1g | 0.97 | 0.99 | 0.99 | 1.00 | 1.01 | 0.98 |
This lists the average rate of inserts/s for the tests that do inserts concurrent with queries. For such tests the query rate is listed in the table above. The read+write tests are setup so that the insert rate should match the target rate every second. Cells that are not at least 95% of the target have a red background to indicate a failure to satisfy the target.
| dbms | q100.1 | q500.1 | q1000.1 |
|---|---|---|---|
| pg152_o3_native_lto.cx7_1g | 100 | 499 | 998 |
| pg16prebeta.cx7_1g | 100 | 499 | 998 |
| target | 100 | 500 | 1000 |
l.i0
l.i0: load without secondary indexes. Graphs for performance per 1-second interval are here.
Average throughput:
Insert response time histogram: each cell has the percentage of responses that take <= the time in the header and max is the max response time in seconds. For the max column values in the top 25% of the range have a red background and in the bottom 25% of the range have a green background. The red background is not used when the min value is within 80% of the max value.
| dbms | 256us | 1ms | 4ms | 16ms | 64ms | 256ms | 1s | 4s | 16s | gt | max |
|---|---|---|---|---|---|---|---|---|---|---|---|
| pg152_o3_native_lto.cx7_1g | 0.255 | 99.744 | 0.001 | 0.010 | |||||||
| pg16prebeta.cx7_1g | 99.998 | 0.002 | 0.006 |
Performance metrics for the DBMS listed above. Some are normalized by throughput, others are not. Legend for results is here.
ips	qps	rps	rmbps	wps	wmbps	rpq	rkbpq	wpi	wkbpi	csps	cpups	cspq	cpupq	dbgb1	dbgb2	rss	maxop	p50	p99	tag
86580	0	0	0.0	168.9	41.1	0.000	0.000	0.002	0.486	10454	22.6	0.121	21	1.9	5.2	0.0	0.010	86981	76160	20m.pg152_o3_native_lto.cx7_1g
84388	0	0	0.0	176.8	39.9	0.000	0.000	0.002	0.484	10246	23.7	0.121	22	1.9	5.2	0.0	0.006	84308	74218	20m.pg16prebeta.cx7_1g
l.x
l.x: create secondary indexes.
Average throughput:
Performance metrics for the DBMS listed above. Some are normalized by throughput, others are not. Legend for results is here.
ips	qps	rps	rmbps	wps	wmbps	rpq	rkbpq	wpi	wkbpi	csps	cpups	cspq	cpupq	dbgb1	dbgb2	rss	maxop	p50	p99	tag
257692	0	0	0.0	152.6	54.0	0.000	0.000	0.001	0.214	738	11.9	0.003	4	3.7	8.6	0.0	0.003	NA	NA	20m.pg152_o3_native_lto.cx7_1g
254430	0	0	0.0	128.9	48.2	0.000	0.000	0.001	0.194	813	12.6	0.003	4	3.7	8.6	0.0	0.003	NA	NA	20m.pg16prebeta.cx7_1g
l.i1
l.i1: continue load after secondary indexes created. Graphs for performance per 1-second interval are here.
Average throughput:
Insert response time histogram: each cell has the percentage of responses that take <= the time in the header and max is the max response time in seconds. For the max column values in the top 25% of the range have a red background and in the bottom 25% of the range have a green background. The red background is not used when the min value is within 80% of the max value.
| dbms | 256us | 1ms | 4ms | 16ms | 64ms | 256ms | 1s | 4s | 16s | gt | max |
|---|---|---|---|---|---|---|---|---|---|---|---|
| pg152_o3_native_lto.cx7_1g | 99.989 | 0.011 | nonzero | 0.019 | |||||||
| pg16prebeta.cx7_1g | 99.984 | 0.015 | 0.001 | 0.059 |
Performance metrics for the DBMS listed above. Some are normalized by throughput, others are not. Legend for results is here.
ips	qps	rps	rmbps	wps	wmbps	rpq	rkbpq	wpi	wkbpi	csps	cpups	cspq	cpupq	dbgb1	dbgb2	rss	maxop	p50	p99	tag
22296	0	70	0.5	23146.9	277.8	0.003	0.022	1.038	12.757	7271	20.1	0.326	72	8.2	18.3	0.0	0.019	22575	17679	20m.pg152_o3_native_lto.cx7_1g
22173	0	80	0.6	23163.6	274.7	0.004	0.027	1.045	12.684	7212	20.1	0.325	73	8.2	17.5	0.0	0.059	22481	17477	20m.pg16prebeta.cx7_1g
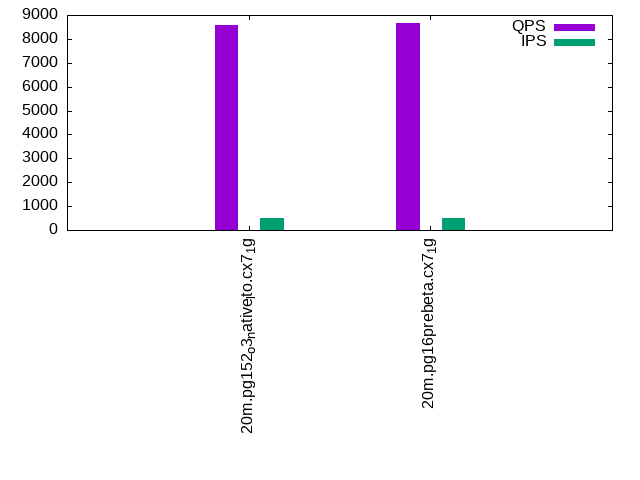
q100.1
q100.1: range queries with 100 insert/s per client. Graphs for performance per 1-second interval are here.
Average throughput:
Query response time histogram: each cell has the percentage of responses that take <= the time in the header and max is the max response time in seconds. For max values in the top 25% of the range have a red background and in the bottom 25% of the range have a green background. The red background is not used when the min value is within 80% of the max value.
| dbms | 256us | 1ms | 4ms | 16ms | 64ms | 256ms | 1s | 4s | 16s | gt | max |
|---|---|---|---|---|---|---|---|---|---|---|---|
| pg152_o3_native_lto.cx7_1g | 99.948 | 0.051 | 0.001 | nonzero | 0.010 | ||||||
| pg16prebeta.cx7_1g | 99.957 | 0.042 | 0.001 | nonzero | 0.010 |
Insert response time histogram: each cell has the percentage of responses that take <= the time in the header and max is the max response time in seconds. For max values in the top 25% of the range have a red background and in the bottom 25% of the range have a green background. The red background is not used when the min value is within 80% of the max value.
| dbms | 256us | 1ms | 4ms | 16ms | 64ms | 256ms | 1s | 4s | 16s | gt | max |
|---|---|---|---|---|---|---|---|---|---|---|---|
| pg152_o3_native_lto.cx7_1g | 99.889 | 0.111 | 0.012 | ||||||||
| pg16prebeta.cx7_1g | 99.750 | 0.250 | 0.012 |
Performance metrics for the DBMS listed above. Some are normalized by throughput, others are not. Legend for results is here.
ips	qps	rps	rmbps	wps	wmbps	rpq	rkbpq	wpi	wkbpi	csps	cpups	cspq	cpupq	dbgb1	dbgb2	rss	maxop	p50	p99	tag
100	8791	2	0.0	402.4	5.1	0.000	0.001	4.036	52.224	33750	13.1	3.839	119	8.2	16.4	0.0	0.010	8517	8389	20m.pg152_o3_native_lto.cx7_1g
100	8750	1	0.0	357.3	4.4	0.000	0.001	3.584	45.263	33582	13.3	3.838	122	8.2	15.9	0.0	0.010	8421	8149	20m.pg16prebeta.cx7_1g
q500.1
q500.1: range queries with 500 insert/s per client. Graphs for performance per 1-second interval are here.
Average throughput:
Query response time histogram: each cell has the percentage of responses that take <= the time in the header and max is the max response time in seconds. For max values in the top 25% of the range have a red background and in the bottom 25% of the range have a green background. The red background is not used when the min value is within 80% of the max value.
| dbms | 256us | 1ms | 4ms | 16ms | 64ms | 256ms | 1s | 4s | 16s | gt | max |
|---|---|---|---|---|---|---|---|---|---|---|---|
| pg152_o3_native_lto.cx7_1g | 99.972 | 0.028 | nonzero | nonzero | 0.004 | ||||||
| pg16prebeta.cx7_1g | 99.967 | 0.033 | nonzero | nonzero | 0.006 |
Insert response time histogram: each cell has the percentage of responses that take <= the time in the header and max is the max response time in seconds. For max values in the top 25% of the range have a red background and in the bottom 25% of the range have a green background. The red background is not used when the min value is within 80% of the max value.
| dbms | 256us | 1ms | 4ms | 16ms | 64ms | 256ms | 1s | 4s | 16s | gt | max |
|---|---|---|---|---|---|---|---|---|---|---|---|
| pg152_o3_native_lto.cx7_1g | 99.783 | 0.217 | 0.012 | ||||||||
| pg16prebeta.cx7_1g | 99.767 | 0.233 | 0.012 |
Performance metrics for the DBMS listed above. Some are normalized by throughput, others are not. Legend for results is here.
ips	qps	rps	rmbps	wps	wmbps	rpq	rkbpq	wpi	wkbpi	csps	cpups	cspq	cpupq	dbgb1	dbgb2	rss	maxop	p50	p99	tag
499	8598	10	0.1	1367.0	16.7	0.001	0.009	2.740	34.343	33131	13.9	3.853	129	8.4	13.9	0.0	0.004	8294	8213	20m.pg152_o3_native_lto.cx7_1g
499	8659	11	0.1	1368.0	16.8	0.001	0.009	2.741	34.415	33351	13.8	3.852	127	8.4	13.8	0.0	0.006	8309	8196	20m.pg16prebeta.cx7_1g
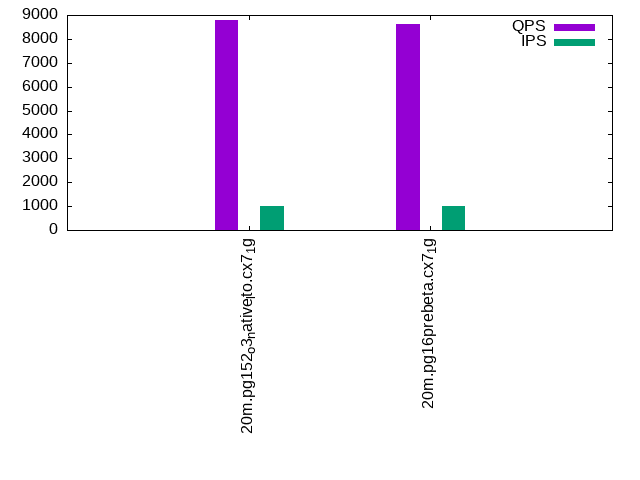
q1000.1
q1000.1: range queries with 1000 insert/s per client. Graphs for performance per 1-second interval are here.
Average throughput:
Query response time histogram: each cell has the percentage of responses that take <= the time in the header and max is the max response time in seconds. For max values in the top 25% of the range have a red background and in the bottom 25% of the range have a green background. The red background is not used when the min value is within 80% of the max value.
| dbms | 256us | 1ms | 4ms | 16ms | 64ms | 256ms | 1s | 4s | 16s | gt | max |
|---|---|---|---|---|---|---|---|---|---|---|---|
| pg152_o3_native_lto.cx7_1g | 99.973 | 0.027 | nonzero | nonzero | 0.010 | ||||||
| pg16prebeta.cx7_1g | 99.970 | 0.030 | nonzero | nonzero | 0.004 |
Insert response time histogram: each cell has the percentage of responses that take <= the time in the header and max is the max response time in seconds. For max values in the top 25% of the range have a red background and in the bottom 25% of the range have a green background. The red background is not used when the min value is within 80% of the max value.
| dbms | 256us | 1ms | 4ms | 16ms | 64ms | 256ms | 1s | 4s | 16s | gt | max |
|---|---|---|---|---|---|---|---|---|---|---|---|
| pg152_o3_native_lto.cx7_1g | 99.483 | 0.517 | 0.012 | ||||||||
| pg16prebeta.cx7_1g | 99.483 | 0.517 | 0.012 |
Performance metrics for the DBMS listed above. Some are normalized by throughput, others are not. Legend for results is here.
ips	qps	rps	rmbps	wps	wmbps	rpq	rkbpq	wpi	wkbpi	csps	cpups	cspq	cpupq	dbgb1	dbgb2	rss	maxop	p50	p99	tag
998	8802	3	0.0	2659.5	29.2	0.000	0.002	2.664	29.977	34078	14.2	3.872	129	9.0	14.2	0.0	0.010	8422	8309	20m.pg152_o3_native_lto.cx7_1g
998	8642	2	0.0	2655.1	29.2	0.000	0.001	2.660	29.965	33467	14.2	3.873	131	9.0	14.1	0.0	0.004	8247	8101	20m.pg16prebeta.cx7_1g
l.i0
l.i0: load without secondary indexes
Performance metrics for all DBMS, not just the ones listed above. Some are normalized by throughput, others are not. Legend for results is here.
ips	qps	rps	rmbps	wps	wmbps	rpq	rkbpq	wpi	wkbpi	csps	cpups	cspq	cpupq	dbgb1	dbgb2	rss	maxop	p50	p99	tag
86580	0	0	0.0	168.9	41.1	0.000	0.000	0.002	0.486	10454	22.6	0.121	21	1.9	5.2	0.0	0.010	86981	76160	20m.pg152_o3_native_lto.cx7_1g
84388	0	0	0.0	176.8	39.9	0.000	0.000	0.002	0.484	10246	23.7	0.121	22	1.9	5.2	0.0	0.006	84308	74218	20m.pg16prebeta.cx7_1g
l.x
l.x: create secondary indexes
Performance metrics for all DBMS, not just the ones listed above. Some are normalized by throughput, others are not. Legend for results is here.
ips	qps	rps	rmbps	wps	wmbps	rpq	rkbpq	wpi	wkbpi	csps	cpups	cspq	cpupq	dbgb1	dbgb2	rss	maxop	p50	p99	tag
257692	0	0	0.0	152.6	54.0	0.000	0.000	0.001	0.214	738	11.9	0.003	4	3.7	8.6	0.0	0.003	NA	NA	20m.pg152_o3_native_lto.cx7_1g
254430	0	0	0.0	128.9	48.2	0.000	0.000	0.001	0.194	813	12.6	0.003	4	3.7	8.6	0.0	0.003	NA	NA	20m.pg16prebeta.cx7_1g
l.i1
l.i1: continue load after secondary indexes created
Performance metrics for all DBMS, not just the ones listed above. Some are normalized by throughput, others are not. Legend for results is here.
ips	qps	rps	rmbps	wps	wmbps	rpq	rkbpq	wpi	wkbpi	csps	cpups	cspq	cpupq	dbgb1	dbgb2	rss	maxop	p50	p99	tag
22296	0	70	0.5	23146.9	277.8	0.003	0.022	1.038	12.757	7271	20.1	0.326	72	8.2	18.3	0.0	0.019	22575	17679	20m.pg152_o3_native_lto.cx7_1g
22173	0	80	0.6	23163.6	274.7	0.004	0.027	1.045	12.684	7212	20.1	0.325	73	8.2	17.5	0.0	0.059	22481	17477	20m.pg16prebeta.cx7_1g
q100.1
q100.1: range queries with 100 insert/s per client
Performance metrics for all DBMS, not just the ones listed above. Some are normalized by throughput, others are not. Legend for results is here.
ips	qps	rps	rmbps	wps	wmbps	rpq	rkbpq	wpi	wkbpi	csps	cpups	cspq	cpupq	dbgb1	dbgb2	rss	maxop	p50	p99	tag
100	8791	2	0.0	402.4	5.1	0.000	0.001	4.036	52.224	33750	13.1	3.839	119	8.2	16.4	0.0	0.010	8517	8389	20m.pg152_o3_native_lto.cx7_1g
100	8750	1	0.0	357.3	4.4	0.000	0.001	3.584	45.263	33582	13.3	3.838	122	8.2	15.9	0.0	0.010	8421	8149	20m.pg16prebeta.cx7_1g
q500.1
q500.1: range queries with 500 insert/s per client
Performance metrics for all DBMS, not just the ones listed above. Some are normalized by throughput, others are not. Legend for results is here.
ips	qps	rps	rmbps	wps	wmbps	rpq	rkbpq	wpi	wkbpi	csps	cpups	cspq	cpupq	dbgb1	dbgb2	rss	maxop	p50	p99	tag
499	8598	10	0.1	1367.0	16.7	0.001	0.009	2.740	34.343	33131	13.9	3.853	129	8.4	13.9	0.0	0.004	8294	8213	20m.pg152_o3_native_lto.cx7_1g
499	8659	11	0.1	1368.0	16.8	0.001	0.009	2.741	34.415	33351	13.8	3.852	127	8.4	13.8	0.0	0.006	8309	8196	20m.pg16prebeta.cx7_1g
q1000.1
q1000.1: range queries with 1000 insert/s per client
Performance metrics for all DBMS, not just the ones listed above. Some are normalized by throughput, others are not. Legend for results is here.
ips	qps	rps	rmbps	wps	wmbps	rpq	rkbpq	wpi	wkbpi	csps	cpups	cspq	cpupq	dbgb1	dbgb2	rss	maxop	p50	p99	tag
998	8802	3	0.0	2659.5	29.2	0.000	0.002	2.664	29.977	34078	14.2	3.872	129	9.0	14.2	0.0	0.010	8422	8309	20m.pg152_o3_native_lto.cx7_1g
998	8642	2	0.0	2655.1	29.2	0.000	0.001	2.660	29.965	33467	14.2	3.873	131	9.0	14.1	0.0	0.004	8247	8101	20m.pg16prebeta.cx7_1g
l.i0
- l.i0: load without secondary indexes
- Legend for results is here.
- Each entry lists the percentage of responses that fit in that bucket (slower than max time for previous bucket, faster than min time for next bucket).
Insert response time histogram
256us	1ms	4ms	16ms	64ms	256ms	1s	4s	16s	gt	max	tag
0.000	0.255	99.744	0.001	0.000	0.000	0.000	0.000	0.000	0.000	0.010	pg152_o3_native_lto.cx7_1g
0.000	0.000	99.998	0.002	0.000	0.000	0.000	0.000	0.000	0.000	0.006	pg16prebeta.cx7_1g
l.x
- l.x: create secondary indexes
- Legend for results is here.
- Each entry lists the percentage of responses that fit in that bucket (slower than max time for previous bucket, faster than min time for next bucket).
TODO - determine whether there is data for create index response time
l.i1
- l.i1: continue load after secondary indexes created
- Legend for results is here.
- Each entry lists the percentage of responses that fit in that bucket (slower than max time for previous bucket, faster than min time for next bucket).
Insert response time histogram
256us	1ms	4ms	16ms	64ms	256ms	1s	4s	16s	gt	max	tag
0.000	0.000	99.989	0.011	nonzero	0.000	0.000	0.000	0.000	0.000	0.019	pg152_o3_native_lto.cx7_1g
0.000	0.000	99.984	0.015	0.001	0.000	0.000	0.000	0.000	0.000	0.059	pg16prebeta.cx7_1g
q100.1
- q100.1: range queries with 100 insert/s per client
- Legend for results is here.
- Each entry lists the percentage of responses that fit in that bucket (slower than max time for previous bucket, faster than min time for next bucket).
Query response time histogram
256us	1ms	4ms	16ms	64ms	256ms	1s	4s	16s	gt	max	tag
99.948	0.051	0.001	nonzero	0.000	0.000	0.000	0.000	0.000	0.000	0.010	pg152_o3_native_lto.cx7_1g
99.957	0.042	0.001	nonzero	0.000	0.000	0.000	0.000	0.000	0.000	0.010	pg16prebeta.cx7_1g
Insert response time histogram
256us	1ms	4ms	16ms	64ms	256ms	1s	4s	16s	gt	max	tag
0.000	0.000	99.889	0.111	0.000	0.000	0.000	0.000	0.000	0.000	0.012	pg152_o3_native_lto.cx7_1g
0.000	0.000	99.750	0.250	0.000	0.000	0.000	0.000	0.000	0.000	0.012	pg16prebeta.cx7_1g
q500.1
- q500.1: range queries with 500 insert/s per client
- Legend for results is here.
- Each entry lists the percentage of responses that fit in that bucket (slower than max time for previous bucket, faster than min time for next bucket).
Query response time histogram
256us	1ms	4ms	16ms	64ms	256ms	1s	4s	16s	gt	max	tag
99.972	0.028	nonzero	nonzero	0.000	0.000	0.000	0.000	0.000	0.000	0.004	pg152_o3_native_lto.cx7_1g
99.967	0.033	nonzero	nonzero	0.000	0.000	0.000	0.000	0.000	0.000	0.006	pg16prebeta.cx7_1g
Insert response time histogram
256us	1ms	4ms	16ms	64ms	256ms	1s	4s	16s	gt	max	tag
0.000	0.000	99.783	0.217	0.000	0.000	0.000	0.000	0.000	0.000	0.012	pg152_o3_native_lto.cx7_1g
0.000	0.000	99.767	0.233	0.000	0.000	0.000	0.000	0.000	0.000	0.012	pg16prebeta.cx7_1g
q1000.1
- q1000.1: range queries with 1000 insert/s per client
- Legend for results is here.
- Each entry lists the percentage of responses that fit in that bucket (slower than max time for previous bucket, faster than min time for next bucket).
Query response time histogram
256us	1ms	4ms	16ms	64ms	256ms	1s	4s	16s	gt	max	tag
99.973	0.027	nonzero	nonzero	0.000	0.000	0.000	0.000	0.000	0.000	0.010	pg152_o3_native_lto.cx7_1g
99.970	0.030	nonzero	nonzero	0.000	0.000	0.000	0.000	0.000	0.000	0.004	pg16prebeta.cx7_1g
Insert response time histogram
256us	1ms	4ms	16ms	64ms	256ms	1s	4s	16s	gt	max	tag
0.000	0.000	99.483	0.517	0.000	0.000	0.000	0.000	0.000	0.000	0.012	pg152_o3_native_lto.cx7_1g
0.000	0.000	99.483	0.517	0.000	0.000	0.000	0.000	0.000	0.000	0.012	pg16prebeta.cx7_1g