Introduction
This is a report for the insert benchmark with 20M docs and 4 client(s). It is generated by scripts (bash, awk, sed) and Tufte might not be impressed. An overview of the insert benchmark is here and a short update is here. Below, by DBMS, I mean DBMS+version.config. An example is my8020.c10b40 where my means MySQL, 8020 is version 8.0.20 and c10b40 is the name for the configuration file.
The test server has 8 AMD cores, 16G RAM and an NVMe SSD. It is described here as the Beelink. The benchmark was run with 4 clients and there were 1 or 2 connections per client (1 for queries, 1 for inserts). It uses 1 table. It loads 20M rows without secondary indexes, creates secondary indexes, loads another 20M rows then does 3 read+write tests for one hour each that do queries as fast as possible with 100, 500 and then 1000 writes/second/client concurrent with the queries. The database is cached by the storage engine and the only IO is for writes. Clients and the DBMS share one server. The per-database configs are in the per-database subdirectories here.
The tested DBMS are:
- pg151_def.cx7 - Postgres 15.1, the cx7 config and the build used: -O2
- pg151_o2_nofp.cx7 - Postgres 15.1, the cx7 config and the build used: -O2 -no-omit-frame-pointer
- pg151_o3.cx7 - Postgres 15.1, the cx7 config and the build used: -O3
- pg151_o3_native.cx7 - Postgres 15.1, the cx7 config and the build used: -O3 -march=native -mtune=native
- pg151_o3_native_lto.cx7 - Postgres 15.1, the cx7 config and the build used: -O3 -march=native -mtune=native and -flto
Contents
- Summary
- l.i0: load without secondary indexes
- l.x: create secondary indexes
- l.i1: continue load after secondary indexes created
- q100.1: range queries with 100 insert/s per client
- q500.1: range queries with 500 insert/s per client
- q1000.1: range queries with 1000 insert/s per client
Summary
The numbers are inserts/s for l.i0 and l.i1, indexed docs (or rows) /s for l.x and queries/s for q*.2. The values are the average rate over the entire test for inserts (IPS) and queries (QPS). The range of values for IPS and QPS is split into 3 parts: bottom 25%, middle 50%, top 25%. Values in the bottom 25% have a red background, values in the top 25% have a green background and values in the middle have no color. A gray background is used for values that can be ignored because the DBMS did not sustain the target insert rate. Red backgrounds are not used when the minimum value is within 80% of the max value.
| dbms | l.i0 | l.x | l.i1 | q100.1 | q500.1 | q1000.1 |
|---|---|---|---|---|---|---|
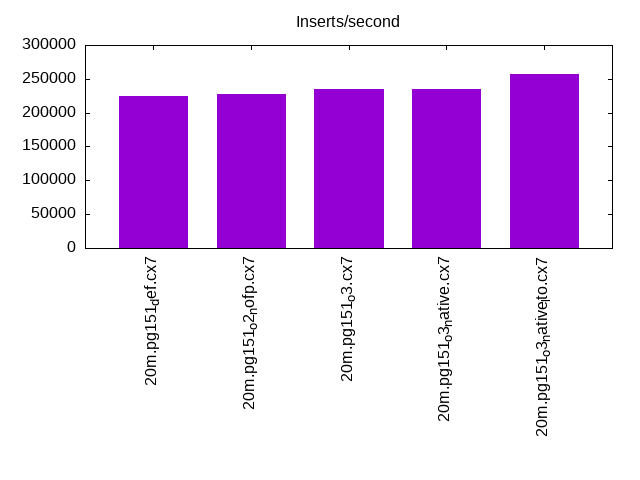
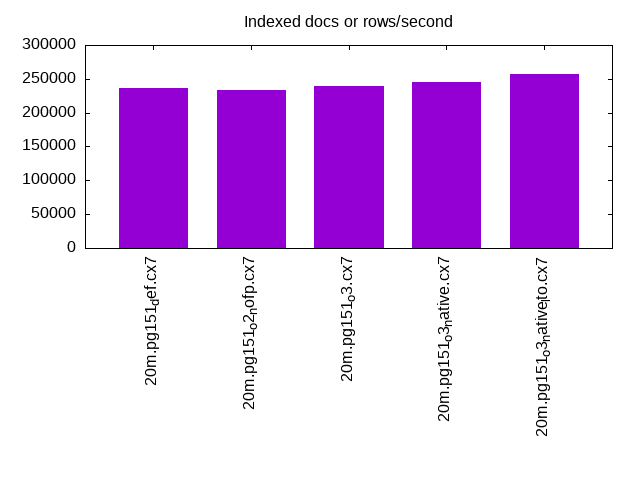
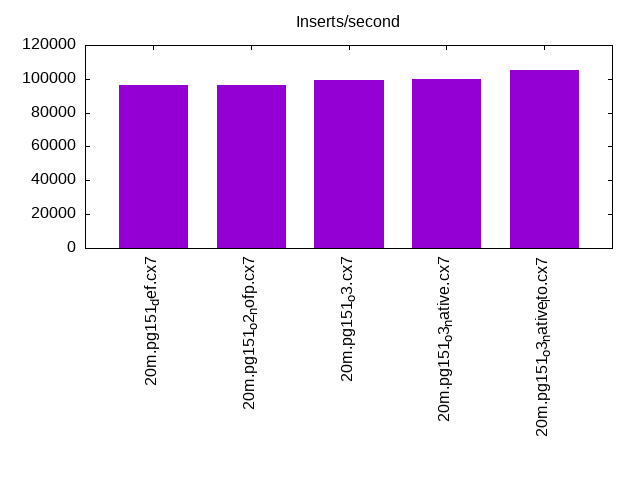
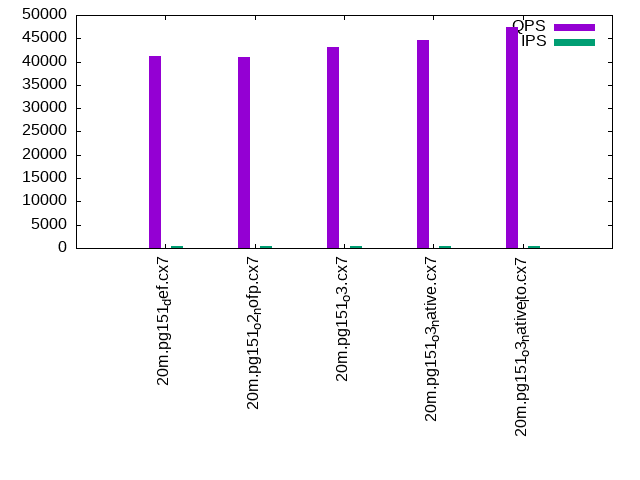
| 20m.pg151_def.cx7 | 224719 | 236470 | 96154 | 41165 | 40418 | 40385 |
| 20m.pg151_o2_nofp.cx7 | 227273 | 233721 | 96618 | 41024 | 39933 | 40137 |
| 20m.pg151_o3.cx7 | 235294 | 239286 | 99502 | 43204 | 42448 | 42232 |
| 20m.pg151_o3_native.cx7 | 235294 | 245122 | 100000 | 44736 | 43910 | 43123 |
| 20m.pg151_o3_native_lto.cx7 | 256410 | 257692 | 105263 | 47361 | 46330 | 45924 |
This table has relative throughput, throughput for the DBMS relative to the DBMS in the first line, using the absolute throughput from the previous table.
| dbms | l.i0 | l.x | l.i1 | q100.1 | q500.1 | q1000.1 |
|---|---|---|---|---|---|---|
| 20m.pg151_def.cx7 | 1.00 | 1.00 | 1.00 | 1.00 | 1.00 | 1.00 |
| 20m.pg151_o2_nofp.cx7 | 1.01 | 0.99 | 1.00 | 1.00 | 0.99 | 0.99 |
| 20m.pg151_o3.cx7 | 1.05 | 1.01 | 1.03 | 1.05 | 1.05 | 1.05 |
| 20m.pg151_o3_native.cx7 | 1.05 | 1.04 | 1.04 | 1.09 | 1.09 | 1.07 |
| 20m.pg151_o3_native_lto.cx7 | 1.14 | 1.09 | 1.09 | 1.15 | 1.15 | 1.14 |
This lists the average rate of inserts/s for the tests that do inserts concurrent with queries. For such tests the query rate is listed in the table above. The read+write tests are setup so that the insert rate should match the target rate every second. Cells that are not at least 95% of the target have a red background to indicate a failure to satisfy the target.
| dbms | q100.1 | q500.1 | q1000.1 |
|---|---|---|---|
| pg151_def.cx7 | 399 | 1994 | 3989 |
| pg151_o2_nofp.cx7 | 399 | 1994 | 3989 |
| pg151_o3.cx7 | 399 | 1994 | 3989 |
| pg151_o3_native.cx7 | 399 | 1993 | 3989 |
| pg151_o3_native_lto.cx7 | 399 | 1994 | 3989 |
| target | 400 | 2000 | 4000 |
l.i0
l.i0: load without secondary indexes. Graphs for performance per 1-second interval are here.
Average throughput:
Insert response time histogram: each cell has the percentage of responses that take <= the time in the header and max is the max response time in seconds. For the max column values in the top 25% of the range have a red background and in the bottom 25% of the range have a green background. The red background is not used when the min value is within 80% of the max value.
| dbms | 256us | 1ms | 4ms | 16ms | 64ms | 256ms | 1s | 4s | 16s | gt | max |
|---|---|---|---|---|---|---|---|---|---|---|---|
| pg151_def.cx7 | 99.953 | 0.048 | 0.011 | ||||||||
| pg151_o2_nofp.cx7 | 99.959 | 0.041 | 0.011 | ||||||||
| pg151_o3.cx7 | 99.969 | 0.030 | 0.011 | ||||||||
| pg151_o3_native.cx7 | 99.965 | 0.034 | 0.010 | ||||||||
| pg151_o3_native_lto.cx7 | 0.004 | 99.959 | 0.037 | 0.010 |
Performance metrics for the DBMS listed above. Some are normalized by throughput, others are not. Legend for results is here.
ips	qps	rps	rmbps	wps	wmbps	rpq	rkbpq	wpi	wkbpi	csps	cpups	cspq	cpupq	dbgb1	dbgb2	rss	maxop	p50	p99	tag
224719	0	0	0.0	268.9	97.7	0.000	0.000	0.001	0.445	24692	70.8	0.110	25	2.1	5.6	0.0	0.011	65451	41554	20m.pg151_def.cx7
227273	0	0	0.0	270.1	98.0	0.000	0.000	0.001	0.442	25512	71.0	0.112	25	2.1	5.6	0.0	0.011	65829	13585	20m.pg151_o2_nofp.cx7
235294	0	0	0.0	285.1	103.4	0.000	0.000	0.001	0.450	25881	70.4	0.110	24	2.1	5.6	0.0	0.011	69725	22584	20m.pg151_o3.cx7
235294	0	0	0.0	285.9	103.9	0.000	0.000	0.001	0.452	26318	70.4	0.112	24	2.1	5.6	0.0	0.010	70747	27970	20m.pg151_o3_native.cx7
256410	0	0	0.0	307.5	111.3	0.000	0.000	0.001	0.445	28137	69.8	0.110	22	2.1	5.6	0.0	0.010	75916	13585	20m.pg151_o3_native_lto.cx7
l.x
l.x: create secondary indexes.
Average throughput:
Performance metrics for the DBMS listed above. Some are normalized by throughput, others are not. Legend for results is here.
ips	qps	rps	rmbps	wps	wmbps	rpq	rkbpq	wpi	wkbpi	csps	cpups	cspq	cpupq	dbgb1	dbgb2	rss	maxop	p50	p99	tag
236470	0	0	0.0	108.8	51.1	0.000	0.000	0.000	0.221	713	12.7	0.003	4	3.9	9.0	0.0	0.004	NA	NA	20m.pg151_def.cx7
233721	0	0	0.0	134.3	63.0	0.000	0.000	0.001	0.276	744	12.7	0.003	4	3.9	9.0	0.0	0.004	NA	NA	20m.pg151_o2_nofp.cx7
239286	0	0	0.0	111.9	52.5	0.000	0.000	0.000	0.225	690	12.8	0.003	4	3.9	9.0	0.0	0.003	NA	NA	20m.pg151_o3.cx7
245122	0	0	0.0	128.2	60.3	0.000	0.000	0.001	0.252	702	12.6	0.003	4	3.9	9.0	0.0	0.003	NA	NA	20m.pg151_o3_native.cx7
257692	0	0	0.0	120.9	56.7	0.000	0.000	0.000	0.225	812	12.7	0.003	4	3.9	9.0	0.0	0.003	NA	NA	20m.pg151_o3_native_lto.cx7
l.i1
l.i1: continue load after secondary indexes created. Graphs for performance per 1-second interval are here.
Average throughput:
Insert response time histogram: each cell has the percentage of responses that take <= the time in the header and max is the max response time in seconds. For the max column values in the top 25% of the range have a red background and in the bottom 25% of the range have a green background. The red background is not used when the min value is within 80% of the max value.
| dbms | 256us | 1ms | 4ms | 16ms | 64ms | 256ms | 1s | 4s | 16s | gt | max |
|---|---|---|---|---|---|---|---|---|---|---|---|
| pg151_def.cx7 | 99.787 | 0.083 | 0.130 | 0.055 | |||||||
| pg151_o2_nofp.cx7 | 99.770 | 0.097 | 0.133 | 0.052 | |||||||
| pg151_o3.cx7 | 99.778 | 0.091 | 0.130 | 0.001 | 0.090 | ||||||
| pg151_o3_native.cx7 | 99.775 | 0.086 | 0.138 | 0.001 | 0.107 | ||||||
| pg151_o3_native_lto.cx7 | 99.790 | 0.078 | 0.132 | 0.055 |
Performance metrics for the DBMS listed above. Some are normalized by throughput, others are not. Legend for results is here.
ips	qps	rps	rmbps	wps	wmbps	rpq	rkbpq	wpi	wkbpi	csps	cpups	cspq	cpupq	dbgb1	dbgb2	rss	maxop	p50	p99	tag
96154	0	0	0.0	434.3	148.8	0.000	0.000	0.005	1.585	21100	63.0	0.219	52	8.6	25.2	0.0	0.055	25522	4445	20m.pg151_def.cx7
96618	0	0	0.0	432.4	148.5	0.000	0.000	0.004	1.574	21152	62.9	0.219	52	8.6	25.2	0.0	0.052	25722	4395	20m.pg151_o2_nofp.cx7
99502	0	0	0.0	438.6	150.5	0.000	0.000	0.004	1.549	21480	63.0	0.216	51	8.6	25.1	0.0	0.090	26481	4095	20m.pg151_o3.cx7
100000	0	0	0.0	441.7	151.3	0.000	0.000	0.004	1.549	21622	63.0	0.216	50	8.6	25.2	0.0	0.107	26635	3946	20m.pg151_o3_native.cx7
105263	0	0	0.0	452.1	155.7	0.000	0.000	0.004	1.515	22456	63.2	0.213	48	8.6	24.9	0.0	0.055	28070	4095	20m.pg151_o3_native_lto.cx7
q100.1
q100.1: range queries with 100 insert/s per client. Graphs for performance per 1-second interval are here.
Average throughput:
Query response time histogram: each cell has the percentage of responses that take <= the time in the header and max is the max response time in seconds. For max values in the top 25% of the range have a red background and in the bottom 25% of the range have a green background. The red background is not used when the min value is within 80% of the max value.
| dbms | 256us | 1ms | 4ms | 16ms | 64ms | 256ms | 1s | 4s | 16s | gt | max |
|---|---|---|---|---|---|---|---|---|---|---|---|
| pg151_def.cx7 | 99.980 | 0.013 | 0.007 | nonzero | 0.008 | ||||||
| pg151_o2_nofp.cx7 | 99.979 | 0.014 | 0.006 | nonzero | 0.008 | ||||||
| pg151_o3.cx7 | 99.983 | 0.011 | 0.006 | nonzero | 0.006 | ||||||
| pg151_o3_native.cx7 | 99.984 | 0.011 | 0.005 | nonzero | 0.006 | ||||||
| pg151_o3_native_lto.cx7 | 99.986 | 0.009 | 0.005 | nonzero | 0.007 |
Insert response time histogram: each cell has the percentage of responses that take <= the time in the header and max is the max response time in seconds. For max values in the top 25% of the range have a red background and in the bottom 25% of the range have a green background. The red background is not used when the min value is within 80% of the max value.
| dbms | 256us | 1ms | 4ms | 16ms | 64ms | 256ms | 1s | 4s | 16s | gt | max |
|---|---|---|---|---|---|---|---|---|---|---|---|
| pg151_def.cx7 | 99.410 | 0.590 | 0.008 | ||||||||
| pg151_o2_nofp.cx7 | 99.264 | 0.736 | 0.009 | ||||||||
| pg151_o3.cx7 | 99.215 | 0.785 | 0.007 | ||||||||
| pg151_o3_native.cx7 | 99.764 | 0.236 | 0.008 | ||||||||
| pg151_o3_native_lto.cx7 | 99.736 | 0.264 | 0.008 |
Performance metrics for the DBMS listed above. Some are normalized by throughput, others are not. Legend for results is here.
ips	qps	rps	rmbps	wps	wmbps	rpq	rkbpq	wpi	wkbpi	csps	cpups	cspq	cpupq	dbgb1	dbgb2	rss	maxop	p50	p99	tag
399	41165	0	0.0	287.6	12.4	0.000	0.000	0.721	31.768	157052	50.5	3.815	98	8.7	23.5	0.0	0.008	10405	8599	20m.pg151_def.cx7
399	41024	0	0.0	287.8	12.5	0.000	0.000	0.722	31.979	156440	50.4	3.813	98	8.7	23.5	0.0	0.008	10357	8519	20m.pg151_o2_nofp.cx7
399	43204	0	0.0	288.0	12.4	0.000	0.000	0.723	31.831	164847	50.3	3.816	93	8.7	24.0	0.0	0.006	11048	9510	20m.pg151_o3.cx7
399	44736	0	0.0	288.9	12.5	0.000	0.000	0.724	32.157	170551	50.4	3.812	90	8.7	24.1	0.0	0.006	11316	9206	20m.pg151_o3_native.cx7
399	47361	0	0.0	291.2	12.6	0.000	0.000	0.730	32.261	180571	50.4	3.813	85	8.7	24.9	0.0	0.007	11891	10723	20m.pg151_o3_native_lto.cx7
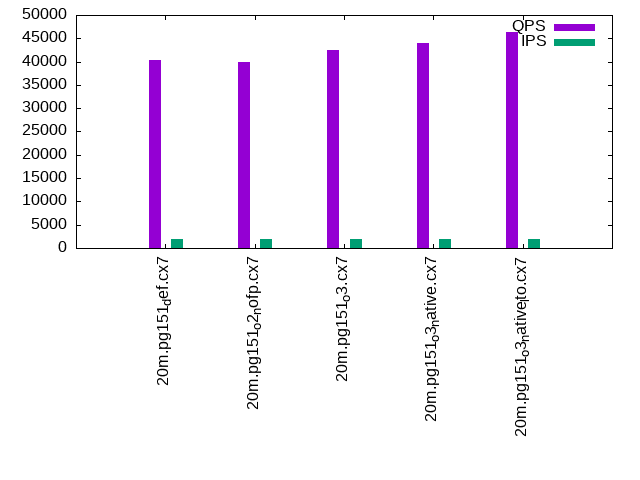
q500.1
q500.1: range queries with 500 insert/s per client. Graphs for performance per 1-second interval are here.
Average throughput:
Query response time histogram: each cell has the percentage of responses that take <= the time in the header and max is the max response time in seconds. For max values in the top 25% of the range have a red background and in the bottom 25% of the range have a green background. The red background is not used when the min value is within 80% of the max value.
| dbms | 256us | 1ms | 4ms | 16ms | 64ms | 256ms | 1s | 4s | 16s | gt | max |
|---|---|---|---|---|---|---|---|---|---|---|---|
| pg151_def.cx7 | 99.954 | 0.027 | 0.017 | 0.001 | nonzero | 0.020 | |||||
| pg151_o2_nofp.cx7 | 99.952 | 0.030 | 0.017 | 0.001 | nonzero | 0.019 | |||||
| pg151_o3.cx7 | 99.957 | 0.025 | 0.016 | 0.001 | nonzero | 0.019 | |||||
| pg151_o3_native.cx7 | 99.955 | 0.028 | 0.017 | 0.001 | 0.015 | ||||||
| pg151_o3_native_lto.cx7 | 99.961 | 0.022 | 0.016 | 0.001 | nonzero | 0.028 |
Insert response time histogram: each cell has the percentage of responses that take <= the time in the header and max is the max response time in seconds. For max values in the top 25% of the range have a red background and in the bottom 25% of the range have a green background. The red background is not used when the min value is within 80% of the max value.
| dbms | 256us | 1ms | 4ms | 16ms | 64ms | 256ms | 1s | 4s | 16s | gt | max |
|---|---|---|---|---|---|---|---|---|---|---|---|
| pg151_def.cx7 | 93.118 | 6.757 | 0.119 | 0.006 | 0.107 | ||||||
| pg151_o2_nofp.cx7 | 93.882 | 5.982 | 0.132 | 0.004 | 0.066 | ||||||
| pg151_o3.cx7 | 94.574 | 5.312 | 0.110 | 0.004 | 0.111 | ||||||
| pg151_o3_native.cx7 | 98.562 | 1.400 | 0.037 | 0.033 | |||||||
| pg151_o3_native_lto.cx7 | 96.807 | 3.143 | 0.050 | 0.033 |
Performance metrics for the DBMS listed above. Some are normalized by throughput, others are not. Legend for results is here.
ips	qps	rps	rmbps	wps	wmbps	rpq	rkbpq	wpi	wkbpi	csps	cpups	cspq	cpupq	dbgb1	dbgb2	rss	maxop	p50	p99	tag
1994	40418	2	0.0	268.4	20.6	0.000	0.000	0.135	10.559	153111	51.4	3.788	102	10.2	20.7	0.0	0.020	10293	8330	20m.pg151_def.cx7
1994	39933	2	0.0	269.0	20.6	0.000	0.000	0.135	10.562	151252	51.3	3.788	103	10.2	20.7	0.0	0.019	10089	8410	20m.pg151_o2_nofp.cx7
1994	42448	2	0.0	271.1	20.5	0.000	0.000	0.136	10.538	160893	51.2	3.790	96	10.2	20.9	0.0	0.019	10772	8742	20m.pg151_o3.cx7
1993	43910	2	0.0	272.7	20.5	0.000	0.000	0.137	10.549	166687	51.3	3.796	93	10.2	21.0	0.0	0.015	11160	9238	20m.pg151_o3_native.cx7
1994	46330	2	0.0	273.5	20.4	0.000	0.000	0.137	10.495	175680	51.3	3.792	89	10.2	21.5	0.0	0.028	11603	10264	20m.pg151_o3_native_lto.cx7
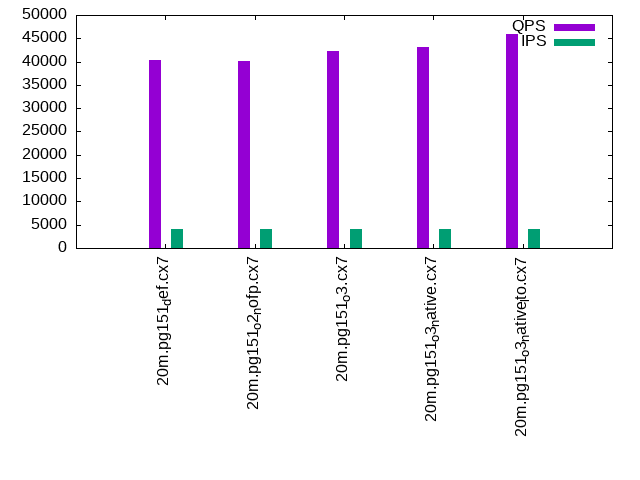
q1000.1
q1000.1: range queries with 1000 insert/s per client. Graphs for performance per 1-second interval are here.
Average throughput:
Query response time histogram: each cell has the percentage of responses that take <= the time in the header and max is the max response time in seconds. For max values in the top 25% of the range have a red background and in the bottom 25% of the range have a green background. The red background is not used when the min value is within 80% of the max value.
| dbms | 256us | 1ms | 4ms | 16ms | 64ms | 256ms | 1s | 4s | 16s | gt | max |
|---|---|---|---|---|---|---|---|---|---|---|---|
| pg151_def.cx7 | 99.899 | 0.071 | 0.029 | 0.001 | 0.014 | ||||||
| pg151_o2_nofp.cx7 | 99.899 | 0.072 | 0.028 | 0.001 | nonzero | 0.018 | |||||
| pg151_o3.cx7 | 99.905 | 0.066 | 0.028 | 0.001 | nonzero | 0.019 | |||||
| pg151_o3_native.cx7 | 99.906 | 0.065 | 0.029 | 0.001 | nonzero | 0.020 | |||||
| pg151_o3_native_lto.cx7 | 99.916 | 0.056 | 0.027 | 0.001 | 0.016 |
Insert response time histogram: each cell has the percentage of responses that take <= the time in the header and max is the max response time in seconds. For max values in the top 25% of the range have a red background and in the bottom 25% of the range have a green background. The red background is not used when the min value is within 80% of the max value.
| dbms | 256us | 1ms | 4ms | 16ms | 64ms | 256ms | 1s | 4s | 16s | gt | max |
|---|---|---|---|---|---|---|---|---|---|---|---|
| pg151_def.cx7 | 94.106 | 5.801 | 0.094 | 0.034 | |||||||
| pg151_o2_nofp.cx7 | 94.766 | 5.152 | 0.082 | 0.027 | |||||||
| pg151_o3.cx7 | 93.353 | 6.544 | 0.103 | 0.035 | |||||||
| pg151_o3_native.cx7 | 95.741 | 4.199 | 0.060 | 0.025 | |||||||
| pg151_o3_native_lto.cx7 | 95.317 | 4.617 | 0.067 | 0.030 |
Performance metrics for the DBMS listed above. Some are normalized by throughput, others are not. Legend for results is here.
ips	qps	rps	rmbps	wps	wmbps	rpq	rkbpq	wpi	wkbpi	csps	cpups	cspq	cpupq	dbgb1	dbgb2	rss	maxop	p50	p99	tag
3989	40385	28	0.2	321.7	27.3	0.001	0.006	0.081	7.016	151488	52.5	3.751	104	12.6	21.3	0.0	0.014	10245	8343	20m.pg151_def.cx7
3989	40137	28	0.2	322.4	27.3	0.001	0.006	0.081	7.013	150480	52.4	3.749	104	12.6	21.3	0.0	0.018	10149	8039	20m.pg151_o2_nofp.cx7
3989	42232	23	0.2	320.0	27.3	0.001	0.005	0.080	7.011	158642	52.4	3.756	99	12.6	21.5	0.0	0.019	10696	8874	20m.pg151_o3.cx7
3989	43123	24	0.2	321.1	27.3	0.001	0.005	0.081	7.013	162114	52.4	3.759	97	12.6	21.5	0.0	0.020	11000	9241	20m.pg151_o3_native.cx7
3989	45924	25	0.2	323.5	27.3	0.001	0.005	0.081	7.020	172762	52.4	3.762	91	12.6	21.8	0.0	0.016	11555	9805	20m.pg151_o3_native_lto.cx7
l.i0
l.i0: load without secondary indexes
Performance metrics for all DBMS, not just the ones listed above. Some are normalized by throughput, others are not. Legend for results is here.
ips	qps	rps	rmbps	wps	wmbps	rpq	rkbpq	wpi	wkbpi	csps	cpups	cspq	cpupq	dbgb1	dbgb2	rss	maxop	p50	p99	tag
224719	0	0	0.0	268.9	97.7	0.000	0.000	0.001	0.445	24692	70.8	0.110	25	2.1	5.6	0.0	0.011	65451	41554	20m.pg151_def.cx7
227273	0	0	0.0	270.1	98.0	0.000	0.000	0.001	0.442	25512	71.0	0.112	25	2.1	5.6	0.0	0.011	65829	13585	20m.pg151_o2_nofp.cx7
235294	0	0	0.0	285.1	103.4	0.000	0.000	0.001	0.450	25881	70.4	0.110	24	2.1	5.6	0.0	0.011	69725	22584	20m.pg151_o3.cx7
235294	0	0	0.0	285.9	103.9	0.000	0.000	0.001	0.452	26318	70.4	0.112	24	2.1	5.6	0.0	0.010	70747	27970	20m.pg151_o3_native.cx7
256410	0	0	0.0	307.5	111.3	0.000	0.000	0.001	0.445	28137	69.8	0.110	22	2.1	5.6	0.0	0.010	75916	13585	20m.pg151_o3_native_lto.cx7
l.x
l.x: create secondary indexes
Performance metrics for all DBMS, not just the ones listed above. Some are normalized by throughput, others are not. Legend for results is here.
ips	qps	rps	rmbps	wps	wmbps	rpq	rkbpq	wpi	wkbpi	csps	cpups	cspq	cpupq	dbgb1	dbgb2	rss	maxop	p50	p99	tag
236470	0	0	0.0	108.8	51.1	0.000	0.000	0.000	0.221	713	12.7	0.003	4	3.9	9.0	0.0	0.004	NA	NA	20m.pg151_def.cx7
233721	0	0	0.0	134.3	63.0	0.000	0.000	0.001	0.276	744	12.7	0.003	4	3.9	9.0	0.0	0.004	NA	NA	20m.pg151_o2_nofp.cx7
239286	0	0	0.0	111.9	52.5	0.000	0.000	0.000	0.225	690	12.8	0.003	4	3.9	9.0	0.0	0.003	NA	NA	20m.pg151_o3.cx7
245122	0	0	0.0	128.2	60.3	0.000	0.000	0.001	0.252	702	12.6	0.003	4	3.9	9.0	0.0	0.003	NA	NA	20m.pg151_o3_native.cx7
257692	0	0	0.0	120.9	56.7	0.000	0.000	0.000	0.225	812	12.7	0.003	4	3.9	9.0	0.0	0.003	NA	NA	20m.pg151_o3_native_lto.cx7
l.i1
l.i1: continue load after secondary indexes created
Performance metrics for all DBMS, not just the ones listed above. Some are normalized by throughput, others are not. Legend for results is here.
ips	qps	rps	rmbps	wps	wmbps	rpq	rkbpq	wpi	wkbpi	csps	cpups	cspq	cpupq	dbgb1	dbgb2	rss	maxop	p50	p99	tag
96154	0	0	0.0	434.3	148.8	0.000	0.000	0.005	1.585	21100	63.0	0.219	52	8.6	25.2	0.0	0.055	25522	4445	20m.pg151_def.cx7
96618	0	0	0.0	432.4	148.5	0.000	0.000	0.004	1.574	21152	62.9	0.219	52	8.6	25.2	0.0	0.052	25722	4395	20m.pg151_o2_nofp.cx7
99502	0	0	0.0	438.6	150.5	0.000	0.000	0.004	1.549	21480	63.0	0.216	51	8.6	25.1	0.0	0.090	26481	4095	20m.pg151_o3.cx7
100000	0	0	0.0	441.7	151.3	0.000	0.000	0.004	1.549	21622	63.0	0.216	50	8.6	25.2	0.0	0.107	26635	3946	20m.pg151_o3_native.cx7
105263	0	0	0.0	452.1	155.7	0.000	0.000	0.004	1.515	22456	63.2	0.213	48	8.6	24.9	0.0	0.055	28070	4095	20m.pg151_o3_native_lto.cx7
q100.1
q100.1: range queries with 100 insert/s per client
Performance metrics for all DBMS, not just the ones listed above. Some are normalized by throughput, others are not. Legend for results is here.
ips	qps	rps	rmbps	wps	wmbps	rpq	rkbpq	wpi	wkbpi	csps	cpups	cspq	cpupq	dbgb1	dbgb2	rss	maxop	p50	p99	tag
399	41165	0	0.0	287.6	12.4	0.000	0.000	0.721	31.768	157052	50.5	3.815	98	8.7	23.5	0.0	0.008	10405	8599	20m.pg151_def.cx7
399	41024	0	0.0	287.8	12.5	0.000	0.000	0.722	31.979	156440	50.4	3.813	98	8.7	23.5	0.0	0.008	10357	8519	20m.pg151_o2_nofp.cx7
399	43204	0	0.0	288.0	12.4	0.000	0.000	0.723	31.831	164847	50.3	3.816	93	8.7	24.0	0.0	0.006	11048	9510	20m.pg151_o3.cx7
399	44736	0	0.0	288.9	12.5	0.000	0.000	0.724	32.157	170551	50.4	3.812	90	8.7	24.1	0.0	0.006	11316	9206	20m.pg151_o3_native.cx7
399	47361	0	0.0	291.2	12.6	0.000	0.000	0.730	32.261	180571	50.4	3.813	85	8.7	24.9	0.0	0.007	11891	10723	20m.pg151_o3_native_lto.cx7
q500.1
q500.1: range queries with 500 insert/s per client
Performance metrics for all DBMS, not just the ones listed above. Some are normalized by throughput, others are not. Legend for results is here.
ips	qps	rps	rmbps	wps	wmbps	rpq	rkbpq	wpi	wkbpi	csps	cpups	cspq	cpupq	dbgb1	dbgb2	rss	maxop	p50	p99	tag
1994	40418	2	0.0	268.4	20.6	0.000	0.000	0.135	10.559	153111	51.4	3.788	102	10.2	20.7	0.0	0.020	10293	8330	20m.pg151_def.cx7
1994	39933	2	0.0	269.0	20.6	0.000	0.000	0.135	10.562	151252	51.3	3.788	103	10.2	20.7	0.0	0.019	10089	8410	20m.pg151_o2_nofp.cx7
1994	42448	2	0.0	271.1	20.5	0.000	0.000	0.136	10.538	160893	51.2	3.790	96	10.2	20.9	0.0	0.019	10772	8742	20m.pg151_o3.cx7
1993	43910	2	0.0	272.7	20.5	0.000	0.000	0.137	10.549	166687	51.3	3.796	93	10.2	21.0	0.0	0.015	11160	9238	20m.pg151_o3_native.cx7
1994	46330	2	0.0	273.5	20.4	0.000	0.000	0.137	10.495	175680	51.3	3.792	89	10.2	21.5	0.0	0.028	11603	10264	20m.pg151_o3_native_lto.cx7
q1000.1
q1000.1: range queries with 1000 insert/s per client
Performance metrics for all DBMS, not just the ones listed above. Some are normalized by throughput, others are not. Legend for results is here.
ips	qps	rps	rmbps	wps	wmbps	rpq	rkbpq	wpi	wkbpi	csps	cpups	cspq	cpupq	dbgb1	dbgb2	rss	maxop	p50	p99	tag
3989	40385	28	0.2	321.7	27.3	0.001	0.006	0.081	7.016	151488	52.5	3.751	104	12.6	21.3	0.0	0.014	10245	8343	20m.pg151_def.cx7
3989	40137	28	0.2	322.4	27.3	0.001	0.006	0.081	7.013	150480	52.4	3.749	104	12.6	21.3	0.0	0.018	10149	8039	20m.pg151_o2_nofp.cx7
3989	42232	23	0.2	320.0	27.3	0.001	0.005	0.080	7.011	158642	52.4	3.756	99	12.6	21.5	0.0	0.019	10696	8874	20m.pg151_o3.cx7
3989	43123	24	0.2	321.1	27.3	0.001	0.005	0.081	7.013	162114	52.4	3.759	97	12.6	21.5	0.0	0.020	11000	9241	20m.pg151_o3_native.cx7
3989	45924	25	0.2	323.5	27.3	0.001	0.005	0.081	7.020	172762	52.4	3.762	91	12.6	21.8	0.0	0.016	11555	9805	20m.pg151_o3_native_lto.cx7
l.i0
- l.i0: load without secondary indexes
- Legend for results is here.
- Each entry lists the percentage of responses that fit in that bucket (slower than max time for previous bucket, faster than min time for next bucket).
Insert response time histogram
256us	1ms	4ms	16ms	64ms	256ms	1s	4s	16s	gt	max	tag
0.000	0.000	99.953	0.048	0.000	0.000	0.000	0.000	0.000	0.000	0.011	pg151_def.cx7
0.000	0.000	99.959	0.041	0.000	0.000	0.000	0.000	0.000	0.000	0.011	pg151_o2_nofp.cx7
0.000	0.000	99.969	0.030	0.000	0.000	0.000	0.000	0.000	0.000	0.011	pg151_o3.cx7
0.000	0.000	99.965	0.034	0.000	0.000	0.000	0.000	0.000	0.000	0.010	pg151_o3_native.cx7
0.000	0.004	99.959	0.037	0.000	0.000	0.000	0.000	0.000	0.000	0.010	pg151_o3_native_lto.cx7
l.x
- l.x: create secondary indexes
- Legend for results is here.
- Each entry lists the percentage of responses that fit in that bucket (slower than max time for previous bucket, faster than min time for next bucket).
TODO - determine whether there is data for create index response time
l.i1
- l.i1: continue load after secondary indexes created
- Legend for results is here.
- Each entry lists the percentage of responses that fit in that bucket (slower than max time for previous bucket, faster than min time for next bucket).
Insert response time histogram
256us	1ms	4ms	16ms	64ms	256ms	1s	4s	16s	gt	max	tag
0.000	0.000	99.787	0.083	0.130	0.000	0.000	0.000	0.000	0.000	0.055	pg151_def.cx7
0.000	0.000	99.770	0.097	0.133	0.000	0.000	0.000	0.000	0.000	0.052	pg151_o2_nofp.cx7
0.000	0.000	99.778	0.091	0.130	0.001	0.000	0.000	0.000	0.000	0.090	pg151_o3.cx7
0.000	0.000	99.775	0.086	0.138	0.001	0.000	0.000	0.000	0.000	0.107	pg151_o3_native.cx7
0.000	0.000	99.790	0.078	0.132	0.000	0.000	0.000	0.000	0.000	0.055	pg151_o3_native_lto.cx7
q100.1
- q100.1: range queries with 100 insert/s per client
- Legend for results is here.
- Each entry lists the percentage of responses that fit in that bucket (slower than max time for previous bucket, faster than min time for next bucket).
Query response time histogram
256us	1ms	4ms	16ms	64ms	256ms	1s	4s	16s	gt	max	tag
99.980	0.013	0.007	nonzero	0.000	0.000	0.000	0.000	0.000	0.000	0.008	pg151_def.cx7
99.979	0.014	0.006	nonzero	0.000	0.000	0.000	0.000	0.000	0.000	0.008	pg151_o2_nofp.cx7
99.983	0.011	0.006	nonzero	0.000	0.000	0.000	0.000	0.000	0.000	0.006	pg151_o3.cx7
99.984	0.011	0.005	nonzero	0.000	0.000	0.000	0.000	0.000	0.000	0.006	pg151_o3_native.cx7
99.986	0.009	0.005	nonzero	0.000	0.000	0.000	0.000	0.000	0.000	0.007	pg151_o3_native_lto.cx7
Insert response time histogram
256us	1ms	4ms	16ms	64ms	256ms	1s	4s	16s	gt	max	tag
0.000	0.000	99.410	0.590	0.000	0.000	0.000	0.000	0.000	0.000	0.008	pg151_def.cx7
0.000	0.000	99.264	0.736	0.000	0.000	0.000	0.000	0.000	0.000	0.009	pg151_o2_nofp.cx7
0.000	0.000	99.215	0.785	0.000	0.000	0.000	0.000	0.000	0.000	0.007	pg151_o3.cx7
0.000	0.000	99.764	0.236	0.000	0.000	0.000	0.000	0.000	0.000	0.008	pg151_o3_native.cx7
0.000	0.000	99.736	0.264	0.000	0.000	0.000	0.000	0.000	0.000	0.008	pg151_o3_native_lto.cx7
q500.1
- q500.1: range queries with 500 insert/s per client
- Legend for results is here.
- Each entry lists the percentage of responses that fit in that bucket (slower than max time for previous bucket, faster than min time for next bucket).
Query response time histogram
256us	1ms	4ms	16ms	64ms	256ms	1s	4s	16s	gt	max	tag
99.954	0.027	0.017	0.001	nonzero	0.000	0.000	0.000	0.000	0.000	0.020	pg151_def.cx7
99.952	0.030	0.017	0.001	nonzero	0.000	0.000	0.000	0.000	0.000	0.019	pg151_o2_nofp.cx7
99.957	0.025	0.016	0.001	nonzero	0.000	0.000	0.000	0.000	0.000	0.019	pg151_o3.cx7
99.955	0.028	0.017	0.001	0.000	0.000	0.000	0.000	0.000	0.000	0.015	pg151_o3_native.cx7
99.961	0.022	0.016	0.001	nonzero	0.000	0.000	0.000	0.000	0.000	0.028	pg151_o3_native_lto.cx7
Insert response time histogram
256us	1ms	4ms	16ms	64ms	256ms	1s	4s	16s	gt	max	tag
0.000	0.000	93.118	6.757	0.119	0.006	0.000	0.000	0.000	0.000	0.107	pg151_def.cx7
0.000	0.000	93.882	5.982	0.132	0.004	0.000	0.000	0.000	0.000	0.066	pg151_o2_nofp.cx7
0.000	0.000	94.574	5.312	0.110	0.004	0.000	0.000	0.000	0.000	0.111	pg151_o3.cx7
0.000	0.000	98.562	1.400	0.037	0.000	0.000	0.000	0.000	0.000	0.033	pg151_o3_native.cx7
0.000	0.000	96.807	3.143	0.050	0.000	0.000	0.000	0.000	0.000	0.033	pg151_o3_native_lto.cx7
q1000.1
- q1000.1: range queries with 1000 insert/s per client
- Legend for results is here.
- Each entry lists the percentage of responses that fit in that bucket (slower than max time for previous bucket, faster than min time for next bucket).
Query response time histogram
256us	1ms	4ms	16ms	64ms	256ms	1s	4s	16s	gt	max	tag
99.899	0.071	0.029	0.001	0.000	0.000	0.000	0.000	0.000	0.000	0.014	pg151_def.cx7
99.899	0.072	0.028	0.001	nonzero	0.000	0.000	0.000	0.000	0.000	0.018	pg151_o2_nofp.cx7
99.905	0.066	0.028	0.001	nonzero	0.000	0.000	0.000	0.000	0.000	0.019	pg151_o3.cx7
99.906	0.065	0.029	0.001	nonzero	0.000	0.000	0.000	0.000	0.000	0.020	pg151_o3_native.cx7
99.916	0.056	0.027	0.001	0.000	0.000	0.000	0.000	0.000	0.000	0.016	pg151_o3_native_lto.cx7
Insert response time histogram
256us	1ms	4ms	16ms	64ms	256ms	1s	4s	16s	gt	max	tag
0.000	0.000	94.106	5.801	0.094	0.000	0.000	0.000	0.000	0.000	0.034	pg151_def.cx7
0.000	0.000	94.766	5.152	0.082	0.000	0.000	0.000	0.000	0.000	0.027	pg151_o2_nofp.cx7
0.000	0.000	93.353	6.544	0.103	0.000	0.000	0.000	0.000	0.000	0.035	pg151_o3.cx7
0.000	0.000	95.741	4.199	0.060	0.000	0.000	0.000	0.000	0.000	0.025	pg151_o3_native.cx7
0.000	0.000	95.317	4.617	0.067	0.000	0.000	0.000	0.000	0.000	0.030	pg151_o3_native_lto.cx7