Introduction
This is a report for the insert benchmark with 20M docs and 4 client(s). It is generated by scripts (bash, awk, sed) and Tufte might not be impressed. An overview of the insert benchmark is here and a short update is here. Below, by DBMS, I mean DBMS+version.config. An example is my8020.c10b40 where my means MySQL, 8020 is version 8.0.20 and c10b40 is the name for the configuration file.
The test server has 8 AMD cores, 16G RAM and an NVMe SSD. It is described here as the Beelink. The benchmark was run with 4 clients and there were 1 or 2 connections per client (1 for queries, 1 for inserts). It uses 1 table. It loads 20M rows without secondary indexes, creates secondary indexes, loads another 20M rows then does 3 read+write tests for one hour each that do queries as fast as possible with 100, 500 and then 1000 writes/second/client concurrent with the queries. The database is cached by the OS but not by the database. Clients and the DBMS share one server. The per-database configs are in the per-database subdirectories here.
The tested DBMS are:
- pg151_def.cx7_1g - Postgres 15.1, the cx7_1g config and the build used: -O2
- pg151_o2_nofp.cx7_1g - Postgres 15.1, the cx7_1g config and the build used: -O2 -no-omit-frame-pointer
- pg151_o3.cx7_1g - Postgres 15.1, the cx7_1g config and the build used: -O3
- pg151_o3_native.cx7_1g - Postgres 15.1, the cx7_1g config and the build used: -O3 -march=native -mtune=native
- pg151_o3_native_lto.cx7_1g - Postgres 15.1, the cx7_1g config and the build used: -O3 -march=native -mtune=native and -flto
Contents
- Summary
- l.i0: load without secondary indexes
- l.x: create secondary indexes
- l.i1: continue load after secondary indexes created
- q100.1: range queries with 100 insert/s per client
- q500.1: range queries with 500 insert/s per client
- q1000.1: range queries with 1000 insert/s per client
Summary
The numbers are inserts/s for l.i0 and l.i1, indexed docs (or rows) /s for l.x and queries/s for q*.2. The values are the average rate over the entire test for inserts (IPS) and queries (QPS). The range of values for IPS and QPS is split into 3 parts: bottom 25%, middle 50%, top 25%. Values in the bottom 25% have a red background, values in the top 25% have a green background and values in the middle have no color. A gray background is used for values that can be ignored because the DBMS did not sustain the target insert rate. Red backgrounds are not used when the minimum value is within 80% of the max value.
| dbms | l.i0 | l.x | l.i1 | q100.1 | q500.1 | q1000.1 |
|---|---|---|---|---|---|---|
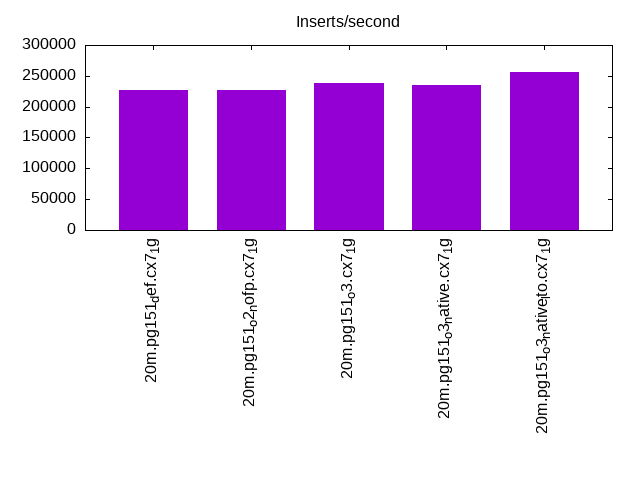
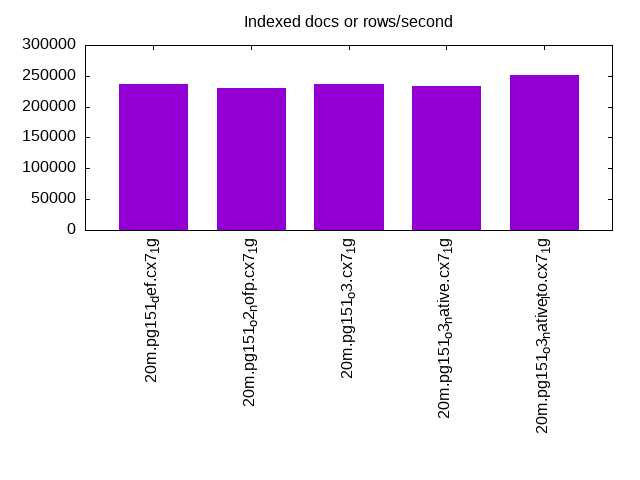
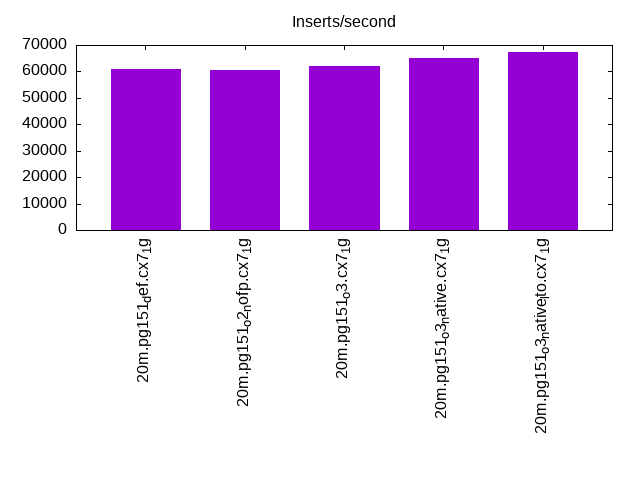
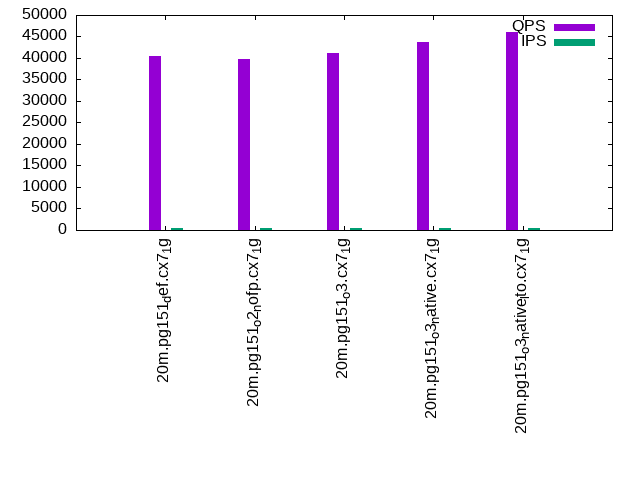
| 20m.pg151_def.cx7_1g | 227273 | 236470 | 60976 | 40576 | 39003 | 37945 |
| 20m.pg151_o2_nofp.cx7_1g | 227273 | 231034 | 60606 | 39753 | 38341 | 37448 |
| 20m.pg151_o3.cx7_1g | 238095 | 236470 | 62112 | 41236 | 39877 | 38520 |
| 20m.pg151_o3_native.cx7_1g | 235294 | 233721 | 65146 | 43805 | 41724 | 40724 |
| 20m.pg151_o3_native_lto.cx7_1g | 256410 | 251250 | 67340 | 46148 | 44768 | 43267 |
This table has relative throughput, throughput for the DBMS relative to the DBMS in the first line, using the absolute throughput from the previous table.
| dbms | l.i0 | l.x | l.i1 | q100.1 | q500.1 | q1000.1 |
|---|---|---|---|---|---|---|
| 20m.pg151_def.cx7_1g | 1.00 | 1.00 | 1.00 | 1.00 | 1.00 | 1.00 |
| 20m.pg151_o2_nofp.cx7_1g | 1.00 | 0.98 | 0.99 | 0.98 | 0.98 | 0.99 |
| 20m.pg151_o3.cx7_1g | 1.05 | 1.00 | 1.02 | 1.02 | 1.02 | 1.02 |
| 20m.pg151_o3_native.cx7_1g | 1.04 | 0.99 | 1.07 | 1.08 | 1.07 | 1.07 |
| 20m.pg151_o3_native_lto.cx7_1g | 1.13 | 1.06 | 1.10 | 1.14 | 1.15 | 1.14 |
This lists the average rate of inserts/s for the tests that do inserts concurrent with queries. For such tests the query rate is listed in the table above. The read+write tests are setup so that the insert rate should match the target rate every second. Cells that are not at least 95% of the target have a red background to indicate a failure to satisfy the target.
| dbms | q100.1 | q500.1 | q1000.1 |
|---|---|---|---|
| pg151_def.cx7_1g | 399 | 1994 | 3989 |
| pg151_o2_nofp.cx7_1g | 399 | 1994 | 3989 |
| pg151_o3.cx7_1g | 399 | 1994 | 3987 |
| pg151_o3_native.cx7_1g | 399 | 1994 | 3987 |
| pg151_o3_native_lto.cx7_1g | 399 | 1994 | 3989 |
| target | 400 | 2000 | 4000 |
l.i0
l.i0: load without secondary indexes. Graphs for performance per 1-second interval are here.
Average throughput:
Insert response time histogram: each cell has the percentage of responses that take <= the time in the header and max is the max response time in seconds. For the max column values in the top 25% of the range have a red background and in the bottom 25% of the range have a green background. The red background is not used when the min value is within 80% of the max value.
| dbms | 256us | 1ms | 4ms | 16ms | 64ms | 256ms | 1s | 4s | 16s | gt | max |
|---|---|---|---|---|---|---|---|---|---|---|---|
| pg151_def.cx7_1g | 99.934 | 0.066 | 0.010 | ||||||||
| pg151_o2_nofp.cx7_1g | 99.930 | 0.069 | 0.011 | ||||||||
| pg151_o3.cx7_1g | 99.934 | 0.066 | 0.014 | ||||||||
| pg151_o3_native.cx7_1g | 99.944 | 0.056 | 0.014 | ||||||||
| pg151_o3_native_lto.cx7_1g | 0.006 | 99.924 | 0.070 | 0.010 |
Performance metrics for the DBMS listed above. Some are normalized by throughput, others are not. Legend for results is here.
ips	qps	rps	rmbps	wps	wmbps	rpq	rkbpq	wpi	wkbpi	csps	cpups	cspq	cpupq	dbgb1	dbgb2	rss	maxop	p50	p99	tag
227273	0	0	0.0	365.6	114.9	0.000	0.000	0.002	0.518	24946	70.5	0.110	25	2.1	5.6	0.0	0.010	66228	11792	20m.pg151_def.cx7_1g
227273	0	0	0.0	365.3	115.1	0.000	0.000	0.002	0.518	25323	70.6	0.111	25	2.1	5.6	0.0	0.011	66129	52771	20m.pg151_o2_nofp.cx7_1g
238095	0	0	0.0	378.5	120.7	0.000	0.000	0.002	0.519	25949	70.1	0.109	24	2.1	5.6	0.0	0.014	69922	11987	20m.pg151_o3.cx7_1g
235294	0	0	0.0	373.6	116.9	0.000	0.000	0.002	0.509	25135	68.5	0.107	23	2.1	5.6	0.0	0.014	69126	59054	20m.pg151_o3_native.cx7_1g
256410	0	0	0.0	400.6	130.0	0.000	0.000	0.002	0.519	27580	69.7	0.108	22	2.1	5.6	0.0	0.010	75318	66728	20m.pg151_o3_native_lto.cx7_1g
l.x
l.x: create secondary indexes.
Average throughput:
Performance metrics for the DBMS listed above. Some are normalized by throughput, others are not. Legend for results is here.
ips	qps	rps	rmbps	wps	wmbps	rpq	rkbpq	wpi	wkbpi	csps	cpups	cspq	cpupq	dbgb1	dbgb2	rss	maxop	p50	p99	tag
236470	0	0	0.0	169.1	71.5	0.000	0.000	0.001	0.309	699	12.7	0.003	4	3.9	9.0	0.0	0.003	NA	NA	20m.pg151_def.cx7_1g
231034	0	0	0.0	154.9	65.0	0.000	0.000	0.001	0.288	728	12.7	0.003	4	3.9	9.0	0.0	0.003	NA	NA	20m.pg151_o2_nofp.cx7_1g
236470	0	0	0.0	162.6	71.1	0.000	0.000	0.001	0.308	781	12.5	0.003	4	3.9	9.0	0.0	0.003	NA	NA	20m.pg151_o3.cx7_1g
233721	0	0	0.0	161.2	70.5	0.000	0.000	0.001	0.309	742	12.6	0.003	4	3.9	9.0	0.0	0.003	NA	NA	20m.pg151_o3_native.cx7_1g
251250	0	0	0.0	148.0	63.6	0.000	0.000	0.001	0.259	785	12.7	0.003	4	3.9	9.0	0.0	0.003	NA	NA	20m.pg151_o3_native_lto.cx7_1g
l.i1
l.i1: continue load after secondary indexes created. Graphs for performance per 1-second interval are here.
Average throughput:
Insert response time histogram: each cell has the percentage of responses that take <= the time in the header and max is the max response time in seconds. For the max column values in the top 25% of the range have a red background and in the bottom 25% of the range have a green background. The red background is not used when the min value is within 80% of the max value.
| dbms | 256us | 1ms | 4ms | 16ms | 64ms | 256ms | 1s | 4s | 16s | gt | max |
|---|---|---|---|---|---|---|---|---|---|---|---|
| pg151_def.cx7_1g | 95.681 | 4.257 | 0.062 | 0.054 | |||||||
| pg151_o2_nofp.cx7_1g | 95.611 | 4.331 | 0.058 | 0.048 | |||||||
| pg151_o3.cx7_1g | 96.602 | 3.335 | 0.063 | 0.053 | |||||||
| pg151_o3_native.cx7_1g | 97.692 | 2.236 | 0.072 | 0.060 | |||||||
| pg151_o3_native_lto.cx7_1g | 98.053 | 1.865 | 0.081 | 0.001 | 0.072 |
Performance metrics for the DBMS listed above. Some are normalized by throughput, others are not. Legend for results is here.
ips	qps	rps	rmbps	wps	wmbps	rpq	rkbpq	wpi	wkbpi	csps	cpups	cspq	cpupq	dbgb1	dbgb2	rss	maxop	p50	p99	tag
60976	0	165	2.9	41606.5	775.9	0.003	0.049	0.682	13.030	34378	62.0	0.564	81	8.6	25.7	0.0	0.054	15533	6842	20m.pg151_def.cx7_1g
60606	0	164	2.9	41563.4	774.6	0.003	0.049	0.686	13.088	34122	62.2	0.563	82	8.6	25.7	0.0	0.048	15444	8945	20m.pg151_o2_nofp.cx7_1g
62112	0	156	1.1	41668.9	783.6	0.003	0.018	0.671	12.919	35260	62.1	0.568	80	8.6	25.1	0.0	0.053	15783	6395	20m.pg151_o3.cx7_1g
65146	0	171	1.2	43146.6	821.5	0.003	0.019	0.662	12.912	39306	62.5	0.603	77	8.6	25.2	0.0	0.060	16788	8540	20m.pg151_o3_native.cx7_1g
67340	0	183	1.3	43608.3	846.1	0.003	0.019	0.648	12.866	41067	62.8	0.610	75	8.6	25.3	0.0	0.072	17281	8145	20m.pg151_o3_native_lto.cx7_1g
q100.1
q100.1: range queries with 100 insert/s per client. Graphs for performance per 1-second interval are here.
Average throughput:
Query response time histogram: each cell has the percentage of responses that take <= the time in the header and max is the max response time in seconds. For max values in the top 25% of the range have a red background and in the bottom 25% of the range have a green background. The red background is not used when the min value is within 80% of the max value.
| dbms | 256us | 1ms | 4ms | 16ms | 64ms | 256ms | 1s | 4s | 16s | gt | max |
|---|---|---|---|---|---|---|---|---|---|---|---|
| pg151_def.cx7_1g | 99.975 | 0.019 | 0.006 | nonzero | 0.009 | ||||||
| pg151_o2_nofp.cx7_1g | 99.973 | 0.020 | 0.006 | nonzero | 0.009 | ||||||
| pg151_o3.cx7_1g | 99.976 | 0.017 | 0.006 | nonzero | 0.012 | ||||||
| pg151_o3_native.cx7_1g | 99.982 | 0.012 | 0.005 | nonzero | 0.009 | ||||||
| pg151_o3_native_lto.cx7_1g | 99.984 | 0.010 | 0.006 | nonzero | 0.014 |
Insert response time histogram: each cell has the percentage of responses that take <= the time in the header and max is the max response time in seconds. For max values in the top 25% of the range have a red background and in the bottom 25% of the range have a green background. The red background is not used when the min value is within 80% of the max value.
| dbms | 256us | 1ms | 4ms | 16ms | 64ms | 256ms | 1s | 4s | 16s | gt | max |
|---|---|---|---|---|---|---|---|---|---|---|---|
| pg151_def.cx7_1g | 99.354 | 0.646 | 0.012 | ||||||||
| pg151_o2_nofp.cx7_1g | 99.493 | 0.507 | 0.014 | ||||||||
| pg151_o3.cx7_1g | 98.812 | 1.188 | 0.012 | ||||||||
| pg151_o3_native.cx7_1g | 99.389 | 0.611 | 0.012 | ||||||||
| pg151_o3_native_lto.cx7_1g | 99.396 | 0.604 | 0.010 |
Performance metrics for the DBMS listed above. Some are normalized by throughput, others are not. Legend for results is here.
ips	qps	rps	rmbps	wps	wmbps	rpq	rkbpq	wpi	wkbpi	csps	cpups	cspq	cpupq	dbgb1	dbgb2	rss	maxop	p50	p99	tag
399	40576	6	0.0	1292.7	15.4	0.000	0.001	3.241	39.607	154730	50.5	3.813	100	8.7	21.7	0.0	0.009	10341	8599	20m.pg151_def.cx7_1g
399	39753	6	0.0	1272.5	15.2	0.000	0.001	3.191	38.957	151619	50.5	3.814	102	8.7	21.6	0.0	0.009	10133	8359	20m.pg151_o2_nofp.cx7_1g
399	41236	7	0.0	1251.8	14.9	0.000	0.001	3.139	38.190	157247	50.5	3.813	98	8.7	21.8	0.0	0.012	10453	8503	20m.pg151_o3.cx7_1g
399	43805	7	0.0	1258.1	15.1	0.000	0.001	3.155	38.888	167061	50.6	3.814	92	8.7	21.9	0.0	0.009	11044	9366	20m.pg151_o3_native.cx7_1g
399	46148	2	0.0	1259.9	15.1	0.000	0.000	3.159	38.887	175956	50.6	3.813	88	8.7	22.5	0.0	0.014	11507	10041	20m.pg151_o3_native_lto.cx7_1g
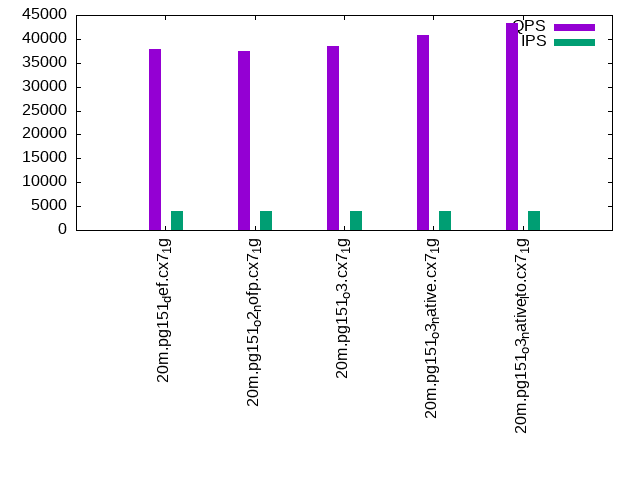
q500.1
q500.1: range queries with 500 insert/s per client. Graphs for performance per 1-second interval are here.
Average throughput:
Query response time histogram: each cell has the percentage of responses that take <= the time in the header and max is the max response time in seconds. For max values in the top 25% of the range have a red background and in the bottom 25% of the range have a green background. The red background is not used when the min value is within 80% of the max value.
| dbms | 256us | 1ms | 4ms | 16ms | 64ms | 256ms | 1s | 4s | 16s | gt | max |
|---|---|---|---|---|---|---|---|---|---|---|---|
| pg151_def.cx7_1g | 99.932 | 0.047 | 0.020 | 0.002 | nonzero | 0.018 | |||||
| pg151_o2_nofp.cx7_1g | 99.928 | 0.050 | 0.021 | 0.002 | nonzero | 0.019 | |||||
| pg151_o3.cx7_1g | 99.931 | 0.046 | 0.021 | 0.002 | nonzero | 0.019 | |||||
| pg151_o3_native.cx7_1g | 99.941 | 0.038 | 0.020 | 0.002 | 0.014 | ||||||
| pg151_o3_native_lto.cx7_1g | 99.944 | 0.035 | 0.019 | 0.002 | 0.015 |
Insert response time histogram: each cell has the percentage of responses that take <= the time in the header and max is the max response time in seconds. For max values in the top 25% of the range have a red background and in the bottom 25% of the range have a green background. The red background is not used when the min value is within 80% of the max value.
| dbms | 256us | 1ms | 4ms | 16ms | 64ms | 256ms | 1s | 4s | 16s | gt | max |
|---|---|---|---|---|---|---|---|---|---|---|---|
| pg151_def.cx7_1g | 95.453 | 4.501 | 0.046 | 0.024 | |||||||
| pg151_o2_nofp.cx7_1g | 93.592 | 6.338 | 0.071 | 0.034 | |||||||
| pg151_o3.cx7_1g | 90.138 | 9.751 | 0.111 | 0.028 | |||||||
| pg151_o3_native.cx7_1g | 93.388 | 6.528 | 0.085 | 0.032 | |||||||
| pg151_o3_native_lto.cx7_1g | 90.378 | 9.540 | 0.082 | 0.025 |
Performance metrics for the DBMS listed above. Some are normalized by throughput, others are not. Legend for results is here.
ips	qps	rps	rmbps	wps	wmbps	rpq	rkbpq	wpi	wkbpi	csps	cpups	cspq	cpupq	dbgb1	dbgb2	rss	maxop	p50	p99	tag
1994	39003	30	0.2	5723.5	54.8	0.001	0.006	2.870	28.155	147288	52.2	3.776	107	10.2	19.6	0.0	0.018	9861	8346	20m.pg151_def.cx7_1g
1994	38341	30	0.2	5716.5	54.8	0.001	0.006	2.866	28.124	144737	52.1	3.775	109	10.2	19.6	0.0	0.019	9701	7927	20m.pg151_o2_nofp.cx7_1g
1994	39877	33	0.3	5728.3	54.9	0.001	0.007	2.872	28.190	150632	52.1	3.777	105	10.2	19.7	0.0	0.019	9957	8247	20m.pg151_o3.cx7_1g
1994	41724	33	0.3	5744.5	55.1	0.001	0.006	2.880	28.275	157792	52.1	3.782	100	10.2	19.8	0.0	0.014	10532	8774	20m.pg151_o3_native.cx7_1g
1994	44768	33	0.3	5763.8	55.3	0.001	0.006	2.890	28.389	169390	52.0	3.784	93	10.2	20.1	0.0	0.015	11268	9558	20m.pg151_o3_native_lto.cx7_1g
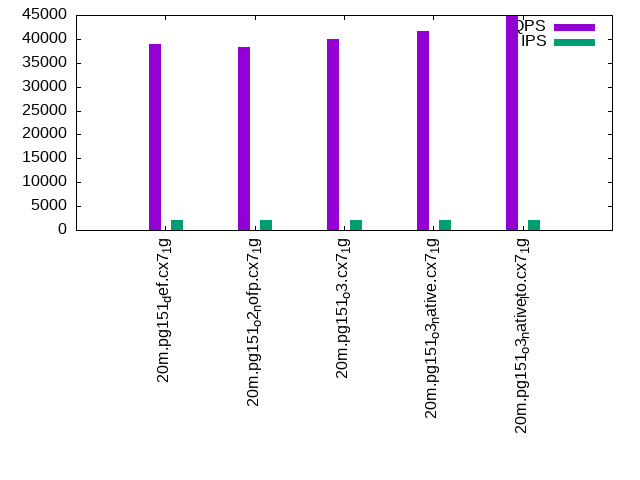
q1000.1
q1000.1: range queries with 1000 insert/s per client. Graphs for performance per 1-second interval are here.
Average throughput:
Query response time histogram: each cell has the percentage of responses that take <= the time in the header and max is the max response time in seconds. For max values in the top 25% of the range have a red background and in the bottom 25% of the range have a green background. The red background is not used when the min value is within 80% of the max value.
| dbms | 256us | 1ms | 4ms | 16ms | 64ms | 256ms | 1s | 4s | 16s | gt | max |
|---|---|---|---|---|---|---|---|---|---|---|---|
| pg151_def.cx7_1g | 99.873 | 0.095 | 0.029 | 0.003 | nonzero | 0.021 | |||||
| pg151_o2_nofp.cx7_1g | 99.869 | 0.099 | 0.030 | 0.003 | nonzero | 0.019 | |||||
| pg151_o3.cx7_1g | 99.876 | 0.091 | 0.030 | 0.003 | nonzero | 0.025 | |||||
| pg151_o3_native.cx7_1g | 99.889 | 0.081 | 0.028 | 0.002 | nonzero | 0.020 | |||||
| pg151_o3_native_lto.cx7_1g | 99.899 | 0.072 | 0.027 | 0.002 | nonzero | 0.022 |
Insert response time histogram: each cell has the percentage of responses that take <= the time in the header and max is the max response time in seconds. For max values in the top 25% of the range have a red background and in the bottom 25% of the range have a green background. The red background is not used when the min value is within 80% of the max value.
| dbms | 256us | 1ms | 4ms | 16ms | 64ms | 256ms | 1s | 4s | 16s | gt | max |
|---|---|---|---|---|---|---|---|---|---|---|---|
| pg151_def.cx7_1g | 91.151 | 8.759 | 0.090 | 0.028 | |||||||
| pg151_o2_nofp.cx7_1g | 88.941 | 10.942 | 0.117 | 0.031 | |||||||
| pg151_o3.cx7_1g | 88.561 | 11.298 | 0.141 | 0.032 | |||||||
| pg151_o3_native.cx7_1g | 93.819 | 6.112 | 0.069 | 0.027 | |||||||
| pg151_o3_native_lto.cx7_1g | 93.674 | 6.260 | 0.067 | 0.025 |
Performance metrics for the DBMS listed above. Some are normalized by throughput, others are not. Legend for results is here.
ips	qps	rps	rmbps	wps	wmbps	rpq	rkbpq	wpi	wkbpi	csps	cpups	cspq	cpupq	dbgb1	dbgb2	rss	maxop	p50	p99	tag
3989	37945	49	0.4	11318.2	99.8	0.001	0.011	2.837	25.623	140572	54.4	3.705	115	12.6	20.8	0.0	0.021	9478	8071	20m.pg151_def.cx7_1g
3989	37448	49	0.4	11311.0	99.8	0.001	0.011	2.836	25.610	138657	54.3	3.703	116	12.6	20.8	0.0	0.019	9477	8007	20m.pg151_o2_nofp.cx7_1g
3987	38520	47	0.4	11328.3	99.9	0.001	0.011	2.842	25.662	142873	54.4	3.709	113	12.6	20.8	0.0	0.025	9702	8023	20m.pg151_o3.cx7_1g
3987	40724	47	0.4	11358.1	100.1	0.001	0.011	2.849	25.722	151739	54.1	3.726	106	12.6	20.9	0.0	0.020	10213	8679	20m.pg151_o3_native.cx7_1g
3989	43267	62	0.5	11387.0	100.4	0.001	0.013	2.855	25.776	161362	53.9	3.729	100	12.6	21.0	0.0	0.022	10805	9494	20m.pg151_o3_native_lto.cx7_1g
l.i0
l.i0: load without secondary indexes
Performance metrics for all DBMS, not just the ones listed above. Some are normalized by throughput, others are not. Legend for results is here.
ips	qps	rps	rmbps	wps	wmbps	rpq	rkbpq	wpi	wkbpi	csps	cpups	cspq	cpupq	dbgb1	dbgb2	rss	maxop	p50	p99	tag
227273	0	0	0.0	365.6	114.9	0.000	0.000	0.002	0.518	24946	70.5	0.110	25	2.1	5.6	0.0	0.010	66228	11792	20m.pg151_def.cx7_1g
227273	0	0	0.0	365.3	115.1	0.000	0.000	0.002	0.518	25323	70.6	0.111	25	2.1	5.6	0.0	0.011	66129	52771	20m.pg151_o2_nofp.cx7_1g
238095	0	0	0.0	378.5	120.7	0.000	0.000	0.002	0.519	25949	70.1	0.109	24	2.1	5.6	0.0	0.014	69922	11987	20m.pg151_o3.cx7_1g
235294	0	0	0.0	373.6	116.9	0.000	0.000	0.002	0.509	25135	68.5	0.107	23	2.1	5.6	0.0	0.014	69126	59054	20m.pg151_o3_native.cx7_1g
256410	0	0	0.0	400.6	130.0	0.000	0.000	0.002	0.519	27580	69.7	0.108	22	2.1	5.6	0.0	0.010	75318	66728	20m.pg151_o3_native_lto.cx7_1g
l.x
l.x: create secondary indexes
Performance metrics for all DBMS, not just the ones listed above. Some are normalized by throughput, others are not. Legend for results is here.
ips	qps	rps	rmbps	wps	wmbps	rpq	rkbpq	wpi	wkbpi	csps	cpups	cspq	cpupq	dbgb1	dbgb2	rss	maxop	p50	p99	tag
236470	0	0	0.0	169.1	71.5	0.000	0.000	0.001	0.309	699	12.7	0.003	4	3.9	9.0	0.0	0.003	NA	NA	20m.pg151_def.cx7_1g
231034	0	0	0.0	154.9	65.0	0.000	0.000	0.001	0.288	728	12.7	0.003	4	3.9	9.0	0.0	0.003	NA	NA	20m.pg151_o2_nofp.cx7_1g
236470	0	0	0.0	162.6	71.1	0.000	0.000	0.001	0.308	781	12.5	0.003	4	3.9	9.0	0.0	0.003	NA	NA	20m.pg151_o3.cx7_1g
233721	0	0	0.0	161.2	70.5	0.000	0.000	0.001	0.309	742	12.6	0.003	4	3.9	9.0	0.0	0.003	NA	NA	20m.pg151_o3_native.cx7_1g
251250	0	0	0.0	148.0	63.6	0.000	0.000	0.001	0.259	785	12.7	0.003	4	3.9	9.0	0.0	0.003	NA	NA	20m.pg151_o3_native_lto.cx7_1g
l.i1
l.i1: continue load after secondary indexes created
Performance metrics for all DBMS, not just the ones listed above. Some are normalized by throughput, others are not. Legend for results is here.
ips	qps	rps	rmbps	wps	wmbps	rpq	rkbpq	wpi	wkbpi	csps	cpups	cspq	cpupq	dbgb1	dbgb2	rss	maxop	p50	p99	tag
60976	0	165	2.9	41606.5	775.9	0.003	0.049	0.682	13.030	34378	62.0	0.564	81	8.6	25.7	0.0	0.054	15533	6842	20m.pg151_def.cx7_1g
60606	0	164	2.9	41563.4	774.6	0.003	0.049	0.686	13.088	34122	62.2	0.563	82	8.6	25.7	0.0	0.048	15444	8945	20m.pg151_o2_nofp.cx7_1g
62112	0	156	1.1	41668.9	783.6	0.003	0.018	0.671	12.919	35260	62.1	0.568	80	8.6	25.1	0.0	0.053	15783	6395	20m.pg151_o3.cx7_1g
65146	0	171	1.2	43146.6	821.5	0.003	0.019	0.662	12.912	39306	62.5	0.603	77	8.6	25.2	0.0	0.060	16788	8540	20m.pg151_o3_native.cx7_1g
67340	0	183	1.3	43608.3	846.1	0.003	0.019	0.648	12.866	41067	62.8	0.610	75	8.6	25.3	0.0	0.072	17281	8145	20m.pg151_o3_native_lto.cx7_1g
q100.1
q100.1: range queries with 100 insert/s per client
Performance metrics for all DBMS, not just the ones listed above. Some are normalized by throughput, others are not. Legend for results is here.
ips	qps	rps	rmbps	wps	wmbps	rpq	rkbpq	wpi	wkbpi	csps	cpups	cspq	cpupq	dbgb1	dbgb2	rss	maxop	p50	p99	tag
399	40576	6	0.0	1292.7	15.4	0.000	0.001	3.241	39.607	154730	50.5	3.813	100	8.7	21.7	0.0	0.009	10341	8599	20m.pg151_def.cx7_1g
399	39753	6	0.0	1272.5	15.2	0.000	0.001	3.191	38.957	151619	50.5	3.814	102	8.7	21.6	0.0	0.009	10133	8359	20m.pg151_o2_nofp.cx7_1g
399	41236	7	0.0	1251.8	14.9	0.000	0.001	3.139	38.190	157247	50.5	3.813	98	8.7	21.8	0.0	0.012	10453	8503	20m.pg151_o3.cx7_1g
399	43805	7	0.0	1258.1	15.1	0.000	0.001	3.155	38.888	167061	50.6	3.814	92	8.7	21.9	0.0	0.009	11044	9366	20m.pg151_o3_native.cx7_1g
399	46148	2	0.0	1259.9	15.1	0.000	0.000	3.159	38.887	175956	50.6	3.813	88	8.7	22.5	0.0	0.014	11507	10041	20m.pg151_o3_native_lto.cx7_1g
q500.1
q500.1: range queries with 500 insert/s per client
Performance metrics for all DBMS, not just the ones listed above. Some are normalized by throughput, others are not. Legend for results is here.
ips	qps	rps	rmbps	wps	wmbps	rpq	rkbpq	wpi	wkbpi	csps	cpups	cspq	cpupq	dbgb1	dbgb2	rss	maxop	p50	p99	tag
1994	39003	30	0.2	5723.5	54.8	0.001	0.006	2.870	28.155	147288	52.2	3.776	107	10.2	19.6	0.0	0.018	9861	8346	20m.pg151_def.cx7_1g
1994	38341	30	0.2	5716.5	54.8	0.001	0.006	2.866	28.124	144737	52.1	3.775	109	10.2	19.6	0.0	0.019	9701	7927	20m.pg151_o2_nofp.cx7_1g
1994	39877	33	0.3	5728.3	54.9	0.001	0.007	2.872	28.190	150632	52.1	3.777	105	10.2	19.7	0.0	0.019	9957	8247	20m.pg151_o3.cx7_1g
1994	41724	33	0.3	5744.5	55.1	0.001	0.006	2.880	28.275	157792	52.1	3.782	100	10.2	19.8	0.0	0.014	10532	8774	20m.pg151_o3_native.cx7_1g
1994	44768	33	0.3	5763.8	55.3	0.001	0.006	2.890	28.389	169390	52.0	3.784	93	10.2	20.1	0.0	0.015	11268	9558	20m.pg151_o3_native_lto.cx7_1g
q1000.1
q1000.1: range queries with 1000 insert/s per client
Performance metrics for all DBMS, not just the ones listed above. Some are normalized by throughput, others are not. Legend for results is here.
ips	qps	rps	rmbps	wps	wmbps	rpq	rkbpq	wpi	wkbpi	csps	cpups	cspq	cpupq	dbgb1	dbgb2	rss	maxop	p50	p99	tag
3989	37945	49	0.4	11318.2	99.8	0.001	0.011	2.837	25.623	140572	54.4	3.705	115	12.6	20.8	0.0	0.021	9478	8071	20m.pg151_def.cx7_1g
3989	37448	49	0.4	11311.0	99.8	0.001	0.011	2.836	25.610	138657	54.3	3.703	116	12.6	20.8	0.0	0.019	9477	8007	20m.pg151_o2_nofp.cx7_1g
3987	38520	47	0.4	11328.3	99.9	0.001	0.011	2.842	25.662	142873	54.4	3.709	113	12.6	20.8	0.0	0.025	9702	8023	20m.pg151_o3.cx7_1g
3987	40724	47	0.4	11358.1	100.1	0.001	0.011	2.849	25.722	151739	54.1	3.726	106	12.6	20.9	0.0	0.020	10213	8679	20m.pg151_o3_native.cx7_1g
3989	43267	62	0.5	11387.0	100.4	0.001	0.013	2.855	25.776	161362	53.9	3.729	100	12.6	21.0	0.0	0.022	10805	9494	20m.pg151_o3_native_lto.cx7_1g
l.i0
- l.i0: load without secondary indexes
- Legend for results is here.
- Each entry lists the percentage of responses that fit in that bucket (slower than max time for previous bucket, faster than min time for next bucket).
Insert response time histogram
256us	1ms	4ms	16ms	64ms	256ms	1s	4s	16s	gt	max	tag
0.000	0.000	99.934	0.066	0.000	0.000	0.000	0.000	0.000	0.000	0.010	pg151_def.cx7_1g
0.000	0.000	99.930	0.069	0.000	0.000	0.000	0.000	0.000	0.000	0.011	pg151_o2_nofp.cx7_1g
0.000	0.000	99.934	0.066	0.000	0.000	0.000	0.000	0.000	0.000	0.014	pg151_o3.cx7_1g
0.000	0.000	99.944	0.056	0.000	0.000	0.000	0.000	0.000	0.000	0.014	pg151_o3_native.cx7_1g
0.000	0.006	99.924	0.070	0.000	0.000	0.000	0.000	0.000	0.000	0.010	pg151_o3_native_lto.cx7_1g
l.x
- l.x: create secondary indexes
- Legend for results is here.
- Each entry lists the percentage of responses that fit in that bucket (slower than max time for previous bucket, faster than min time for next bucket).
TODO - determine whether there is data for create index response time
l.i1
- l.i1: continue load after secondary indexes created
- Legend for results is here.
- Each entry lists the percentage of responses that fit in that bucket (slower than max time for previous bucket, faster than min time for next bucket).
Insert response time histogram
256us	1ms	4ms	16ms	64ms	256ms	1s	4s	16s	gt	max	tag
0.000	0.000	95.681	4.257	0.062	0.000	0.000	0.000	0.000	0.000	0.054	pg151_def.cx7_1g
0.000	0.000	95.611	4.331	0.058	0.000	0.000	0.000	0.000	0.000	0.048	pg151_o2_nofp.cx7_1g
0.000	0.000	96.602	3.335	0.063	0.000	0.000	0.000	0.000	0.000	0.053	pg151_o3.cx7_1g
0.000	0.000	97.692	2.236	0.072	0.000	0.000	0.000	0.000	0.000	0.060	pg151_o3_native.cx7_1g
0.000	0.000	98.053	1.865	0.081	0.001	0.000	0.000	0.000	0.000	0.072	pg151_o3_native_lto.cx7_1g
q100.1
- q100.1: range queries with 100 insert/s per client
- Legend for results is here.
- Each entry lists the percentage of responses that fit in that bucket (slower than max time for previous bucket, faster than min time for next bucket).
Query response time histogram
256us	1ms	4ms	16ms	64ms	256ms	1s	4s	16s	gt	max	tag
99.975	0.019	0.006	nonzero	0.000	0.000	0.000	0.000	0.000	0.000	0.009	pg151_def.cx7_1g
99.973	0.020	0.006	nonzero	0.000	0.000	0.000	0.000	0.000	0.000	0.009	pg151_o2_nofp.cx7_1g
99.976	0.017	0.006	nonzero	0.000	0.000	0.000	0.000	0.000	0.000	0.012	pg151_o3.cx7_1g
99.982	0.012	0.005	nonzero	0.000	0.000	0.000	0.000	0.000	0.000	0.009	pg151_o3_native.cx7_1g
99.984	0.010	0.006	nonzero	0.000	0.000	0.000	0.000	0.000	0.000	0.014	pg151_o3_native_lto.cx7_1g
Insert response time histogram
256us	1ms	4ms	16ms	64ms	256ms	1s	4s	16s	gt	max	tag
0.000	0.000	99.354	0.646	0.000	0.000	0.000	0.000	0.000	0.000	0.012	pg151_def.cx7_1g
0.000	0.000	99.493	0.507	0.000	0.000	0.000	0.000	0.000	0.000	0.014	pg151_o2_nofp.cx7_1g
0.000	0.000	98.812	1.188	0.000	0.000	0.000	0.000	0.000	0.000	0.012	pg151_o3.cx7_1g
0.000	0.000	99.389	0.611	0.000	0.000	0.000	0.000	0.000	0.000	0.012	pg151_o3_native.cx7_1g
0.000	0.000	99.396	0.604	0.000	0.000	0.000	0.000	0.000	0.000	0.010	pg151_o3_native_lto.cx7_1g
q500.1
- q500.1: range queries with 500 insert/s per client
- Legend for results is here.
- Each entry lists the percentage of responses that fit in that bucket (slower than max time for previous bucket, faster than min time for next bucket).
Query response time histogram
256us	1ms	4ms	16ms	64ms	256ms	1s	4s	16s	gt	max	tag
99.932	0.047	0.020	0.002	nonzero	0.000	0.000	0.000	0.000	0.000	0.018	pg151_def.cx7_1g
99.928	0.050	0.021	0.002	nonzero	0.000	0.000	0.000	0.000	0.000	0.019	pg151_o2_nofp.cx7_1g
99.931	0.046	0.021	0.002	nonzero	0.000	0.000	0.000	0.000	0.000	0.019	pg151_o3.cx7_1g
99.941	0.038	0.020	0.002	0.000	0.000	0.000	0.000	0.000	0.000	0.014	pg151_o3_native.cx7_1g
99.944	0.035	0.019	0.002	0.000	0.000	0.000	0.000	0.000	0.000	0.015	pg151_o3_native_lto.cx7_1g
Insert response time histogram
256us	1ms	4ms	16ms	64ms	256ms	1s	4s	16s	gt	max	tag
0.000	0.000	95.453	4.501	0.046	0.000	0.000	0.000	0.000	0.000	0.024	pg151_def.cx7_1g
0.000	0.000	93.592	6.338	0.071	0.000	0.000	0.000	0.000	0.000	0.034	pg151_o2_nofp.cx7_1g
0.000	0.000	90.138	9.751	0.111	0.000	0.000	0.000	0.000	0.000	0.028	pg151_o3.cx7_1g
0.000	0.000	93.388	6.528	0.085	0.000	0.000	0.000	0.000	0.000	0.032	pg151_o3_native.cx7_1g
0.000	0.000	90.378	9.540	0.082	0.000	0.000	0.000	0.000	0.000	0.025	pg151_o3_native_lto.cx7_1g
q1000.1
- q1000.1: range queries with 1000 insert/s per client
- Legend for results is here.
- Each entry lists the percentage of responses that fit in that bucket (slower than max time for previous bucket, faster than min time for next bucket).
Query response time histogram
256us	1ms	4ms	16ms	64ms	256ms	1s	4s	16s	gt	max	tag
99.873	0.095	0.029	0.003	nonzero	0.000	0.000	0.000	0.000	0.000	0.021	pg151_def.cx7_1g
99.869	0.099	0.030	0.003	nonzero	0.000	0.000	0.000	0.000	0.000	0.019	pg151_o2_nofp.cx7_1g
99.876	0.091	0.030	0.003	nonzero	0.000	0.000	0.000	0.000	0.000	0.025	pg151_o3.cx7_1g
99.889	0.081	0.028	0.002	nonzero	0.000	0.000	0.000	0.000	0.000	0.020	pg151_o3_native.cx7_1g
99.899	0.072	0.027	0.002	nonzero	0.000	0.000	0.000	0.000	0.000	0.022	pg151_o3_native_lto.cx7_1g
Insert response time histogram
256us	1ms	4ms	16ms	64ms	256ms	1s	4s	16s	gt	max	tag
0.000	0.000	91.151	8.759	0.090	0.000	0.000	0.000	0.000	0.000	0.028	pg151_def.cx7_1g
0.000	0.000	88.941	10.942	0.117	0.000	0.000	0.000	0.000	0.000	0.031	pg151_o2_nofp.cx7_1g
0.000	0.000	88.561	11.298	0.141	0.000	0.000	0.000	0.000	0.000	0.032	pg151_o3.cx7_1g
0.000	0.000	93.819	6.112	0.069	0.000	0.000	0.000	0.000	0.000	0.027	pg151_o3_native.cx7_1g
0.000	0.000	93.674	6.260	0.067	0.000	0.000	0.000	0.000	0.000	0.025	pg151_o3_native_lto.cx7_1g