Introduction
This is a report for the insert benchmark with 20M docs and 4 client(s). It is generated by scripts (bash, awk, sed) and Tufte might not be impressed. An overview of the insert benchmark is here and a short update is here. Below, by DBMS, I mean DBMS+version.config. An example is my8020.c10b40 where my means MySQL, 8020 is version 8.0.20 and c10b40 is the name for the configuration file.
The test server has 8 AMD cores, 16G RAM and an NVMe SSD. It is described here as the Beelink. The benchmark was run with 4 clients and there were 1 or 2 connections per client (1 for queries, 1 for inserts). It uses 4 tables, 1 table per client. It loads 20M rows without secondary indexes, creates secondary indexes, loads another 20M rows then does 3 read+write tests for one hour each that do queries as fast as possible with 100, 500 and then 1000 writes/second/client concurrent with the queries. The database is cached by the storage engine and the only IO is for writes. Clients and the DBMS share one server. The per-database configs are in the per-database subdirectories here.
The tested DBMS are:
- pg151_def.cx7 - Postgres 15.1, the cx7 config and the build used: -O2
- pg151_o2_nofp.cx7 - Postgres 15.1, the cx7 config and the build used: -O2 -no-omit-frame-pointer
- pg151_o3.cx7 - Postgres 15.1, the cx7 config and the build used: -O3
- pg151_o3_native.cx7 - Postgres 15.1, the cx7 config and the build used: -O3 -march=native -mtune=native
- pg151_o3_native_lto.cx7 - Postgres 15.1, the cx7 config and the build used: -O3 -march=native -mtune=native and -flto
Contents
- Summary
- l.i0: load without secondary indexes
- l.x: create secondary indexes
- l.i1: continue load after secondary indexes created
- q100.1: range queries with 100 insert/s per client
- q500.1: range queries with 500 insert/s per client
- q1000.1: range queries with 1000 insert/s per client
Summary
The numbers are inserts/s for l.i0 and l.i1, indexed docs (or rows) /s for l.x and queries/s for q*.2. The values are the average rate over the entire test for inserts (IPS) and queries (QPS). The range of values for IPS and QPS is split into 3 parts: bottom 25%, middle 50%, top 25%. Values in the bottom 25% have a red background, values in the top 25% have a green background and values in the middle have no color. A gray background is used for values that can be ignored because the DBMS did not sustain the target insert rate. Red backgrounds are not used when the minimum value is within 80% of the max value.
| dbms | l.i0 | l.x | l.i1 | q100.1 | q500.1 | q1000.1 |
|---|---|---|---|---|---|---|
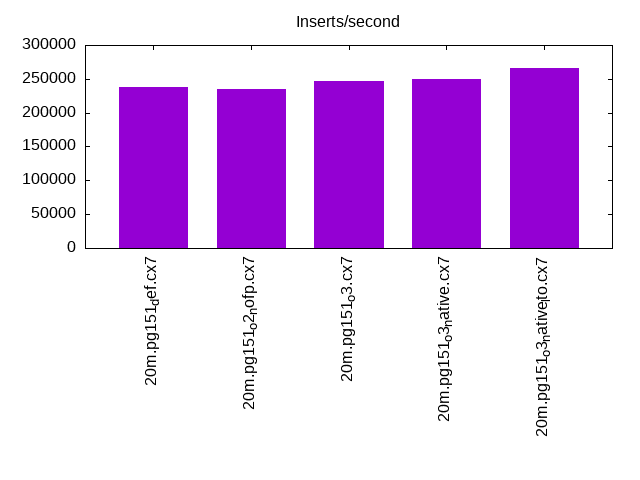
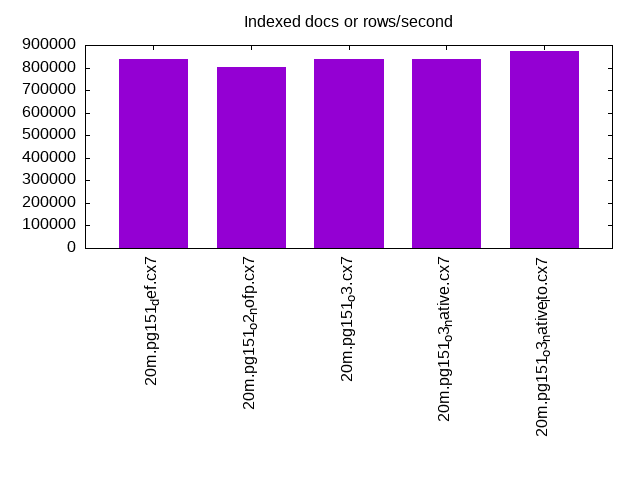
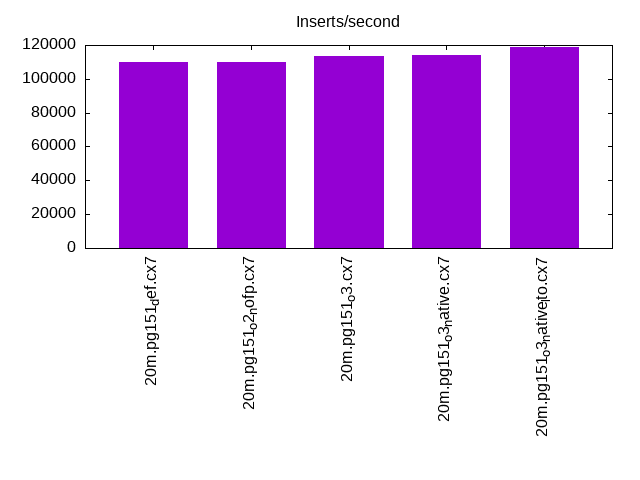
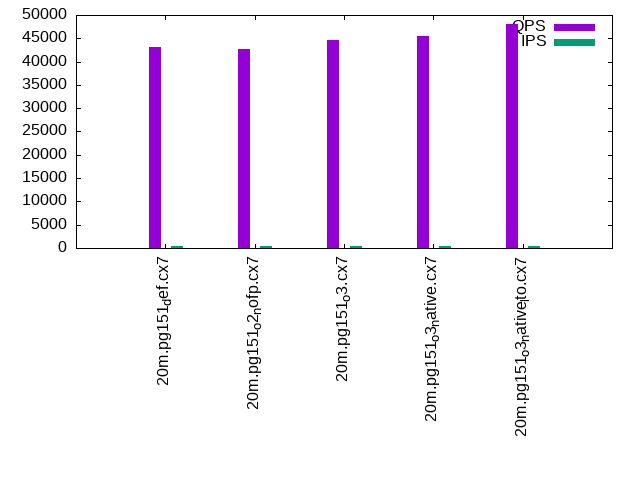
| 20m.pg151_def.cx7 | 238095 | 837500 | 109890 | 43225 | 42161 | 42030 |
| 20m.pg151_o2_nofp.cx7 | 235294 | 804000 | 109890 | 42768 | 41985 | 41665 |
| 20m.pg151_o3.cx7 | 246914 | 837500 | 113636 | 44640 | 43542 | 42938 |
| 20m.pg151_o3_native.cx7 | 250000 | 837500 | 114286 | 45582 | 44598 | 43713 |
| 20m.pg151_o3_native_lto.cx7 | 266667 | 873913 | 119048 | 48015 | 47362 | 46328 |
This table has relative throughput, throughput for the DBMS relative to the DBMS in the first line, using the absolute throughput from the previous table.
| dbms | l.i0 | l.x | l.i1 | q100.1 | q500.1 | q1000.1 |
|---|---|---|---|---|---|---|
| 20m.pg151_def.cx7 | 1.00 | 1.00 | 1.00 | 1.00 | 1.00 | 1.00 |
| 20m.pg151_o2_nofp.cx7 | 0.99 | 0.96 | 1.00 | 0.99 | 1.00 | 0.99 |
| 20m.pg151_o3.cx7 | 1.04 | 1.00 | 1.03 | 1.03 | 1.03 | 1.02 |
| 20m.pg151_o3_native.cx7 | 1.05 | 1.00 | 1.04 | 1.05 | 1.06 | 1.04 |
| 20m.pg151_o3_native_lto.cx7 | 1.12 | 1.04 | 1.08 | 1.11 | 1.12 | 1.10 |
This lists the average rate of inserts/s for the tests that do inserts concurrent with queries. For such tests the query rate is listed in the table above. The read+write tests are setup so that the insert rate should match the target rate every second. Cells that are not at least 95% of the target have a red background to indicate a failure to satisfy the target.
| dbms | q100.1 | q500.1 | q1000.1 |
|---|---|---|---|
| pg151_def.cx7 | 399 | 1994 | 3989 |
| pg151_o2_nofp.cx7 | 399 | 1994 | 3989 |
| pg151_o3.cx7 | 399 | 1993 | 3989 |
| pg151_o3_native.cx7 | 399 | 1993 | 3989 |
| pg151_o3_native_lto.cx7 | 399 | 1994 | 3989 |
| target | 400 | 2000 | 4000 |
l.i0
l.i0: load without secondary indexes. Graphs for performance per 1-second interval are here.
Average throughput:
Insert response time histogram: each cell has the percentage of responses that take <= the time in the header and max is the max response time in seconds. For the max column values in the top 25% of the range have a red background and in the bottom 25% of the range have a green background. The red background is not used when the min value is within 80% of the max value.
| dbms | 256us | 1ms | 4ms | 16ms | 64ms | 256ms | 1s | 4s | 16s | gt | max |
|---|---|---|---|---|---|---|---|---|---|---|---|
| pg151_def.cx7 | 99.977 | 0.023 | 0.011 | ||||||||
| pg151_o2_nofp.cx7 | 99.971 | 0.030 | 0.011 | ||||||||
| pg151_o3.cx7 | 99.970 | 0.030 | 0.010 | ||||||||
| pg151_o3_native.cx7 | 99.972 | 0.028 | 0.001 | 0.018 | |||||||
| pg151_o3_native_lto.cx7 | 99.968 | 0.032 | 0.011 |
Performance metrics for the DBMS listed above. Some are normalized by throughput, others are not. Legend for results is here.
ips	qps	rps	rmbps	wps	wmbps	rpq	rkbpq	wpi	wkbpi	csps	cpups	cspq	cpupq	dbgb1	dbgb2	rss	maxop	p50	p99	tag
238095	0	0	0.0	279.8	102.8	0.000	0.000	0.001	0.442	24387	71.4	0.102	24	1.9	5.2	0.0	0.011	69625	63652	20m.pg151_def.cx7
235294	0	0	0.0	269.6	98.8	0.000	0.000	0.001	0.430	23282	70.1	0.099	24	1.9	5.2	0.0	0.011	69448	2997	20m.pg151_o2_nofp.cx7
246914	0	0	0.0	290.5	106.5	0.000	0.000	0.001	0.442	24699	69.5	0.100	23	1.9	5.2	0.0	0.010	74120	25881	20m.pg151_o3.cx7
250000	0	0	0.0	289.1	106.4	0.000	0.000	0.001	0.436	24538	69.4	0.098	22	1.9	5.2	0.0	0.018	74245	51744	20m.pg151_o3_native.cx7
266667	0	0	0.0	293.2	105.7	0.000	0.000	0.001	0.406	26154	68.8	0.098	21	1.9	5.2	0.0	0.011	79838	22176	20m.pg151_o3_native_lto.cx7
l.x
l.x: create secondary indexes.
Average throughput:
Performance metrics for the DBMS listed above. Some are normalized by throughput, others are not. Legend for results is here.
ips	qps	rps	rmbps	wps	wmbps	rpq	rkbpq	wpi	wkbpi	csps	cpups	cspq	cpupq	dbgb1	dbgb2	rss	maxop	p50	p99	tag
837500	0	0	0.0	344.9	159.4	0.000	0.000	0.000	0.195	1566	39.2	0.002	4	3.7	8.6	0.0	0.004	NA	NA	20m.pg151_def.cx7
804000	0	0	0.0	464.0	213.8	0.000	0.000	0.001	0.272	2227	38.7	0.003	4	3.7	8.6	0.0	0.004	NA	NA	20m.pg151_o2_nofp.cx7
837500	0	0	0.0	342.6	158.5	0.000	0.000	0.000	0.194	1628	40.8	0.002	4	3.7	8.6	0.0	0.004	NA	NA	20m.pg151_o3.cx7
837500	0	0	0.0	356.0	162.9	0.000	0.000	0.000	0.199	1575	39.2	0.002	4	3.7	8.6	0.0	0.004	NA	NA	20m.pg151_o3_native.cx7
873913	0	0	0.0	399.4	185.2	0.000	0.000	0.000	0.217	1265	39.4	0.001	4	3.7	8.6	0.0	0.004	NA	NA	20m.pg151_o3_native_lto.cx7
l.i1
l.i1: continue load after secondary indexes created. Graphs for performance per 1-second interval are here.
Average throughput:
Insert response time histogram: each cell has the percentage of responses that take <= the time in the header and max is the max response time in seconds. For the max column values in the top 25% of the range have a red background and in the bottom 25% of the range have a green background. The red background is not used when the min value is within 80% of the max value.
| dbms | 256us | 1ms | 4ms | 16ms | 64ms | 256ms | 1s | 4s | 16s | gt | max |
|---|---|---|---|---|---|---|---|---|---|---|---|
| pg151_def.cx7 | 99.983 | 0.017 | 0.001 | 0.062 | |||||||
| pg151_o2_nofp.cx7 | 99.981 | 0.019 | 0.010 | ||||||||
| pg151_o3.cx7 | 99.986 | 0.014 | 0.011 | ||||||||
| pg151_o3_native.cx7 | 99.990 | 0.010 | 0.013 | ||||||||
| pg151_o3_native_lto.cx7 | 99.987 | 0.012 | 0.001 | 0.051 |
Performance metrics for the DBMS listed above. Some are normalized by throughput, others are not. Legend for results is here.
ips	qps	rps	rmbps	wps	wmbps	rpq	rkbpq	wpi	wkbpi	csps	cpups	cspq	cpupq	dbgb1	dbgb2	rss	maxop	p50	p99	tag
109890	0	0	0.0	329.2	113.3	0.000	0.000	0.003	1.056	22646	65.4	0.206	48	7.6	20.7	0.0	0.062	28729	18538	20m.pg151_def.cx7
109890	0	0	0.0	333.7	114.1	0.000	0.000	0.003	1.063	22444	65.5	0.204	48	7.6	20.7	1.2	0.010	28719	19978	20m.pg151_o2_nofp.cx7
113636	0	0	0.0	342.4	117.4	0.000	0.000	0.003	1.058	22988	65.8	0.202	46	7.6	20.7	0.0	0.011	29529	19628	20m.pg151_o3.cx7
114286	0	0	0.0	343.5	117.9	0.000	0.000	0.003	1.056	22989	65.6	0.201	46	7.6	20.7	0.0	0.013	29718	20085	20m.pg151_o3_native.cx7
119048	0	0	0.0	358.8	124.1	0.000	0.000	0.003	1.067	24075	66.2	0.202	44	7.6	20.7	0.0	0.051	31266	20827	20m.pg151_o3_native_lto.cx7
q100.1
q100.1: range queries with 100 insert/s per client. Graphs for performance per 1-second interval are here.
Average throughput:
Query response time histogram: each cell has the percentage of responses that take <= the time in the header and max is the max response time in seconds. For max values in the top 25% of the range have a red background and in the bottom 25% of the range have a green background. The red background is not used when the min value is within 80% of the max value.
| dbms | 256us | 1ms | 4ms | 16ms | 64ms | 256ms | 1s | 4s | 16s | gt | max |
|---|---|---|---|---|---|---|---|---|---|---|---|
| pg151_def.cx7 | 99.983 | 0.012 | 0.005 | nonzero | 0.010 | ||||||
| pg151_o2_nofp.cx7 | 99.982 | 0.012 | 0.006 | nonzero | 0.010 | ||||||
| pg151_o3.cx7 | 99.983 | 0.011 | 0.006 | nonzero | 0.010 | ||||||
| pg151_o3_native.cx7 | 99.985 | 0.010 | 0.005 | nonzero | 0.010 | ||||||
| pg151_o3_native_lto.cx7 | 99.986 | 0.009 | 0.005 | nonzero | 0.010 |
Insert response time histogram: each cell has the percentage of responses that take <= the time in the header and max is the max response time in seconds. For max values in the top 25% of the range have a red background and in the bottom 25% of the range have a green background. The red background is not used when the min value is within 80% of the max value.
| dbms | 256us | 1ms | 4ms | 16ms | 64ms | 256ms | 1s | 4s | 16s | gt | max |
|---|---|---|---|---|---|---|---|---|---|---|---|
| pg151_def.cx7 | 99.556 | 0.444 | 0.012 | ||||||||
| pg151_o2_nofp.cx7 | 99.639 | 0.354 | 0.007 | 0.017 | |||||||
| pg151_o3.cx7 | 99.590 | 0.410 | 0.015 | ||||||||
| pg151_o3_native.cx7 | 99.771 | 0.229 | 0.012 | ||||||||
| pg151_o3_native_lto.cx7 | 99.792 | 0.208 | 0.011 |
Performance metrics for the DBMS listed above. Some are normalized by throughput, others are not. Legend for results is here.
ips	qps	rps	rmbps	wps	wmbps	rpq	rkbpq	wpi	wkbpi	csps	cpups	cspq	cpupq	dbgb1	dbgb2	rss	maxop	p50	p99	tag
399	43225	0	0.0	354.7	15.5	0.000	0.000	0.890	39.764	164823	50.5	3.813	93	7.8	22.5	0.0	0.010	11028	8982	20m.pg151_def.cx7
399	42768	0	0.0	355.4	15.5	0.000	0.000	0.891	39.894	163013	50.5	3.812	94	7.8	22.6	0.0	0.010	10904	8950	20m.pg151_o2_nofp.cx7
399	44640	0	0.0	354.7	15.6	0.000	0.000	0.889	40.025	170220	50.7	3.813	91	7.8	22.5	0.0	0.010	11267	9605	20m.pg151_o3.cx7
399	45582	0	0.0	354.5	15.5	0.000	0.000	0.889	39.918	173776	50.7	3.812	89	7.8	22.5	0.0	0.010	11587	10053	20m.pg151_o3_native.cx7
399	48015	0	0.0	354.7	15.5	0.000	0.000	0.890	39.840	183159	50.6	3.815	84	7.8	22.5	0.0	0.010	11975	10596	20m.pg151_o3_native_lto.cx7
q500.1
q500.1: range queries with 500 insert/s per client. Graphs for performance per 1-second interval are here.
Average throughput:

Query response time histogram: each cell has the percentage of responses that take <= the time in the header and max is the max response time in seconds. For max values in the top 25% of the range have a red background and in the bottom 25% of the range have a green background. The red background is not used when the min value is within 80% of the max value.
| dbms | 256us | 1ms | 4ms | 16ms | 64ms | 256ms | 1s | 4s | 16s | gt | max |
|---|---|---|---|---|---|---|---|---|---|---|---|
| pg151_def.cx7 | 99.948 | 0.033 | 0.018 | 0.001 | nonzero | 0.019 | |||||
| pg151_o2_nofp.cx7 | 99.948 | 0.032 | 0.018 | 0.001 | nonzero | 0.018 | |||||
| pg151_o3.cx7 | 99.949 | 0.032 | 0.018 | 0.001 | nonzero | 0.018 | |||||
| pg151_o3_native.cx7 | 99.952 | 0.030 | 0.018 | nonzero | nonzero | 0.017 | |||||
| pg151_o3_native_lto.cx7 | 99.959 | 0.024 | 0.016 | 0.001 | nonzero | 0.017 |
Insert response time histogram: each cell has the percentage of responses that take <= the time in the header and max is the max response time in seconds. For max values in the top 25% of the range have a red background and in the bottom 25% of the range have a green background. The red background is not used when the min value is within 80% of the max value.
| dbms | 256us | 1ms | 4ms | 16ms | 64ms | 256ms | 1s | 4s | 16s | gt | max |
|---|---|---|---|---|---|---|---|---|---|---|---|
| pg151_def.cx7 | 98.399 | 1.586 | 0.015 | 0.019 | |||||||
| pg151_o2_nofp.cx7 | 97.562 | 2.379 | 0.058 | 0.028 | |||||||
| pg151_o3.cx7 | 98.686 | 1.294 | 0.019 | 0.032 | |||||||
| pg151_o3_native.cx7 | 98.949 | 1.042 | 0.010 | 0.021 | |||||||
| pg151_o3_native_lto.cx7 | 98.467 | 1.514 | 0.019 | 0.024 |
Performance metrics for the DBMS listed above. Some are normalized by throughput, others are not. Legend for results is here.
ips	qps	rps	rmbps	wps	wmbps	rpq	rkbpq	wpi	wkbpi	csps	cpups	cspq	cpupq	dbgb1	dbgb2	rss	maxop	p50	p99	tag
1994	42161	0	0.0	365.7	24.2	0.000	0.000	0.183	12.425	159921	51.3	3.793	97	9.4	22.0	0.0	0.019	10788	8966	20m.pg151_def.cx7
1994	41985	0	0.0	365.1	24.2	0.000	0.000	0.183	12.435	159254	51.3	3.793	98	9.4	22.0	0.0	0.018	10616	8551	20m.pg151_o2_nofp.cx7
1993	43542	0	0.0	366.1	24.0	0.000	0.000	0.184	12.331	165352	51.3	3.797	94	9.4	22.0	0.0	0.018	11044	9126	20m.pg151_o3.cx7
1993	44598	0	0.0	366.1	24.0	0.000	0.000	0.184	12.313	169340	51.4	3.797	92	9.4	22.0	0.0	0.017	11268	9174	20m.pg151_o3_native.cx7
1994	47362	0	0.0	364.6	23.9	0.000	0.000	0.183	12.253	179771	51.4	3.796	87	9.4	22.0	0.0	0.017	11923	10261	20m.pg151_o3_native_lto.cx7
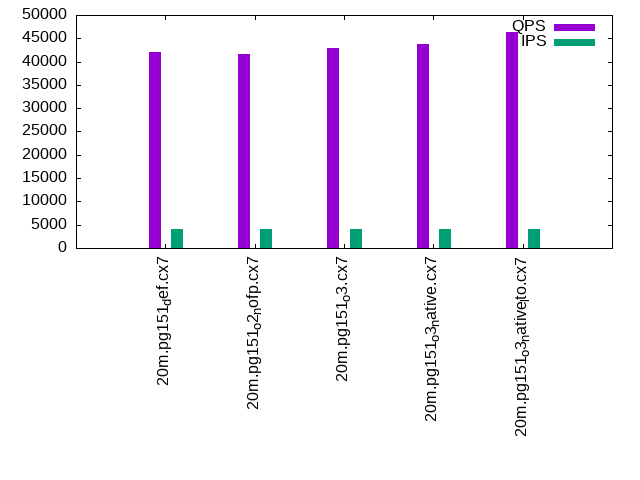
q1000.1
q1000.1: range queries with 1000 insert/s per client. Graphs for performance per 1-second interval are here.
Average throughput:
Query response time histogram: each cell has the percentage of responses that take <= the time in the header and max is the max response time in seconds. For max values in the top 25% of the range have a red background and in the bottom 25% of the range have a green background. The red background is not used when the min value is within 80% of the max value.
| dbms | 256us | 1ms | 4ms | 16ms | 64ms | 256ms | 1s | 4s | 16s | gt | max |
|---|---|---|---|---|---|---|---|---|---|---|---|
| pg151_def.cx7 | 99.892 | 0.074 | 0.033 | 0.001 | nonzero | 0.056 | |||||
| pg151_o2_nofp.cx7 | 99.900 | 0.071 | 0.028 | 0.001 | nonzero | 0.043 | |||||
| pg151_o3.cx7 | 99.906 | 0.066 | 0.027 | 0.001 | nonzero | 0.048 | |||||
| pg151_o3_native.cx7 | 99.905 | 0.065 | 0.030 | 0.001 | nonzero | 0.061 | |||||
| pg151_o3_native_lto.cx7 | 99.916 | 0.057 | 0.027 | 0.001 | nonzero | 0.051 |
Insert response time histogram: each cell has the percentage of responses that take <= the time in the header and max is the max response time in seconds. For max values in the top 25% of the range have a red background and in the bottom 25% of the range have a green background. The red background is not used when the min value is within 80% of the max value.
| dbms | 256us | 1ms | 4ms | 16ms | 64ms | 256ms | 1s | 4s | 16s | gt | max |
|---|---|---|---|---|---|---|---|---|---|---|---|
| pg151_def.cx7 | 98.042 | 1.942 | 0.010 | 0.005 | 0.121 | ||||||
| pg151_o2_nofp.cx7 | 97.278 | 2.679 | 0.032 | 0.010 | 0.103 | ||||||
| pg151_o3.cx7 | 97.786 | 2.174 | 0.034 | 0.006 | 0.089 | ||||||
| pg151_o3_native.cx7 | 97.251 | 2.709 | 0.035 | 0.005 | 0.123 | ||||||
| pg151_o3_native_lto.cx7 | 97.628 | 2.318 | 0.044 | 0.010 | 0.090 |
Performance metrics for the DBMS listed above. Some are normalized by throughput, others are not. Legend for results is here.
ips	qps	rps	rmbps	wps	wmbps	rpq	rkbpq	wpi	wkbpi	csps	cpups	cspq	cpupq	dbgb1	dbgb2	rss	maxop	p50	p99	tag
3989	42030	30	0.3	501.1	34.8	0.001	0.006	0.126	8.922	158261	52.4	3.765	100	11.9	22.7	0.0	0.056	10628	8458	20m.pg151_def.cx7
3989	41665	31	0.3	502.2	34.8	0.001	0.006	0.126	8.924	156520	52.5	3.757	101	11.9	22.7	0.0	0.043	10563	8373	20m.pg151_o2_nofp.cx7
3989	42938	31	0.3	504.0	34.7	0.001	0.006	0.126	8.911	161442	52.5	3.760	98	11.9	22.7	0.0	0.048	10909	8791	20m.pg151_o3.cx7
3989	43713	31	0.3	503.2	34.7	0.001	0.006	0.126	8.918	164549	52.4	3.764	96	11.9	22.7	0.0	0.061	11060	8950	20m.pg151_o3_native.cx7
3989	46328	34	0.3	503.4	34.4	0.001	0.006	0.126	8.843	174435	52.5	3.765	91	11.9	22.7	0.0	0.051	11683	9525	20m.pg151_o3_native_lto.cx7
l.i0
l.i0: load without secondary indexes
Performance metrics for all DBMS, not just the ones listed above. Some are normalized by throughput, others are not. Legend for results is here.
ips	qps	rps	rmbps	wps	wmbps	rpq	rkbpq	wpi	wkbpi	csps	cpups	cspq	cpupq	dbgb1	dbgb2	rss	maxop	p50	p99	tag
238095	0	0	0.0	279.8	102.8	0.000	0.000	0.001	0.442	24387	71.4	0.102	24	1.9	5.2	0.0	0.011	69625	63652	20m.pg151_def.cx7
235294	0	0	0.0	269.6	98.8	0.000	0.000	0.001	0.430	23282	70.1	0.099	24	1.9	5.2	0.0	0.011	69448	2997	20m.pg151_o2_nofp.cx7
246914	0	0	0.0	290.5	106.5	0.000	0.000	0.001	0.442	24699	69.5	0.100	23	1.9	5.2	0.0	0.010	74120	25881	20m.pg151_o3.cx7
250000	0	0	0.0	289.1	106.4	0.000	0.000	0.001	0.436	24538	69.4	0.098	22	1.9	5.2	0.0	0.018	74245	51744	20m.pg151_o3_native.cx7
266667	0	0	0.0	293.2	105.7	0.000	0.000	0.001	0.406	26154	68.8	0.098	21	1.9	5.2	0.0	0.011	79838	22176	20m.pg151_o3_native_lto.cx7
l.x
l.x: create secondary indexes
Performance metrics for all DBMS, not just the ones listed above. Some are normalized by throughput, others are not. Legend for results is here.
ips	qps	rps	rmbps	wps	wmbps	rpq	rkbpq	wpi	wkbpi	csps	cpups	cspq	cpupq	dbgb1	dbgb2	rss	maxop	p50	p99	tag
837500	0	0	0.0	344.9	159.4	0.000	0.000	0.000	0.195	1566	39.2	0.002	4	3.7	8.6	0.0	0.004	NA	NA	20m.pg151_def.cx7
804000	0	0	0.0	464.0	213.8	0.000	0.000	0.001	0.272	2227	38.7	0.003	4	3.7	8.6	0.0	0.004	NA	NA	20m.pg151_o2_nofp.cx7
837500	0	0	0.0	342.6	158.5	0.000	0.000	0.000	0.194	1628	40.8	0.002	4	3.7	8.6	0.0	0.004	NA	NA	20m.pg151_o3.cx7
837500	0	0	0.0	356.0	162.9	0.000	0.000	0.000	0.199	1575	39.2	0.002	4	3.7	8.6	0.0	0.004	NA	NA	20m.pg151_o3_native.cx7
873913	0	0	0.0	399.4	185.2	0.000	0.000	0.000	0.217	1265	39.4	0.001	4	3.7	8.6	0.0	0.004	NA	NA	20m.pg151_o3_native_lto.cx7
l.i1
l.i1: continue load after secondary indexes created
Performance metrics for all DBMS, not just the ones listed above. Some are normalized by throughput, others are not. Legend for results is here.
ips	qps	rps	rmbps	wps	wmbps	rpq	rkbpq	wpi	wkbpi	csps	cpups	cspq	cpupq	dbgb1	dbgb2	rss	maxop	p50	p99	tag
109890	0	0	0.0	329.2	113.3	0.000	0.000	0.003	1.056	22646	65.4	0.206	48	7.6	20.7	0.0	0.062	28729	18538	20m.pg151_def.cx7
109890	0	0	0.0	333.7	114.1	0.000	0.000	0.003	1.063	22444	65.5	0.204	48	7.6	20.7	1.2	0.010	28719	19978	20m.pg151_o2_nofp.cx7
113636	0	0	0.0	342.4	117.4	0.000	0.000	0.003	1.058	22988	65.8	0.202	46	7.6	20.7	0.0	0.011	29529	19628	20m.pg151_o3.cx7
114286	0	0	0.0	343.5	117.9	0.000	0.000	0.003	1.056	22989	65.6	0.201	46	7.6	20.7	0.0	0.013	29718	20085	20m.pg151_o3_native.cx7
119048	0	0	0.0	358.8	124.1	0.000	0.000	0.003	1.067	24075	66.2	0.202	44	7.6	20.7	0.0	0.051	31266	20827	20m.pg151_o3_native_lto.cx7
q100.1
q100.1: range queries with 100 insert/s per client
Performance metrics for all DBMS, not just the ones listed above. Some are normalized by throughput, others are not. Legend for results is here.
ips	qps	rps	rmbps	wps	wmbps	rpq	rkbpq	wpi	wkbpi	csps	cpups	cspq	cpupq	dbgb1	dbgb2	rss	maxop	p50	p99	tag
399	43225	0	0.0	354.7	15.5	0.000	0.000	0.890	39.764	164823	50.5	3.813	93	7.8	22.5	0.0	0.010	11028	8982	20m.pg151_def.cx7
399	42768	0	0.0	355.4	15.5	0.000	0.000	0.891	39.894	163013	50.5	3.812	94	7.8	22.6	0.0	0.010	10904	8950	20m.pg151_o2_nofp.cx7
399	44640	0	0.0	354.7	15.6	0.000	0.000	0.889	40.025	170220	50.7	3.813	91	7.8	22.5	0.0	0.010	11267	9605	20m.pg151_o3.cx7
399	45582	0	0.0	354.5	15.5	0.000	0.000	0.889	39.918	173776	50.7	3.812	89	7.8	22.5	0.0	0.010	11587	10053	20m.pg151_o3_native.cx7
399	48015	0	0.0	354.7	15.5	0.000	0.000	0.890	39.840	183159	50.6	3.815	84	7.8	22.5	0.0	0.010	11975	10596	20m.pg151_o3_native_lto.cx7
q500.1
q500.1: range queries with 500 insert/s per client
Performance metrics for all DBMS, not just the ones listed above. Some are normalized by throughput, others are not. Legend for results is here.
ips	qps	rps	rmbps	wps	wmbps	rpq	rkbpq	wpi	wkbpi	csps	cpups	cspq	cpupq	dbgb1	dbgb2	rss	maxop	p50	p99	tag
1994	42161	0	0.0	365.7	24.2	0.000	0.000	0.183	12.425	159921	51.3	3.793	97	9.4	22.0	0.0	0.019	10788	8966	20m.pg151_def.cx7
1994	41985	0	0.0	365.1	24.2	0.000	0.000	0.183	12.435	159254	51.3	3.793	98	9.4	22.0	0.0	0.018	10616	8551	20m.pg151_o2_nofp.cx7
1993	43542	0	0.0	366.1	24.0	0.000	0.000	0.184	12.331	165352	51.3	3.797	94	9.4	22.0	0.0	0.018	11044	9126	20m.pg151_o3.cx7
1993	44598	0	0.0	366.1	24.0	0.000	0.000	0.184	12.313	169340	51.4	3.797	92	9.4	22.0	0.0	0.017	11268	9174	20m.pg151_o3_native.cx7
1994	47362	0	0.0	364.6	23.9	0.000	0.000	0.183	12.253	179771	51.4	3.796	87	9.4	22.0	0.0	0.017	11923	10261	20m.pg151_o3_native_lto.cx7
q1000.1
q1000.1: range queries with 1000 insert/s per client
Performance metrics for all DBMS, not just the ones listed above. Some are normalized by throughput, others are not. Legend for results is here.
ips	qps	rps	rmbps	wps	wmbps	rpq	rkbpq	wpi	wkbpi	csps	cpups	cspq	cpupq	dbgb1	dbgb2	rss	maxop	p50	p99	tag
3989	42030	30	0.3	501.1	34.8	0.001	0.006	0.126	8.922	158261	52.4	3.765	100	11.9	22.7	0.0	0.056	10628	8458	20m.pg151_def.cx7
3989	41665	31	0.3	502.2	34.8	0.001	0.006	0.126	8.924	156520	52.5	3.757	101	11.9	22.7	0.0	0.043	10563	8373	20m.pg151_o2_nofp.cx7
3989	42938	31	0.3	504.0	34.7	0.001	0.006	0.126	8.911	161442	52.5	3.760	98	11.9	22.7	0.0	0.048	10909	8791	20m.pg151_o3.cx7
3989	43713	31	0.3	503.2	34.7	0.001	0.006	0.126	8.918	164549	52.4	3.764	96	11.9	22.7	0.0	0.061	11060	8950	20m.pg151_o3_native.cx7
3989	46328	34	0.3	503.4	34.4	0.001	0.006	0.126	8.843	174435	52.5	3.765	91	11.9	22.7	0.0	0.051	11683	9525	20m.pg151_o3_native_lto.cx7
l.i0
- l.i0: load without secondary indexes
- Legend for results is here.
- Each entry lists the percentage of responses that fit in that bucket (slower than max time for previous bucket, faster than min time for next bucket).
Insert response time histogram
256us	1ms	4ms	16ms	64ms	256ms	1s	4s	16s	gt	max	tag
0.000	0.000	99.977	0.023	0.000	0.000	0.000	0.000	0.000	0.000	0.011	pg151_def.cx7
0.000	0.000	99.971	0.030	0.000	0.000	0.000	0.000	0.000	0.000	0.011	pg151_o2_nofp.cx7
0.000	0.000	99.970	0.030	0.000	0.000	0.000	0.000	0.000	0.000	0.010	pg151_o3.cx7
0.000	0.000	99.972	0.028	0.001	0.000	0.000	0.000	0.000	0.000	0.018	pg151_o3_native.cx7
0.000	0.000	99.968	0.032	0.000	0.000	0.000	0.000	0.000	0.000	0.011	pg151_o3_native_lto.cx7
l.x
- l.x: create secondary indexes
- Legend for results is here.
- Each entry lists the percentage of responses that fit in that bucket (slower than max time for previous bucket, faster than min time for next bucket).
TODO - determine whether there is data for create index response time
l.i1
- l.i1: continue load after secondary indexes created
- Legend for results is here.
- Each entry lists the percentage of responses that fit in that bucket (slower than max time for previous bucket, faster than min time for next bucket).
Insert response time histogram
256us	1ms	4ms	16ms	64ms	256ms	1s	4s	16s	gt	max	tag
0.000	0.000	99.983	0.017	0.001	0.000	0.000	0.000	0.000	0.000	0.062	pg151_def.cx7
0.000	0.000	99.981	0.019	0.000	0.000	0.000	0.000	0.000	0.000	0.010	pg151_o2_nofp.cx7
0.000	0.000	99.986	0.014	0.000	0.000	0.000	0.000	0.000	0.000	0.011	pg151_o3.cx7
0.000	0.000	99.990	0.010	0.000	0.000	0.000	0.000	0.000	0.000	0.013	pg151_o3_native.cx7
0.000	0.000	99.987	0.012	0.001	0.000	0.000	0.000	0.000	0.000	0.051	pg151_o3_native_lto.cx7
q100.1
- q100.1: range queries with 100 insert/s per client
- Legend for results is here.
- Each entry lists the percentage of responses that fit in that bucket (slower than max time for previous bucket, faster than min time for next bucket).
Query response time histogram
256us	1ms	4ms	16ms	64ms	256ms	1s	4s	16s	gt	max	tag
99.983	0.012	0.005	nonzero	0.000	0.000	0.000	0.000	0.000	0.000	0.010	pg151_def.cx7
99.982	0.012	0.006	nonzero	0.000	0.000	0.000	0.000	0.000	0.000	0.010	pg151_o2_nofp.cx7
99.983	0.011	0.006	nonzero	0.000	0.000	0.000	0.000	0.000	0.000	0.010	pg151_o3.cx7
99.985	0.010	0.005	nonzero	0.000	0.000	0.000	0.000	0.000	0.000	0.010	pg151_o3_native.cx7
99.986	0.009	0.005	nonzero	0.000	0.000	0.000	0.000	0.000	0.000	0.010	pg151_o3_native_lto.cx7
Insert response time histogram
256us	1ms	4ms	16ms	64ms	256ms	1s	4s	16s	gt	max	tag
0.000	0.000	99.556	0.444	0.000	0.000	0.000	0.000	0.000	0.000	0.012	pg151_def.cx7
0.000	0.000	99.639	0.354	0.007	0.000	0.000	0.000	0.000	0.000	0.017	pg151_o2_nofp.cx7
0.000	0.000	99.590	0.410	0.000	0.000	0.000	0.000	0.000	0.000	0.015	pg151_o3.cx7
0.000	0.000	99.771	0.229	0.000	0.000	0.000	0.000	0.000	0.000	0.012	pg151_o3_native.cx7
0.000	0.000	99.792	0.208	0.000	0.000	0.000	0.000	0.000	0.000	0.011	pg151_o3_native_lto.cx7
q500.1
- q500.1: range queries with 500 insert/s per client
- Legend for results is here.
- Each entry lists the percentage of responses that fit in that bucket (slower than max time for previous bucket, faster than min time for next bucket).
Query response time histogram
256us	1ms	4ms	16ms	64ms	256ms	1s	4s	16s	gt	max	tag
99.948	0.033	0.018	0.001	nonzero	0.000	0.000	0.000	0.000	0.000	0.019	pg151_def.cx7
99.948	0.032	0.018	0.001	nonzero	0.000	0.000	0.000	0.000	0.000	0.018	pg151_o2_nofp.cx7
99.949	0.032	0.018	0.001	nonzero	0.000	0.000	0.000	0.000	0.000	0.018	pg151_o3.cx7
99.952	0.030	0.018	nonzero	nonzero	0.000	0.000	0.000	0.000	0.000	0.017	pg151_o3_native.cx7
99.959	0.024	0.016	0.001	nonzero	0.000	0.000	0.000	0.000	0.000	0.017	pg151_o3_native_lto.cx7
Insert response time histogram
256us	1ms	4ms	16ms	64ms	256ms	1s	4s	16s	gt	max	tag
0.000	0.000	98.399	1.586	0.015	0.000	0.000	0.000	0.000	0.000	0.019	pg151_def.cx7
0.000	0.000	97.562	2.379	0.058	0.000	0.000	0.000	0.000	0.000	0.028	pg151_o2_nofp.cx7
0.000	0.000	98.686	1.294	0.019	0.000	0.000	0.000	0.000	0.000	0.032	pg151_o3.cx7
0.000	0.000	98.949	1.042	0.010	0.000	0.000	0.000	0.000	0.000	0.021	pg151_o3_native.cx7
0.000	0.000	98.467	1.514	0.019	0.000	0.000	0.000	0.000	0.000	0.024	pg151_o3_native_lto.cx7
q1000.1
- q1000.1: range queries with 1000 insert/s per client
- Legend for results is here.
- Each entry lists the percentage of responses that fit in that bucket (slower than max time for previous bucket, faster than min time for next bucket).
Query response time histogram
256us	1ms	4ms	16ms	64ms	256ms	1s	4s	16s	gt	max	tag
99.892	0.074	0.033	0.001	nonzero	0.000	0.000	0.000	0.000	0.000	0.056	pg151_def.cx7
99.900	0.071	0.028	0.001	nonzero	0.000	0.000	0.000	0.000	0.000	0.043	pg151_o2_nofp.cx7
99.906	0.066	0.027	0.001	nonzero	0.000	0.000	0.000	0.000	0.000	0.048	pg151_o3.cx7
99.905	0.065	0.030	0.001	nonzero	0.000	0.000	0.000	0.000	0.000	0.061	pg151_o3_native.cx7
99.916	0.057	0.027	0.001	nonzero	0.000	0.000	0.000	0.000	0.000	0.051	pg151_o3_native_lto.cx7
Insert response time histogram
256us	1ms	4ms	16ms	64ms	256ms	1s	4s	16s	gt	max	tag
0.000	0.000	98.042	1.942	0.010	0.005	0.000	0.000	0.000	0.000	0.121	pg151_def.cx7
0.000	0.000	97.278	2.679	0.032	0.010	0.000	0.000	0.000	0.000	0.103	pg151_o2_nofp.cx7
0.000	0.000	97.786	2.174	0.034	0.006	0.000	0.000	0.000	0.000	0.089	pg151_o3.cx7
0.000	0.000	97.251	2.709	0.035	0.005	0.000	0.000	0.000	0.000	0.123	pg151_o3_native.cx7
0.000	0.000	97.628	2.318	0.044	0.010	0.000	0.000	0.000	0.000	0.090	pg151_o3_native_lto.cx7