Introduction
This is a report for the insert benchmark with 20M docs and 1 client(s). It is generated by scripts (bash, awk, sed) and Tufte might not be impressed. An overview of the insert benchmark is here and a short update is here. Below, by DBMS, I mean DBMS+version.config. An example is my8020.c10b40 where my means MySQL, 8020 is version 8.0.20 and c10b40 is the name for the configuration file.
The test server has 8 AMD cores, 16G RAM and an NVMe SSD. It is described here as the Beelink. The benchmark was run with 1 client and there were 1 or 2 connections per client (1 for queries, 1 for inserts). It uses 1 table. It loads 20M rows without secondary indexes, creates secondary indexes, loads another 20M rows then does 3 read+write tests for one hour each that do queries as fast as possible with 100, 500 and then 1000 writes/second/client concurrent with the queries. The database is cached by the storage engine and the only IO is for writes. Clients and the DBMS share one server. The per-database configs are in the per-database subdirectories here.
The tested DBMS are:
- pg151_def.cx7 - Postgres 15.1, the cx7 config and the build used: -O2
- pg151_o2_nofp.cx7 - Postgres 15.1, the cx7 config and the build used: -O2 -no-omit-frame-pointer
- pg151_o3.cx7 - Postgres 15.1, the cx7 config and the build used: -O3
- pg151_o3_native.cx7 - Postgres 15.1, the cx7 config and the build used: -O3 -march=native -mtune=native
- pg151_o3_native_lto.cx7 - Postgres 15.1, the cx7 config and the build used: -O3 -march=native -mtune=native and -flto
Contents
- Summary
- l.i0: load without secondary indexes
- l.x: create secondary indexes
- l.i1: continue load after secondary indexes created
- q100.1: range queries with 100 insert/s per client
- q500.1: range queries with 500 insert/s per client
- q1000.1: range queries with 1000 insert/s per client
Summary
The numbers are inserts/s for l.i0 and l.i1, indexed docs (or rows) /s for l.x and queries/s for q*.2. The values are the average rate over the entire test for inserts (IPS) and queries (QPS). The range of values for IPS and QPS is split into 3 parts: bottom 25%, middle 50%, top 25%. Values in the bottom 25% have a red background, values in the top 25% have a green background and values in the middle have no color. A gray background is used for values that can be ignored because the DBMS did not sustain the target insert rate. Red backgrounds are not used when the minimum value is within 80% of the max value.
| dbms | l.i0 | l.x | l.i1 | q100.1 | q500.1 | q1000.1 |
|---|---|---|---|---|---|---|
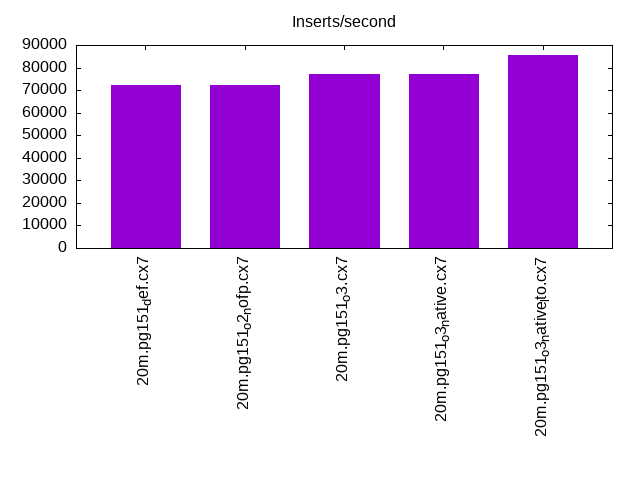
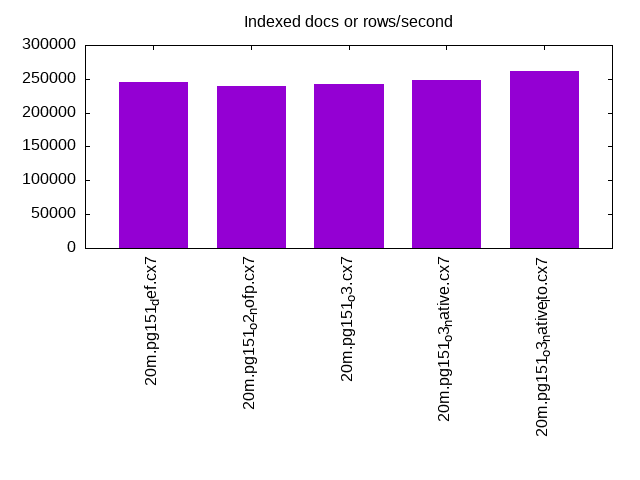
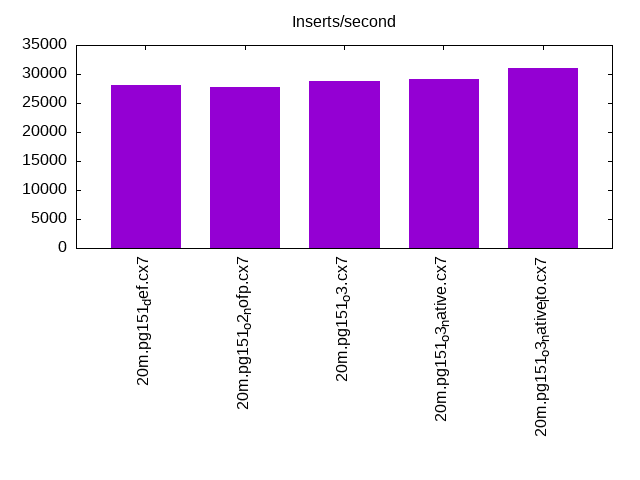
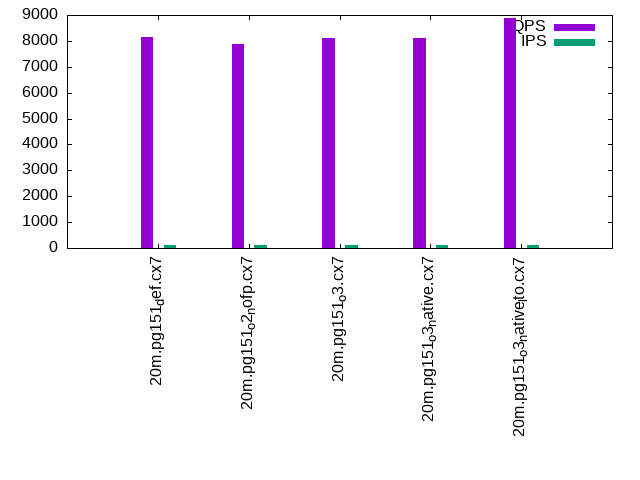
| 20m.pg151_def.cx7 | 72202 | 245122 | 28090 | 8140 | 8029 | 7972 |
| 20m.pg151_o2_nofp.cx7 | 72202 | 239286 | 27778 | 7885 | 7683 | 7845 |
| 20m.pg151_o3.cx7 | 77220 | 242169 | 28860 | 8126 | 8030 | 8200 |
| 20m.pg151_o3_native.cx7 | 77220 | 248148 | 29070 | 8110 | 8328 | 8217 |
| 20m.pg151_o3_native_lto.cx7 | 85470 | 261039 | 31056 | 8894 | 8880 | 8912 |
This table has relative throughput, throughput for the DBMS relative to the DBMS in the first line, using the absolute throughput from the previous table.
| dbms | l.i0 | l.x | l.i1 | q100.1 | q500.1 | q1000.1 |
|---|---|---|---|---|---|---|
| 20m.pg151_def.cx7 | 1.00 | 1.00 | 1.00 | 1.00 | 1.00 | 1.00 |
| 20m.pg151_o2_nofp.cx7 | 1.00 | 0.98 | 0.99 | 0.97 | 0.96 | 0.98 |
| 20m.pg151_o3.cx7 | 1.07 | 0.99 | 1.03 | 1.00 | 1.00 | 1.03 |
| 20m.pg151_o3_native.cx7 | 1.07 | 1.01 | 1.03 | 1.00 | 1.04 | 1.03 |
| 20m.pg151_o3_native_lto.cx7 | 1.18 | 1.06 | 1.11 | 1.09 | 1.11 | 1.12 |
This lists the average rate of inserts/s for the tests that do inserts concurrent with queries. For such tests the query rate is listed in the table above. The read+write tests are setup so that the insert rate should match the target rate every second. Cells that are not at least 95% of the target have a red background to indicate a failure to satisfy the target.
| dbms | q100.1 | q500.1 | q1000.1 |
|---|---|---|---|
| pg151_def.cx7 | 100 | 498 | 998 |
| pg151_o2_nofp.cx7 | 100 | 499 | 998 |
| pg151_o3.cx7 | 100 | 499 | 998 |
| pg151_o3_native.cx7 | 100 | 499 | 998 |
| pg151_o3_native_lto.cx7 | 100 | 499 | 997 |
| target | 100 | 500 | 1000 |
l.i0
l.i0: load without secondary indexes. Graphs for performance per 1-second interval are here.
Average throughput:
Insert response time histogram: each cell has the percentage of responses that take <= the time in the header and max is the max response time in seconds. For the max column values in the top 25% of the range have a red background and in the bottom 25% of the range have a green background. The red background is not used when the min value is within 80% of the max value.
| dbms | 256us | 1ms | 4ms | 16ms | 64ms | 256ms | 1s | 4s | 16s | gt | max |
|---|---|---|---|---|---|---|---|---|---|---|---|
| pg151_def.cx7 | 99.999 | 0.001 | 0.004 | ||||||||
| pg151_o2_nofp.cx7 | 100.000 | 0.004 | |||||||||
| pg151_o3.cx7 | 99.999 | 0.001 | 0.005 | ||||||||
| pg151_o3_native.cx7 | 99.999 | 0.001 | 0.006 | ||||||||
| pg151_o3_native_lto.cx7 | 0.060 | 99.940 | 0.001 | 0.006 |
Performance metrics for the DBMS listed above. Some are normalized by throughput, others are not. Legend for results is here.
ips	qps	rps	rmbps	wps	wmbps	rpq	rkbpq	wpi	wkbpi	csps	cpups	cspq	cpupq	dbgb1	dbgb2	rss	maxop	p50	p99	tag
72202	0	0	0.0	83.8	30.5	0.000	0.000	0.001	0.432	8938	22.4	0.124	25	1.9	5.2	0.0	0.004	72518	68716	20m.pg151_def.cx7
72202	0	0	0.0	83.5	30.5	0.000	0.000	0.001	0.433	8948	22.3	0.124	25	1.9	5.2	0.0	0.004	72635	50638	20m.pg151_o2_nofp.cx7
77220	0	0	0.0	89.9	32.7	0.000	0.000	0.001	0.434	9470	22.3	0.123	23	1.9	5.2	0.0	0.005	77514	75014	20m.pg151_o3.cx7
77220	0	0	0.0	90.4	32.9	0.000	0.000	0.001	0.436	9496	22.3	0.123	23	1.9	5.2	0.0	0.006	77819	68528	20m.pg151_o3_native.cx7
85470	0	0	0.0	99.9	36.5	0.000	0.000	0.001	0.437	10360	22.7	0.121	21	1.9	5.2	0.0	0.006	86007	70817	20m.pg151_o3_native_lto.cx7
l.x
l.x: create secondary indexes.
Average throughput:
Performance metrics for the DBMS listed above. Some are normalized by throughput, others are not. Legend for results is here.
ips	qps	rps	rmbps	wps	wmbps	rpq	rkbpq	wpi	wkbpi	csps	cpups	cspq	cpupq	dbgb1	dbgb2	rss	maxop	p50	p99	tag
245122	0	0	0.0	137.2	56.6	0.000	0.000	0.001	0.237	773	12.5	0.003	4	3.7	8.6	0.0	0.004	NA	NA	20m.pg151_def.cx7
239286	0	0	0.0	129.2	52.8	0.000	0.000	0.001	0.226	717	12.4	0.003	4	3.7	8.6	0.0	0.004	NA	NA	20m.pg151_o2_nofp.cx7
242169	0	0	0.0	128.6	54.1	0.000	0.000	0.001	0.229	792	12.3	0.003	4	3.7	8.6	0.0	0.004	NA	NA	20m.pg151_o3.cx7
248148	0	0	0.0	145.3	62.1	0.000	0.000	0.001	0.256	782	12.4	0.003	4	3.7	8.6	0.0	0.004	NA	NA	20m.pg151_o3_native.cx7
261039	0	0	0.0	124.1	54.0	0.000	0.000	0.000	0.212	716	12.4	0.003	4	3.7	8.6	0.0	0.003	NA	NA	20m.pg151_o3_native_lto.cx7
l.i1
l.i1: continue load after secondary indexes created. Graphs for performance per 1-second interval are here.
Average throughput:
Insert response time histogram: each cell has the percentage of responses that take <= the time in the header and max is the max response time in seconds. For the max column values in the top 25% of the range have a red background and in the bottom 25% of the range have a green background. The red background is not used when the min value is within 80% of the max value.
| dbms | 256us | 1ms | 4ms | 16ms | 64ms | 256ms | 1s | 4s | 16s | gt | max |
|---|---|---|---|---|---|---|---|---|---|---|---|
| pg151_def.cx7 | 99.998 | 0.002 | 0.010 | ||||||||
| pg151_o2_nofp.cx7 | 99.995 | 0.005 | 0.009 | ||||||||
| pg151_o3.cx7 | 99.996 | 0.004 | 0.009 | ||||||||
| pg151_o3_native.cx7 | 99.995 | 0.005 | 0.008 | ||||||||
| pg151_o3_native_lto.cx7 | 99.995 | 0.005 | 0.009 |
Performance metrics for the DBMS listed above. Some are normalized by throughput, others are not. Legend for results is here.
ips	qps	rps	rmbps	wps	wmbps	rpq	rkbpq	wpi	wkbpi	csps	cpups	cspq	cpupq	dbgb1	dbgb2	rss	maxop	p50	p99	tag
28090	0	0	0.0	166.5	48.2	0.000	0.000	0.006	1.758	7158	17.8	0.255	51	8.2	18.6	0.0	0.010	28768	20526	20m.pg151_def.cx7
27778	0	0	0.0	166.0	47.5	0.000	0.000	0.006	1.750	7084	17.7	0.255	51	8.2	18.5	0.0	0.009	28418	20278	20m.pg151_o2_nofp.cx7
28860	0	0	0.0	168.5	48.8	0.000	0.000	0.006	1.731	7343	18.0	0.254	50	8.2	18.8	0.0	0.009	29430	20974	20m.pg151_o3.cx7
29070	0	0	0.0	170.1	49.5	0.000	0.000	0.006	1.745	7402	17.9	0.255	49	8.2	19.0	0.0	0.008	29790	20977	20m.pg151_o3_native.cx7
31056	0	0	0.0	176.5	52.7	0.000	0.000	0.006	1.738	7841	18.2	0.252	47	8.2	19.8	0.2	0.009	31815	21875	20m.pg151_o3_native_lto.cx7
q100.1
q100.1: range queries with 100 insert/s per client. Graphs for performance per 1-second interval are here.
Average throughput:
Query response time histogram: each cell has the percentage of responses that take <= the time in the header and max is the max response time in seconds. For max values in the top 25% of the range have a red background and in the bottom 25% of the range have a green background. The red background is not used when the min value is within 80% of the max value.
| dbms | 256us | 1ms | 4ms | 16ms | 64ms | 256ms | 1s | 4s | 16s | gt | max |
|---|---|---|---|---|---|---|---|---|---|---|---|
| pg151_def.cx7 | 99.956 | 0.044 | nonzero | 0.003 | |||||||
| pg151_o2_nofp.cx7 | 99.931 | 0.069 | nonzero | 0.003 | |||||||
| pg151_o3.cx7 | 99.926 | 0.074 | nonzero | 0.003 | |||||||
| pg151_o3_native.cx7 | 99.940 | 0.060 | nonzero | nonzero | 0.004 | ||||||
| pg151_o3_native_lto.cx7 | 99.968 | 0.032 | nonzero | nonzero | 0.004 |
Insert response time histogram: each cell has the percentage of responses that take <= the time in the header and max is the max response time in seconds. For max values in the top 25% of the range have a red background and in the bottom 25% of the range have a green background. The red background is not used when the min value is within 80% of the max value.
| dbms | 256us | 1ms | 4ms | 16ms | 64ms | 256ms | 1s | 4s | 16s | gt | max |
|---|---|---|---|---|---|---|---|---|---|---|---|
| pg151_def.cx7 | 99.806 | 0.194 | 0.007 | ||||||||
| pg151_o2_nofp.cx7 | 99.778 | 0.222 | 0.007 | ||||||||
| pg151_o3.cx7 | 99.833 | 0.167 | 0.008 | ||||||||
| pg151_o3_native.cx7 | 99.889 | 0.111 | 0.008 | ||||||||
| pg151_o3_native_lto.cx7 | 99.889 | 0.111 | 0.008 |
Performance metrics for the DBMS listed above. Some are normalized by throughput, others are not. Legend for results is here.
ips	qps	rps	rmbps	wps	wmbps	rpq	rkbpq	wpi	wkbpi	csps	cpups	cspq	cpupq	dbgb1	dbgb2	rss	maxop	p50	p99	tag
100	8140	0	0.0	196.9	5.6	0.000	0.000	1.973	57.646	31244	12.8	3.838	126	8.2	17.1	0.0	0.003	7621	7448	20m.pg151_def.cx7
100	7885	0	0.0	194.7	5.6	0.000	0.000	1.953	57.734	30283	12.7	3.841	129	8.2	17.0	0.0	0.003	7514	7367	20m.pg151_o2_nofp.cx7
100	8126	0	0.0	194.0	5.5	0.000	0.000	1.946	56.125	31205	12.7	3.840	125	8.2	17.3	0.0	0.003	7766	7574	20m.pg151_o3.cx7
100	8110	0	0.0	193.9	5.5	0.000	0.000	1.946	57.002	31181	12.7	3.845	125	8.2	17.4	0.0	0.004	7846	7576	20m.pg151_o3_native.cx7
100	8894	0	0.0	181.3	5.4	0.000	0.000	1.818	55.269	34127	12.9	3.837	116	8.2	18.2	0.0	0.004	8568	8387	20m.pg151_o3_native_lto.cx7
q500.1
q500.1: range queries with 500 insert/s per client. Graphs for performance per 1-second interval are here.
Average throughput:

Query response time histogram: each cell has the percentage of responses that take <= the time in the header and max is the max response time in seconds. For max values in the top 25% of the range have a red background and in the bottom 25% of the range have a green background. The red background is not used when the min value is within 80% of the max value.
| dbms | 256us | 1ms | 4ms | 16ms | 64ms | 256ms | 1s | 4s | 16s | gt | max |
|---|---|---|---|---|---|---|---|---|---|---|---|
| pg151_def.cx7 | 99.945 | 0.055 | nonzero | 0.003 | |||||||
| pg151_o2_nofp.cx7 | 99.930 | 0.069 | nonzero | nonzero | 0.004 | ||||||
| pg151_o3.cx7 | 99.952 | 0.048 | nonzero | 0.003 | |||||||
| pg151_o3_native.cx7 | 99.958 | 0.042 | nonzero | 0.003 | |||||||
| pg151_o3_native_lto.cx7 | 99.974 | 0.026 | nonzero | 0.003 |
Insert response time histogram: each cell has the percentage of responses that take <= the time in the header and max is the max response time in seconds. For max values in the top 25% of the range have a red background and in the bottom 25% of the range have a green background. The red background is not used when the min value is within 80% of the max value.
| dbms | 256us | 1ms | 4ms | 16ms | 64ms | 256ms | 1s | 4s | 16s | gt | max |
|---|---|---|---|---|---|---|---|---|---|---|---|
| pg151_def.cx7 | 99.833 | 0.167 | 0.007 | ||||||||
| pg151_o2_nofp.cx7 | 99.922 | 0.078 | 0.007 | ||||||||
| pg151_o3.cx7 | 99.894 | 0.106 | 0.009 | ||||||||
| pg151_o3_native.cx7 | 99.878 | 0.122 | 0.007 | ||||||||
| pg151_o3_native_lto.cx7 | 99.922 | 0.078 | 0.008 |
Performance metrics for the DBMS listed above. Some are normalized by throughput, others are not. Legend for results is here.
ips	qps	rps	rmbps	wps	wmbps	rpq	rkbpq	wpi	wkbpi	csps	cpups	cspq	cpupq	dbgb1	dbgb2	rss	maxop	p50	p99	tag
498	8029	0	0.0	331.1	11.5	0.000	0.000	0.664	23.659	30975	13.1	3.858	131	8.4	14.3	0.0	0.003	7672	7558	20m.pg151_def.cx7
499	7683	0	0.0	331.7	11.5	0.000	0.000	0.665	23.610	29637	13.0	3.858	135	8.4	14.3	0.0	0.004	7388	7255	20m.pg151_o2_nofp.cx7
499	8030	0	0.0	329.2	11.5	0.000	0.000	0.660	23.678	30963	12.9	3.856	129	8.4	14.4	0.0	0.003	7640	7431	20m.pg151_o3.cx7
499	8328	0	0.0	329.0	11.5	0.000	0.000	0.660	23.678	32111	12.8	3.856	123	8.4	14.4	0.0	0.003	7959	7735	20m.pg151_o3_native.cx7
499	8880	0	0.0	322.1	11.4	0.000	0.000	0.646	23.491	34209	13.1	3.852	118	8.4	14.6	0.0	0.003	8544	8388	20m.pg151_o3_native_lto.cx7
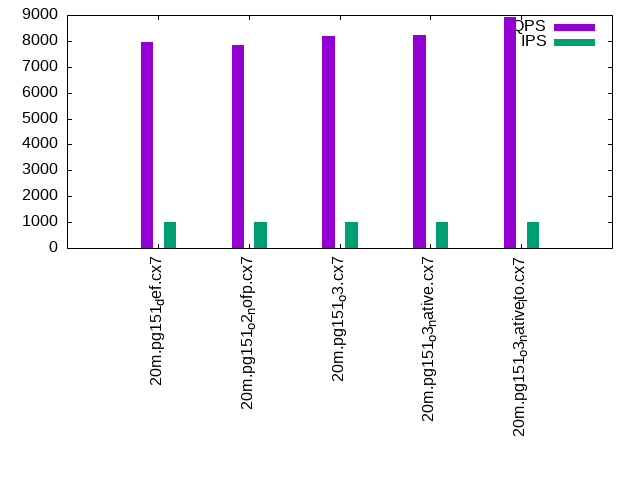
q1000.1
q1000.1: range queries with 1000 insert/s per client. Graphs for performance per 1-second interval are here.
Average throughput:
Query response time histogram: each cell has the percentage of responses that take <= the time in the header and max is the max response time in seconds. For max values in the top 25% of the range have a red background and in the bottom 25% of the range have a green background. The red background is not used when the min value is within 80% of the max value.
| dbms | 256us | 1ms | 4ms | 16ms | 64ms | 256ms | 1s | 4s | 16s | gt | max |
|---|---|---|---|---|---|---|---|---|---|---|---|
| pg151_def.cx7 | 99.954 | 0.046 | nonzero | 0.003 | |||||||
| pg151_o2_nofp.cx7 | 99.938 | 0.062 | nonzero | 0.003 | |||||||
| pg151_o3.cx7 | 99.950 | 0.050 | nonzero | 0.003 | |||||||
| pg151_o3_native.cx7 | 99.953 | 0.047 | nonzero | nonzero | 0.005 | ||||||
| pg151_o3_native_lto.cx7 | 99.978 | 0.022 | nonzero | 0.003 |
Insert response time histogram: each cell has the percentage of responses that take <= the time in the header and max is the max response time in seconds. For max values in the top 25% of the range have a red background and in the bottom 25% of the range have a green background. The red background is not used when the min value is within 80% of the max value.
| dbms | 256us | 1ms | 4ms | 16ms | 64ms | 256ms | 1s | 4s | 16s | gt | max |
|---|---|---|---|---|---|---|---|---|---|---|---|
| pg151_def.cx7 | 99.939 | 0.061 | 0.008 | ||||||||
| pg151_o2_nofp.cx7 | 99.889 | 0.111 | 0.007 | ||||||||
| pg151_o3.cx7 | 99.933 | 0.067 | 0.009 | ||||||||
| pg151_o3_native.cx7 | 99.919 | 0.081 | 0.008 | ||||||||
| pg151_o3_native_lto.cx7 | 99.928 | 0.072 | 0.008 |
Performance metrics for the DBMS listed above. Some are normalized by throughput, others are not. Legend for results is here.
ips	qps	rps	rmbps	wps	wmbps	rpq	rkbpq	wpi	wkbpi	csps	cpups	cspq	cpupq	dbgb1	dbgb2	rss	maxop	p50	p99	tag
998	7972	0	0.0	325.8	16.3	0.000	0.000	0.327	16.682	30870	13.6	3.872	136	9.0	14.4	0.0	0.003	7693	7543	20m.pg151_def.cx7
998	7845	0	0.0	326.8	16.2	0.000	0.000	0.328	16.671	30393	13.9	3.874	142	9.0	14.4	0.0	0.003	7493	7321	20m.pg151_o2_nofp.cx7
998	8200	0	0.0	323.8	16.3	0.000	0.000	0.325	16.740	31730	13.8	3.869	135	9.0	14.4	0.0	0.003	7769	7607	20m.pg151_o3.cx7
998	8217	0	0.0	324.8	16.3	0.000	0.000	0.325	16.739	31790	13.8	3.869	134	9.0	14.5	0.0	0.005	7877	7719	20m.pg151_o3_native.cx7
997	8912	0	0.0	323.3	16.3	0.000	0.000	0.324	16.749	34463	13.6	3.867	122	9.0	14.6	0.0	0.003	8645	8472	20m.pg151_o3_native_lto.cx7
l.i0
l.i0: load without secondary indexes
Performance metrics for all DBMS, not just the ones listed above. Some are normalized by throughput, others are not. Legend for results is here.
ips	qps	rps	rmbps	wps	wmbps	rpq	rkbpq	wpi	wkbpi	csps	cpups	cspq	cpupq	dbgb1	dbgb2	rss	maxop	p50	p99	tag
72202	0	0	0.0	83.8	30.5	0.000	0.000	0.001	0.432	8938	22.4	0.124	25	1.9	5.2	0.0	0.004	72518	68716	20m.pg151_def.cx7
72202	0	0	0.0	83.5	30.5	0.000	0.000	0.001	0.433	8948	22.3	0.124	25	1.9	5.2	0.0	0.004	72635	50638	20m.pg151_o2_nofp.cx7
77220	0	0	0.0	89.9	32.7	0.000	0.000	0.001	0.434	9470	22.3	0.123	23	1.9	5.2	0.0	0.005	77514	75014	20m.pg151_o3.cx7
77220	0	0	0.0	90.4	32.9	0.000	0.000	0.001	0.436	9496	22.3	0.123	23	1.9	5.2	0.0	0.006	77819	68528	20m.pg151_o3_native.cx7
85470	0	0	0.0	99.9	36.5	0.000	0.000	0.001	0.437	10360	22.7	0.121	21	1.9	5.2	0.0	0.006	86007	70817	20m.pg151_o3_native_lto.cx7
l.x
l.x: create secondary indexes
Performance metrics for all DBMS, not just the ones listed above. Some are normalized by throughput, others are not. Legend for results is here.
ips	qps	rps	rmbps	wps	wmbps	rpq	rkbpq	wpi	wkbpi	csps	cpups	cspq	cpupq	dbgb1	dbgb2	rss	maxop	p50	p99	tag
245122	0	0	0.0	137.2	56.6	0.000	0.000	0.001	0.237	773	12.5	0.003	4	3.7	8.6	0.0	0.004	NA	NA	20m.pg151_def.cx7
239286	0	0	0.0	129.2	52.8	0.000	0.000	0.001	0.226	717	12.4	0.003	4	3.7	8.6	0.0	0.004	NA	NA	20m.pg151_o2_nofp.cx7
242169	0	0	0.0	128.6	54.1	0.000	0.000	0.001	0.229	792	12.3	0.003	4	3.7	8.6	0.0	0.004	NA	NA	20m.pg151_o3.cx7
248148	0	0	0.0	145.3	62.1	0.000	0.000	0.001	0.256	782	12.4	0.003	4	3.7	8.6	0.0	0.004	NA	NA	20m.pg151_o3_native.cx7
261039	0	0	0.0	124.1	54.0	0.000	0.000	0.000	0.212	716	12.4	0.003	4	3.7	8.6	0.0	0.003	NA	NA	20m.pg151_o3_native_lto.cx7
l.i1
l.i1: continue load after secondary indexes created
Performance metrics for all DBMS, not just the ones listed above. Some are normalized by throughput, others are not. Legend for results is here.
ips	qps	rps	rmbps	wps	wmbps	rpq	rkbpq	wpi	wkbpi	csps	cpups	cspq	cpupq	dbgb1	dbgb2	rss	maxop	p50	p99	tag
28090	0	0	0.0	166.5	48.2	0.000	0.000	0.006	1.758	7158	17.8	0.255	51	8.2	18.6	0.0	0.010	28768	20526	20m.pg151_def.cx7
27778	0	0	0.0	166.0	47.5	0.000	0.000	0.006	1.750	7084	17.7	0.255	51	8.2	18.5	0.0	0.009	28418	20278	20m.pg151_o2_nofp.cx7
28860	0	0	0.0	168.5	48.8	0.000	0.000	0.006	1.731	7343	18.0	0.254	50	8.2	18.8	0.0	0.009	29430	20974	20m.pg151_o3.cx7
29070	0	0	0.0	170.1	49.5	0.000	0.000	0.006	1.745	7402	17.9	0.255	49	8.2	19.0	0.0	0.008	29790	20977	20m.pg151_o3_native.cx7
31056	0	0	0.0	176.5	52.7	0.000	0.000	0.006	1.738	7841	18.2	0.252	47	8.2	19.8	0.2	0.009	31815	21875	20m.pg151_o3_native_lto.cx7
q100.1
q100.1: range queries with 100 insert/s per client
Performance metrics for all DBMS, not just the ones listed above. Some are normalized by throughput, others are not. Legend for results is here.
ips	qps	rps	rmbps	wps	wmbps	rpq	rkbpq	wpi	wkbpi	csps	cpups	cspq	cpupq	dbgb1	dbgb2	rss	maxop	p50	p99	tag
100	8140	0	0.0	196.9	5.6	0.000	0.000	1.973	57.646	31244	12.8	3.838	126	8.2	17.1	0.0	0.003	7621	7448	20m.pg151_def.cx7
100	7885	0	0.0	194.7	5.6	0.000	0.000	1.953	57.734	30283	12.7	3.841	129	8.2	17.0	0.0	0.003	7514	7367	20m.pg151_o2_nofp.cx7
100	8126	0	0.0	194.0	5.5	0.000	0.000	1.946	56.125	31205	12.7	3.840	125	8.2	17.3	0.0	0.003	7766	7574	20m.pg151_o3.cx7
100	8110	0	0.0	193.9	5.5	0.000	0.000	1.946	57.002	31181	12.7	3.845	125	8.2	17.4	0.0	0.004	7846	7576	20m.pg151_o3_native.cx7
100	8894	0	0.0	181.3	5.4	0.000	0.000	1.818	55.269	34127	12.9	3.837	116	8.2	18.2	0.0	0.004	8568	8387	20m.pg151_o3_native_lto.cx7
q500.1
q500.1: range queries with 500 insert/s per client
Performance metrics for all DBMS, not just the ones listed above. Some are normalized by throughput, others are not. Legend for results is here.
ips	qps	rps	rmbps	wps	wmbps	rpq	rkbpq	wpi	wkbpi	csps	cpups	cspq	cpupq	dbgb1	dbgb2	rss	maxop	p50	p99	tag
498	8029	0	0.0	331.1	11.5	0.000	0.000	0.664	23.659	30975	13.1	3.858	131	8.4	14.3	0.0	0.003	7672	7558	20m.pg151_def.cx7
499	7683	0	0.0	331.7	11.5	0.000	0.000	0.665	23.610	29637	13.0	3.858	135	8.4	14.3	0.0	0.004	7388	7255	20m.pg151_o2_nofp.cx7
499	8030	0	0.0	329.2	11.5	0.000	0.000	0.660	23.678	30963	12.9	3.856	129	8.4	14.4	0.0	0.003	7640	7431	20m.pg151_o3.cx7
499	8328	0	0.0	329.0	11.5	0.000	0.000	0.660	23.678	32111	12.8	3.856	123	8.4	14.4	0.0	0.003	7959	7735	20m.pg151_o3_native.cx7
499	8880	0	0.0	322.1	11.4	0.000	0.000	0.646	23.491	34209	13.1	3.852	118	8.4	14.6	0.0	0.003	8544	8388	20m.pg151_o3_native_lto.cx7
q1000.1
q1000.1: range queries with 1000 insert/s per client
Performance metrics for all DBMS, not just the ones listed above. Some are normalized by throughput, others are not. Legend for results is here.
ips	qps	rps	rmbps	wps	wmbps	rpq	rkbpq	wpi	wkbpi	csps	cpups	cspq	cpupq	dbgb1	dbgb2	rss	maxop	p50	p99	tag
998	7972	0	0.0	325.8	16.3	0.000	0.000	0.327	16.682	30870	13.6	3.872	136	9.0	14.4	0.0	0.003	7693	7543	20m.pg151_def.cx7
998	7845	0	0.0	326.8	16.2	0.000	0.000	0.328	16.671	30393	13.9	3.874	142	9.0	14.4	0.0	0.003	7493	7321	20m.pg151_o2_nofp.cx7
998	8200	0	0.0	323.8	16.3	0.000	0.000	0.325	16.740	31730	13.8	3.869	135	9.0	14.4	0.0	0.003	7769	7607	20m.pg151_o3.cx7
998	8217	0	0.0	324.8	16.3	0.000	0.000	0.325	16.739	31790	13.8	3.869	134	9.0	14.5	0.0	0.005	7877	7719	20m.pg151_o3_native.cx7
997	8912	0	0.0	323.3	16.3	0.000	0.000	0.324	16.749	34463	13.6	3.867	122	9.0	14.6	0.0	0.003	8645	8472	20m.pg151_o3_native_lto.cx7
l.i0
- l.i0: load without secondary indexes
- Legend for results is here.
- Each entry lists the percentage of responses that fit in that bucket (slower than max time for previous bucket, faster than min time for next bucket).
Insert response time histogram
256us	1ms	4ms	16ms	64ms	256ms	1s	4s	16s	gt	max	tag
0.000	0.000	99.999	0.001	0.000	0.000	0.000	0.000	0.000	0.000	0.004	pg151_def.cx7
0.000	0.000	100.000	0.000	0.000	0.000	0.000	0.000	0.000	0.000	0.004	pg151_o2_nofp.cx7
0.000	0.000	99.999	0.001	0.000	0.000	0.000	0.000	0.000	0.000	0.005	pg151_o3.cx7
0.000	0.000	99.999	0.001	0.000	0.000	0.000	0.000	0.000	0.000	0.006	pg151_o3_native.cx7
0.000	0.060	99.940	0.001	0.000	0.000	0.000	0.000	0.000	0.000	0.006	pg151_o3_native_lto.cx7
l.x
- l.x: create secondary indexes
- Legend for results is here.
- Each entry lists the percentage of responses that fit in that bucket (slower than max time for previous bucket, faster than min time for next bucket).
TODO - determine whether there is data for create index response time
l.i1
- l.i1: continue load after secondary indexes created
- Legend for results is here.
- Each entry lists the percentage of responses that fit in that bucket (slower than max time for previous bucket, faster than min time for next bucket).
Insert response time histogram
256us	1ms	4ms	16ms	64ms	256ms	1s	4s	16s	gt	max	tag
0.000	0.000	99.998	0.002	0.000	0.000	0.000	0.000	0.000	0.000	0.010	pg151_def.cx7
0.000	0.000	99.995	0.005	0.000	0.000	0.000	0.000	0.000	0.000	0.009	pg151_o2_nofp.cx7
0.000	0.000	99.996	0.004	0.000	0.000	0.000	0.000	0.000	0.000	0.009	pg151_o3.cx7
0.000	0.000	99.995	0.005	0.000	0.000	0.000	0.000	0.000	0.000	0.008	pg151_o3_native.cx7
0.000	0.000	99.995	0.005	0.000	0.000	0.000	0.000	0.000	0.000	0.009	pg151_o3_native_lto.cx7
q100.1
- q100.1: range queries with 100 insert/s per client
- Legend for results is here.
- Each entry lists the percentage of responses that fit in that bucket (slower than max time for previous bucket, faster than min time for next bucket).
Query response time histogram
256us	1ms	4ms	16ms	64ms	256ms	1s	4s	16s	gt	max	tag
99.956	0.044	nonzero	0.000	0.000	0.000	0.000	0.000	0.000	0.000	0.003	pg151_def.cx7
99.931	0.069	nonzero	0.000	0.000	0.000	0.000	0.000	0.000	0.000	0.003	pg151_o2_nofp.cx7
99.926	0.074	nonzero	0.000	0.000	0.000	0.000	0.000	0.000	0.000	0.003	pg151_o3.cx7
99.940	0.060	nonzero	nonzero	0.000	0.000	0.000	0.000	0.000	0.000	0.004	pg151_o3_native.cx7
99.968	0.032	nonzero	nonzero	0.000	0.000	0.000	0.000	0.000	0.000	0.004	pg151_o3_native_lto.cx7
Insert response time histogram
256us	1ms	4ms	16ms	64ms	256ms	1s	4s	16s	gt	max	tag
0.000	0.000	99.806	0.194	0.000	0.000	0.000	0.000	0.000	0.000	0.007	pg151_def.cx7
0.000	0.000	99.778	0.222	0.000	0.000	0.000	0.000	0.000	0.000	0.007	pg151_o2_nofp.cx7
0.000	0.000	99.833	0.167	0.000	0.000	0.000	0.000	0.000	0.000	0.008	pg151_o3.cx7
0.000	0.000	99.889	0.111	0.000	0.000	0.000	0.000	0.000	0.000	0.008	pg151_o3_native.cx7
0.000	0.000	99.889	0.111	0.000	0.000	0.000	0.000	0.000	0.000	0.008	pg151_o3_native_lto.cx7
q500.1
- q500.1: range queries with 500 insert/s per client
- Legend for results is here.
- Each entry lists the percentage of responses that fit in that bucket (slower than max time for previous bucket, faster than min time for next bucket).
Query response time histogram
256us	1ms	4ms	16ms	64ms	256ms	1s	4s	16s	gt	max	tag
99.945	0.055	nonzero	0.000	0.000	0.000	0.000	0.000	0.000	0.000	0.003	pg151_def.cx7
99.930	0.069	nonzero	nonzero	0.000	0.000	0.000	0.000	0.000	0.000	0.004	pg151_o2_nofp.cx7
99.952	0.048	nonzero	0.000	0.000	0.000	0.000	0.000	0.000	0.000	0.003	pg151_o3.cx7
99.958	0.042	nonzero	0.000	0.000	0.000	0.000	0.000	0.000	0.000	0.003	pg151_o3_native.cx7
99.974	0.026	nonzero	0.000	0.000	0.000	0.000	0.000	0.000	0.000	0.003	pg151_o3_native_lto.cx7
Insert response time histogram
256us	1ms	4ms	16ms	64ms	256ms	1s	4s	16s	gt	max	tag
0.000	0.000	99.833	0.167	0.000	0.000	0.000	0.000	0.000	0.000	0.007	pg151_def.cx7
0.000	0.000	99.922	0.078	0.000	0.000	0.000	0.000	0.000	0.000	0.007	pg151_o2_nofp.cx7
0.000	0.000	99.894	0.106	0.000	0.000	0.000	0.000	0.000	0.000	0.009	pg151_o3.cx7
0.000	0.000	99.878	0.122	0.000	0.000	0.000	0.000	0.000	0.000	0.007	pg151_o3_native.cx7
0.000	0.000	99.922	0.078	0.000	0.000	0.000	0.000	0.000	0.000	0.008	pg151_o3_native_lto.cx7
q1000.1
- q1000.1: range queries with 1000 insert/s per client
- Legend for results is here.
- Each entry lists the percentage of responses that fit in that bucket (slower than max time for previous bucket, faster than min time for next bucket).
Query response time histogram
256us	1ms	4ms	16ms	64ms	256ms	1s	4s	16s	gt	max	tag
99.954	0.046	nonzero	0.000	0.000	0.000	0.000	0.000	0.000	0.000	0.003	pg151_def.cx7
99.938	0.062	nonzero	0.000	0.000	0.000	0.000	0.000	0.000	0.000	0.003	pg151_o2_nofp.cx7
99.950	0.050	nonzero	0.000	0.000	0.000	0.000	0.000	0.000	0.000	0.003	pg151_o3.cx7
99.953	0.047	nonzero	nonzero	0.000	0.000	0.000	0.000	0.000	0.000	0.005	pg151_o3_native.cx7
99.978	0.022	nonzero	0.000	0.000	0.000	0.000	0.000	0.000	0.000	0.003	pg151_o3_native_lto.cx7
Insert response time histogram
256us	1ms	4ms	16ms	64ms	256ms	1s	4s	16s	gt	max	tag
0.000	0.000	99.939	0.061	0.000	0.000	0.000	0.000	0.000	0.000	0.008	pg151_def.cx7
0.000	0.000	99.889	0.111	0.000	0.000	0.000	0.000	0.000	0.000	0.007	pg151_o2_nofp.cx7
0.000	0.000	99.933	0.067	0.000	0.000	0.000	0.000	0.000	0.000	0.009	pg151_o3.cx7
0.000	0.000	99.919	0.081	0.000	0.000	0.000	0.000	0.000	0.000	0.008	pg151_o3_native.cx7
0.000	0.000	99.928	0.072	0.000	0.000	0.000	0.000	0.000	0.000	0.008	pg151_o3_native_lto.cx7