Introduction
This is a report for the insert benchmark with 20M docs and 1 client(s). It is generated by scripts (bash, awk, sed) and Tufte might not be impressed. An overview of the insert benchmark is here and a short update is here. Below, by DBMS, I mean DBMS+version.config. An example is my8020.c10b40 where my means MySQL, 8020 is version 8.0.20 and c10b40 is the name for the configuration file.
The test server has 8 AMD cores, 16G RAM and an NVMe SSD. It is described here as the Beelink. The benchmark was run with 1 client and there were 1 or 2 connections per client (1 for queries, 1 for inserts). It uses 1 table. It loads 20M rows without secondary indexes, creates secondary indexes, loads another 20M rows then does 3 read+write tests for one hour each that do queries as fast as possible with 100, 500 and then 1000 writes/second/client concurrent with the queries. The database is cached by the OS but not by the database. Clients and the DBMS share one server. The per-database configs are in the per-database subdirectories here.
The tested DBMS are:
- pg151_def.cx7_1g - Postgres 15.1, the cx7_1g config and the build used: -O2
- pg151_o2_nofp.cx7_1g - Postgres 15.1, the cx7_1g config and the build used: -O2 -no-omit-frame-pointer
- pg151_o3.cx7_1g - Postgres 15.1, the cx7_1g config and the build used: -O3
- pg151_o3_native.cx7_1g - Postgres 15.1, the cx7_1g config and the build used: -O3 -march=native -mtune=native
- pg151_o3_native_lto.cx7_1g - Postgres 15.1, the cx7_1g config and the build used: -O3 -march=native -mtune=native and -flto
Contents
- Summary
- l.i0: load without secondary indexes
- l.x: create secondary indexes
- l.i1: continue load after secondary indexes created
- q100.1: range queries with 100 insert/s per client
- q500.1: range queries with 500 insert/s per client
- q1000.1: range queries with 1000 insert/s per client
Summary
The numbers are inserts/s for l.i0 and l.i1, indexed docs (or rows) /s for l.x and queries/s for q*.2. The values are the average rate over the entire test for inserts (IPS) and queries (QPS). The range of values for IPS and QPS is split into 3 parts: bottom 25%, middle 50%, top 25%. Values in the bottom 25% have a red background, values in the top 25% have a green background and values in the middle have no color. A gray background is used for values that can be ignored because the DBMS did not sustain the target insert rate. Red backgrounds are not used when the minimum value is within 80% of the max value.
| dbms | l.i0 | l.x | l.i1 | q100.1 | q500.1 | q1000.1 |
|---|---|---|---|---|---|---|
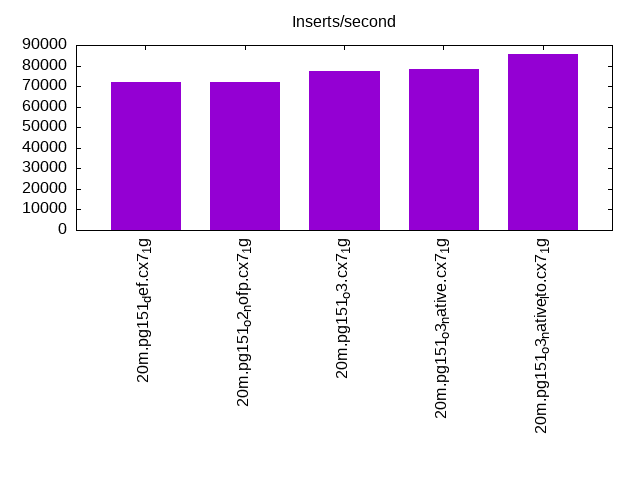
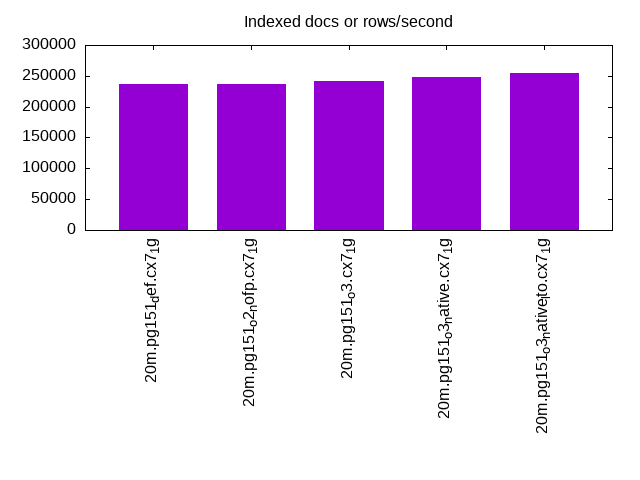
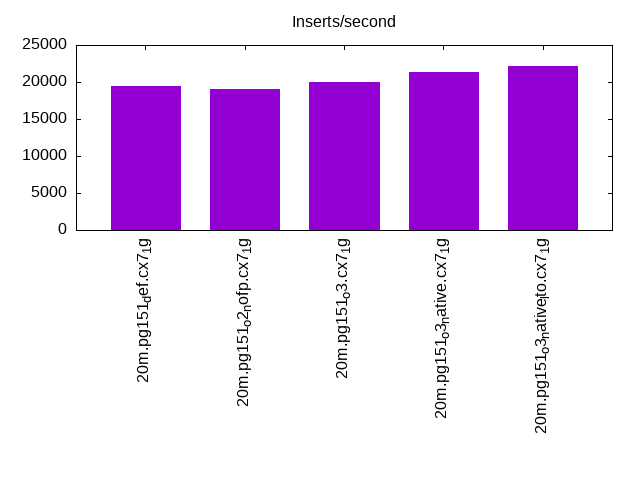
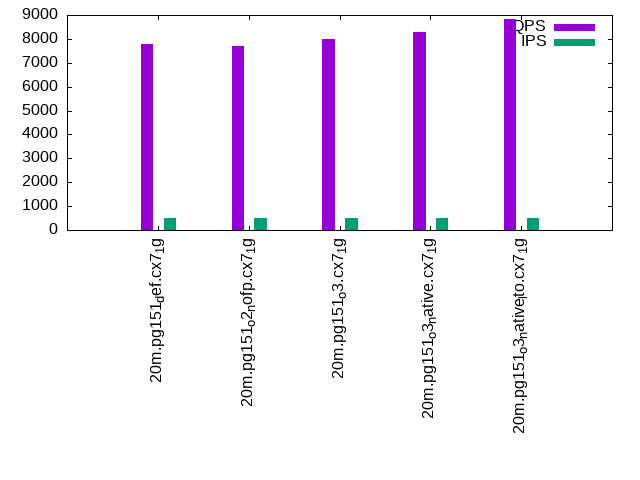
| 20m.pg151_def.cx7_1g | 72202 | 236470 | 19436 | 7936 | 7771 | 7884 |
| 20m.pg151_o2_nofp.cx7_1g | 72202 | 236470 | 19120 | 7703 | 7715 | 7537 |
| 20m.pg151_o3.cx7_1g | 77220 | 242169 | 20000 | 7889 | 7984 | 8166 |
| 20m.pg151_o3_native.cx7_1g | 78125 | 248148 | 21345 | 8158 | 8278 | 8281 |
| 20m.pg151_o3_native_lto.cx7_1g | 85470 | 254430 | 22124 | 8685 | 8835 | 8824 |
This table has relative throughput, throughput for the DBMS relative to the DBMS in the first line, using the absolute throughput from the previous table.
| dbms | l.i0 | l.x | l.i1 | q100.1 | q500.1 | q1000.1 |
|---|---|---|---|---|---|---|
| 20m.pg151_def.cx7_1g | 1.00 | 1.00 | 1.00 | 1.00 | 1.00 | 1.00 |
| 20m.pg151_o2_nofp.cx7_1g | 1.00 | 1.00 | 0.98 | 0.97 | 0.99 | 0.96 |
| 20m.pg151_o3.cx7_1g | 1.07 | 1.02 | 1.03 | 0.99 | 1.03 | 1.04 |
| 20m.pg151_o3_native.cx7_1g | 1.08 | 1.05 | 1.10 | 1.03 | 1.07 | 1.05 |
| 20m.pg151_o3_native_lto.cx7_1g | 1.18 | 1.08 | 1.14 | 1.09 | 1.14 | 1.12 |
This lists the average rate of inserts/s for the tests that do inserts concurrent with queries. For such tests the query rate is listed in the table above. The read+write tests are setup so that the insert rate should match the target rate every second. Cells that are not at least 95% of the target have a red background to indicate a failure to satisfy the target.
| dbms | q100.1 | q500.1 | q1000.1 |
|---|---|---|---|
| pg151_def.cx7_1g | 100 | 499 | 998 |
| pg151_o2_nofp.cx7_1g | 100 | 499 | 998 |
| pg151_o3.cx7_1g | 100 | 499 | 998 |
| pg151_o3_native.cx7_1g | 100 | 499 | 998 |
| pg151_o3_native_lto.cx7_1g | 100 | 499 | 998 |
| target | 100 | 500 | 1000 |
l.i0
l.i0: load without secondary indexes. Graphs for performance per 1-second interval are here.
Average throughput:
Insert response time histogram: each cell has the percentage of responses that take <= the time in the header and max is the max response time in seconds. For the max column values in the top 25% of the range have a red background and in the bottom 25% of the range have a green background. The red background is not used when the min value is within 80% of the max value.
| dbms | 256us | 1ms | 4ms | 16ms | 64ms | 256ms | 1s | 4s | 16s | gt | max |
|---|---|---|---|---|---|---|---|---|---|---|---|
| pg151_def.cx7_1g | 99.998 | 0.002 | 0.006 | ||||||||
| pg151_o2_nofp.cx7_1g | 99.999 | 0.002 | 0.005 | ||||||||
| pg151_o3.cx7_1g | 99.998 | 0.002 | 0.004 | ||||||||
| pg151_o3_native.cx7_1g | 99.998 | 0.002 | 0.006 | ||||||||
| pg151_o3_native_lto.cx7_1g | 0.003 | 99.995 | 0.002 | 0.006 |
Performance metrics for the DBMS listed above. Some are normalized by throughput, others are not. Legend for results is here.
ips	qps	rps	rmbps	wps	wmbps	rpq	rkbpq	wpi	wkbpi	csps	cpups	cspq	cpupq	dbgb1	dbgb2	rss	maxop	p50	p99	tag
72202	0	0	0.0	168.9	34.3	0.000	0.000	0.002	0.486	8886	23.3	0.123	26	1.9	5.2	0.0	0.006	72618	69911	20m.pg151_def.cx7_1g
72202	0	0	0.0	168.9	34.2	0.000	0.000	0.002	0.486	8899	22.9	0.123	25	1.9	5.2	0.0	0.005	72418	69330	20m.pg151_o2_nofp.cx7_1g
77220	0	0	0.0	173.3	36.8	0.000	0.000	0.002	0.488	9422	22.7	0.122	24	1.9	5.2	0.0	0.004	77115	73717	20m.pg151_o3.cx7_1g
78125	0	0	0.0	176.2	37.1	0.000	0.000	0.002	0.486	9558	22.9	0.122	23	1.9	5.2	0.0	0.006	78112	74812	20m.pg151_o3_native.cx7_1g
85470	0	0	0.0	165.5	40.4	0.000	0.000	0.002	0.484	10268	23.7	0.120	22	1.9	5.2	0.1	0.006	85406	74421	20m.pg151_o3_native_lto.cx7_1g
l.x
l.x: create secondary indexes.
Average throughput:
Performance metrics for the DBMS listed above. Some are normalized by throughput, others are not. Legend for results is here.
ips	qps	rps	rmbps	wps	wmbps	rpq	rkbpq	wpi	wkbpi	csps	cpups	cspq	cpupq	dbgb1	dbgb2	rss	maxop	p50	p99	tag
236470	0	0	0.0	108.1	47.7	0.000	0.000	0.000	0.206	742	12.1	0.003	4	3.7	8.6	0.0	0.003	NA	NA	20m.pg151_def.cx7_1g
236470	0	0	0.0	144.9	65.8	0.000	0.000	0.001	0.285	700	12.3	0.003	4	3.7	8.6	0.0	0.004	NA	NA	20m.pg151_o2_nofp.cx7_1g
242169	0	0	0.0	111.3	49.8	0.000	0.000	0.000	0.211	686	12.2	0.003	4	3.7	8.6	0.0	0.004	NA	NA	20m.pg151_o3.cx7_1g
248148	0	0	0.0	129.0	58.3	0.000	0.000	0.001	0.241	803	12.2	0.003	4	3.7	8.6	0.0	0.003	NA	NA	20m.pg151_o3_native.cx7_1g
254430	0	0	0.0	127.0	50.7	0.000	0.000	0.000	0.204	767	12.4	0.003	4	3.7	8.6	0.0	0.003	NA	NA	20m.pg151_o3_native_lto.cx7_1g
l.i1
l.i1: continue load after secondary indexes created. Graphs for performance per 1-second interval are here.
Average throughput:
Insert response time histogram: each cell has the percentage of responses that take <= the time in the header and max is the max response time in seconds. For the max column values in the top 25% of the range have a red background and in the bottom 25% of the range have a green background. The red background is not used when the min value is within 80% of the max value.
| dbms | 256us | 1ms | 4ms | 16ms | 64ms | 256ms | 1s | 4s | 16s | gt | max |
|---|---|---|---|---|---|---|---|---|---|---|---|
| pg151_def.cx7_1g | 99.983 | 0.017 | 0.011 | ||||||||
| pg151_o2_nofp.cx7_1g | 99.978 | 0.022 | 0.013 | ||||||||
| pg151_o3.cx7_1g | 99.990 | 0.010 | nonzero | 0.017 | |||||||
| pg151_o3_native.cx7_1g | 99.990 | 0.009 | 0.011 | ||||||||
| pg151_o3_native_lto.cx7_1g | 99.987 | 0.013 | nonzero | 0.021 |
Performance metrics for the DBMS listed above. Some are normalized by throughput, others are not. Legend for results is here.
ips	qps	rps	rmbps	wps	wmbps	rpq	rkbpq	wpi	wkbpi	csps	cpups	cspq	cpupq	dbgb1	dbgb2	rss	maxop	p50	p99	tag
19436	0	8	0.1	21784.3	244.8	0.000	0.003	1.121	12.900	6262	19.4	0.322	80	8.2	17.1	0.0	0.011	19578	15883	20m.pg151_def.cx7_1g
19120	0	7	0.0	21569.1	240.3	0.000	0.003	1.128	12.868	6194	19.4	0.324	81	8.2	17.0	0.0	0.013	19179	15632	20m.pg151_o2_nofp.cx7_1g
20000	0	27	0.2	22267.2	253.7	0.001	0.010	1.113	12.990	6435	19.7	0.322	79	8.2	17.1	0.0	0.017	20077	16478	20m.pg151_o3.cx7_1g
21345	0	27	0.2	22957.7	266.7	0.001	0.009	1.076	12.796	6883	19.8	0.322	74	8.2	17.6	0.0	0.011	21526	17081	20m.pg151_o3_native.cx7_1g
22124	0	73	0.5	23182.6	274.3	0.003	0.024	1.048	12.694	7158	20.0	0.324	72	8.2	17.5	0.0	0.021	22425	17530	20m.pg151_o3_native_lto.cx7_1g
q100.1
q100.1: range queries with 100 insert/s per client. Graphs for performance per 1-second interval are here.
Average throughput:

Query response time histogram: each cell has the percentage of responses that take <= the time in the header and max is the max response time in seconds. For max values in the top 25% of the range have a red background and in the bottom 25% of the range have a green background. The red background is not used when the min value is within 80% of the max value.
| dbms | 256us | 1ms | 4ms | 16ms | 64ms | 256ms | 1s | 4s | 16s | gt | max |
|---|---|---|---|---|---|---|---|---|---|---|---|
| pg151_def.cx7_1g | 99.936 | 0.063 | nonzero | nonzero | 0.010 | ||||||
| pg151_o2_nofp.cx7_1g | 99.943 | 0.056 | nonzero | nonzero | 0.010 | ||||||
| pg151_o3.cx7_1g | 99.938 | 0.061 | nonzero | nonzero | 0.010 | ||||||
| pg151_o3_native.cx7_1g | 99.944 | 0.055 | nonzero | nonzero | 0.010 | ||||||
| pg151_o3_native_lto.cx7_1g | 99.945 | 0.054 | 0.001 | nonzero | 0.010 |
Insert response time histogram: each cell has the percentage of responses that take <= the time in the header and max is the max response time in seconds. For max values in the top 25% of the range have a red background and in the bottom 25% of the range have a green background. The red background is not used when the min value is within 80% of the max value.
| dbms | 256us | 1ms | 4ms | 16ms | 64ms | 256ms | 1s | 4s | 16s | gt | max |
|---|---|---|---|---|---|---|---|---|---|---|---|
| pg151_def.cx7_1g | 99.167 | 0.833 | 0.011 | ||||||||
| pg151_o2_nofp.cx7_1g | 98.778 | 1.222 | 0.013 | ||||||||
| pg151_o3.cx7_1g | 99.500 | 0.500 | 0.012 | ||||||||
| pg151_o3_native.cx7_1g | 99.833 | 0.167 | 0.012 | ||||||||
| pg151_o3_native_lto.cx7_1g | 99.611 | 0.389 | 0.012 |
Performance metrics for the DBMS listed above. Some are normalized by throughput, others are not. Legend for results is here.
ips	qps	rps	rmbps	wps	wmbps	rpq	rkbpq	wpi	wkbpi	csps	cpups	cspq	cpupq	dbgb1	dbgb2	rss	maxop	p50	p99	tag
100	7936	2	0.0	394.1	5.2	0.000	0.001	3.953	53.112	30487	13.1	3.842	132	8.2	15.8	0.0	0.010	7607	7397	20m.pg151_def.cx7_1g
100	7703	7	0.0	399.7	5.3	0.001	0.005	4.009	53.925	29595	12.9	3.842	134	8.2	15.8	0.0	0.010	7464	7335	20m.pg151_o2_nofp.cx7_1g
100	7889	6	0.0	398.4	5.0	0.001	0.003	3.992	51.301	30280	13.1	3.838	133	8.2	15.7	0.0	0.010	7702	7429	20m.pg151_o3.cx7_1g
100	8158	6	0.0	404.5	5.1	0.001	0.003	4.053	52.770	31616	13.8	3.875	135	8.2	16.0	0.0	0.010	7895	7624	20m.pg151_o3_native.cx7_1g
100	8685	2	0.0	357.5	4.5	0.000	0.001	3.582	45.753	33326	13.3	3.837	123	8.2	15.8	0.0	0.010	8454	8295	20m.pg151_o3_native_lto.cx7_1g
q500.1
q500.1: range queries with 500 insert/s per client. Graphs for performance per 1-second interval are here.
Average throughput:
Query response time histogram: each cell has the percentage of responses that take <= the time in the header and max is the max response time in seconds. For max values in the top 25% of the range have a red background and in the bottom 25% of the range have a green background. The red background is not used when the min value is within 80% of the max value.
| dbms | 256us | 1ms | 4ms | 16ms | 64ms | 256ms | 1s | 4s | 16s | gt | max |
|---|---|---|---|---|---|---|---|---|---|---|---|
| pg151_def.cx7_1g | 99.965 | 0.035 | nonzero | 0.004 | |||||||
| pg151_o2_nofp.cx7_1g | 99.969 | 0.031 | nonzero | 0.004 | |||||||
| pg151_o3.cx7_1g | 99.966 | 0.034 | nonzero | 0.003 | |||||||
| pg151_o3_native.cx7_1g | 99.960 | 0.040 | nonzero | nonzero | 0.005 | ||||||
| pg151_o3_native_lto.cx7_1g | 99.970 | 0.030 | nonzero | nonzero | 0.005 |
Insert response time histogram: each cell has the percentage of responses that take <= the time in the header and max is the max response time in seconds. For max values in the top 25% of the range have a red background and in the bottom 25% of the range have a green background. The red background is not used when the min value is within 80% of the max value.
| dbms | 256us | 1ms | 4ms | 16ms | 64ms | 256ms | 1s | 4s | 16s | gt | max |
|---|---|---|---|---|---|---|---|---|---|---|---|
| pg151_def.cx7_1g | 99.250 | 0.750 | 0.013 | ||||||||
| pg151_o2_nofp.cx7_1g | 99.239 | 0.761 | 0.012 | ||||||||
| pg151_o3.cx7_1g | 99.400 | 0.600 | 0.012 | ||||||||
| pg151_o3_native.cx7_1g | 99.722 | 0.278 | 0.013 | ||||||||
| pg151_o3_native_lto.cx7_1g | 99.733 | 0.267 | 0.012 |
Performance metrics for the DBMS listed above. Some are normalized by throughput, others are not. Legend for results is here.
ips	qps	rps	rmbps	wps	wmbps	rpq	rkbpq	wpi	wkbpi	csps	cpups	cspq	cpupq	dbgb1	dbgb2	rss	maxop	p50	p99	tag
499	7771	5	0.0	1356.0	16.7	0.001	0.005	2.719	34.346	29979	13.3	3.858	137	8.4	13.8	0.0	0.004	7575	7478	20m.pg151_def.cx7_1g
499	7715	0	0.0	1355.4	16.7	0.000	0.000	2.716	34.247	29741	13.3	3.855	138	8.4	13.7	0.0	0.004	7478	7368	20m.pg151_o2_nofp.cx7_1g
499	7984	0	0.0	1358.5	16.8	0.000	0.000	2.723	34.467	30795	13.3	3.857	133	8.4	13.7	0.0	0.003	7733	7645	20m.pg151_o3.cx7_1g
499	8278	0	0.0	1362.5	16.8	0.000	0.000	2.730	34.474	31889	13.7	3.852	132	8.4	13.9	0.0	0.005	7898	7787	20m.pg151_o3_native.cx7_1g
499	8835	10	0.1	1369.8	16.8	0.001	0.009	2.745	34.432	34014	13.8	3.850	125	8.4	13.7	0.0	0.005	8502	8406	20m.pg151_o3_native_lto.cx7_1g
q1000.1
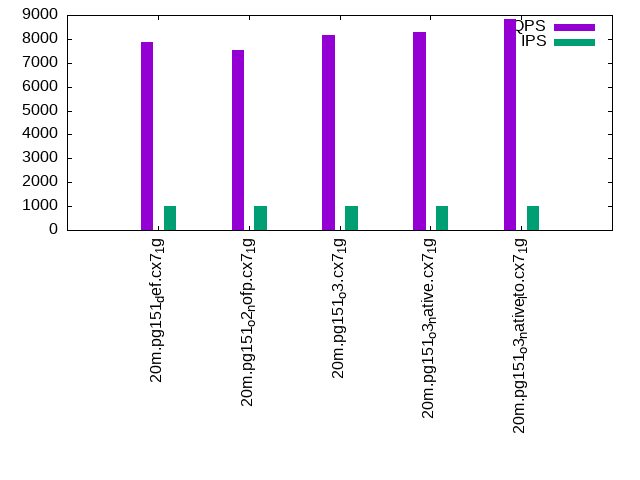
q1000.1: range queries with 1000 insert/s per client. Graphs for performance per 1-second interval are here.
Average throughput:
Query response time histogram: each cell has the percentage of responses that take <= the time in the header and max is the max response time in seconds. For max values in the top 25% of the range have a red background and in the bottom 25% of the range have a green background. The red background is not used when the min value is within 80% of the max value.
| dbms | 256us | 1ms | 4ms | 16ms | 64ms | 256ms | 1s | 4s | 16s | gt | max |
|---|---|---|---|---|---|---|---|---|---|---|---|
| pg151_def.cx7_1g | 99.964 | 0.036 | nonzero | nonzero | 0.006 | ||||||
| pg151_o2_nofp.cx7_1g | 99.963 | 0.036 | nonzero | nonzero | 0.005 | ||||||
| pg151_o3.cx7_1g | 99.952 | 0.048 | nonzero | nonzero | 0.008 | ||||||
| pg151_o3_native.cx7_1g | 99.971 | 0.029 | nonzero | nonzero | 0.006 | ||||||
| pg151_o3_native_lto.cx7_1g | 99.973 | 0.027 | nonzero | nonzero | 0.006 |
Insert response time histogram: each cell has the percentage of responses that take <= the time in the header and max is the max response time in seconds. For max values in the top 25% of the range have a red background and in the bottom 25% of the range have a green background. The red background is not used when the min value is within 80% of the max value.
| dbms | 256us | 1ms | 4ms | 16ms | 64ms | 256ms | 1s | 4s | 16s | gt | max |
|---|---|---|---|---|---|---|---|---|---|---|---|
| pg151_def.cx7_1g | 98.256 | 1.744 | 0.013 | ||||||||
| pg151_o2_nofp.cx7_1g | 98.278 | 1.722 | 0.013 | ||||||||
| pg151_o3.cx7_1g | 98.883 | 1.117 | 0.013 | ||||||||
| pg151_o3_native.cx7_1g | 99.278 | 0.722 | 0.012 | ||||||||
| pg151_o3_native_lto.cx7_1g | 99.486 | 0.514 | 0.012 |
Performance metrics for the DBMS listed above. Some are normalized by throughput, others are not. Legend for results is here.
ips	qps	rps	rmbps	wps	wmbps	rpq	rkbpq	wpi	wkbpi	csps	cpups	cspq	cpupq	dbgb1	dbgb2	rss	maxop	p50	p99	tag
998	7884	2	0.0	2635.3	29.0	0.000	0.001	2.640	29.735	30565	14.6	3.877	148	9.0	14.1	0.0	0.006	7574	7466	20m.pg151_def.cx7_1g
998	7537	2	0.0	2622.6	28.9	0.000	0.001	2.627	29.606	29245	14.4	3.880	153	9.0	14.0	0.0	0.005	7336	7238	20m.pg151_o2_nofp.cx7_1g
998	8166	6	0.0	2644.4	29.1	0.001	0.004	2.649	29.883	31675	14.7	3.879	144	9.0	14.1	0.0	0.008	7735	7606	20m.pg151_o3.cx7_1g
998	8281	8	0.0	2648.9	29.2	0.001	0.006	2.653	29.972	32083	14.2	3.874	137	9.0	14.2	0.0	0.006	7957	7847	20m.pg151_o3_native.cx7_1g
998	8824	3	0.0	2663.8	29.3	0.000	0.002	2.668	30.041	34155	14.3	3.871	130	9.0	14.1	0.0	0.006	8518	8357	20m.pg151_o3_native_lto.cx7_1g
l.i0
l.i0: load without secondary indexes
Performance metrics for all DBMS, not just the ones listed above. Some are normalized by throughput, others are not. Legend for results is here.
ips	qps	rps	rmbps	wps	wmbps	rpq	rkbpq	wpi	wkbpi	csps	cpups	cspq	cpupq	dbgb1	dbgb2	rss	maxop	p50	p99	tag
72202	0	0	0.0	168.9	34.3	0.000	0.000	0.002	0.486	8886	23.3	0.123	26	1.9	5.2	0.0	0.006	72618	69911	20m.pg151_def.cx7_1g
72202	0	0	0.0	168.9	34.2	0.000	0.000	0.002	0.486	8899	22.9	0.123	25	1.9	5.2	0.0	0.005	72418	69330	20m.pg151_o2_nofp.cx7_1g
77220	0	0	0.0	173.3	36.8	0.000	0.000	0.002	0.488	9422	22.7	0.122	24	1.9	5.2	0.0	0.004	77115	73717	20m.pg151_o3.cx7_1g
78125	0	0	0.0	176.2	37.1	0.000	0.000	0.002	0.486	9558	22.9	0.122	23	1.9	5.2	0.0	0.006	78112	74812	20m.pg151_o3_native.cx7_1g
85470	0	0	0.0	165.5	40.4	0.000	0.000	0.002	0.484	10268	23.7	0.120	22	1.9	5.2	0.1	0.006	85406	74421	20m.pg151_o3_native_lto.cx7_1g
l.x
l.x: create secondary indexes
Performance metrics for all DBMS, not just the ones listed above. Some are normalized by throughput, others are not. Legend for results is here.
ips	qps	rps	rmbps	wps	wmbps	rpq	rkbpq	wpi	wkbpi	csps	cpups	cspq	cpupq	dbgb1	dbgb2	rss	maxop	p50	p99	tag
236470	0	0	0.0	108.1	47.7	0.000	0.000	0.000	0.206	742	12.1	0.003	4	3.7	8.6	0.0	0.003	NA	NA	20m.pg151_def.cx7_1g
236470	0	0	0.0	144.9	65.8	0.000	0.000	0.001	0.285	700	12.3	0.003	4	3.7	8.6	0.0	0.004	NA	NA	20m.pg151_o2_nofp.cx7_1g
242169	0	0	0.0	111.3	49.8	0.000	0.000	0.000	0.211	686	12.2	0.003	4	3.7	8.6	0.0	0.004	NA	NA	20m.pg151_o3.cx7_1g
248148	0	0	0.0	129.0	58.3	0.000	0.000	0.001	0.241	803	12.2	0.003	4	3.7	8.6	0.0	0.003	NA	NA	20m.pg151_o3_native.cx7_1g
254430	0	0	0.0	127.0	50.7	0.000	0.000	0.000	0.204	767	12.4	0.003	4	3.7	8.6	0.0	0.003	NA	NA	20m.pg151_o3_native_lto.cx7_1g
l.i1
l.i1: continue load after secondary indexes created
Performance metrics for all DBMS, not just the ones listed above. Some are normalized by throughput, others are not. Legend for results is here.
ips	qps	rps	rmbps	wps	wmbps	rpq	rkbpq	wpi	wkbpi	csps	cpups	cspq	cpupq	dbgb1	dbgb2	rss	maxop	p50	p99	tag
19436	0	8	0.1	21784.3	244.8	0.000	0.003	1.121	12.900	6262	19.4	0.322	80	8.2	17.1	0.0	0.011	19578	15883	20m.pg151_def.cx7_1g
19120	0	7	0.0	21569.1	240.3	0.000	0.003	1.128	12.868	6194	19.4	0.324	81	8.2	17.0	0.0	0.013	19179	15632	20m.pg151_o2_nofp.cx7_1g
20000	0	27	0.2	22267.2	253.7	0.001	0.010	1.113	12.990	6435	19.7	0.322	79	8.2	17.1	0.0	0.017	20077	16478	20m.pg151_o3.cx7_1g
21345	0	27	0.2	22957.7	266.7	0.001	0.009	1.076	12.796	6883	19.8	0.322	74	8.2	17.6	0.0	0.011	21526	17081	20m.pg151_o3_native.cx7_1g
22124	0	73	0.5	23182.6	274.3	0.003	0.024	1.048	12.694	7158	20.0	0.324	72	8.2	17.5	0.0	0.021	22425	17530	20m.pg151_o3_native_lto.cx7_1g
q100.1
q100.1: range queries with 100 insert/s per client
Performance metrics for all DBMS, not just the ones listed above. Some are normalized by throughput, others are not. Legend for results is here.
ips	qps	rps	rmbps	wps	wmbps	rpq	rkbpq	wpi	wkbpi	csps	cpups	cspq	cpupq	dbgb1	dbgb2	rss	maxop	p50	p99	tag
100	7936	2	0.0	394.1	5.2	0.000	0.001	3.953	53.112	30487	13.1	3.842	132	8.2	15.8	0.0	0.010	7607	7397	20m.pg151_def.cx7_1g
100	7703	7	0.0	399.7	5.3	0.001	0.005	4.009	53.925	29595	12.9	3.842	134	8.2	15.8	0.0	0.010	7464	7335	20m.pg151_o2_nofp.cx7_1g
100	7889	6	0.0	398.4	5.0	0.001	0.003	3.992	51.301	30280	13.1	3.838	133	8.2	15.7	0.0	0.010	7702	7429	20m.pg151_o3.cx7_1g
100	8158	6	0.0	404.5	5.1	0.001	0.003	4.053	52.770	31616	13.8	3.875	135	8.2	16.0	0.0	0.010	7895	7624	20m.pg151_o3_native.cx7_1g
100	8685	2	0.0	357.5	4.5	0.000	0.001	3.582	45.753	33326	13.3	3.837	123	8.2	15.8	0.0	0.010	8454	8295	20m.pg151_o3_native_lto.cx7_1g
q500.1
q500.1: range queries with 500 insert/s per client
Performance metrics for all DBMS, not just the ones listed above. Some are normalized by throughput, others are not. Legend for results is here.
ips	qps	rps	rmbps	wps	wmbps	rpq	rkbpq	wpi	wkbpi	csps	cpups	cspq	cpupq	dbgb1	dbgb2	rss	maxop	p50	p99	tag
499	7771	5	0.0	1356.0	16.7	0.001	0.005	2.719	34.346	29979	13.3	3.858	137	8.4	13.8	0.0	0.004	7575	7478	20m.pg151_def.cx7_1g
499	7715	0	0.0	1355.4	16.7	0.000	0.000	2.716	34.247	29741	13.3	3.855	138	8.4	13.7	0.0	0.004	7478	7368	20m.pg151_o2_nofp.cx7_1g
499	7984	0	0.0	1358.5	16.8	0.000	0.000	2.723	34.467	30795	13.3	3.857	133	8.4	13.7	0.0	0.003	7733	7645	20m.pg151_o3.cx7_1g
499	8278	0	0.0	1362.5	16.8	0.000	0.000	2.730	34.474	31889	13.7	3.852	132	8.4	13.9	0.0	0.005	7898	7787	20m.pg151_o3_native.cx7_1g
499	8835	10	0.1	1369.8	16.8	0.001	0.009	2.745	34.432	34014	13.8	3.850	125	8.4	13.7	0.0	0.005	8502	8406	20m.pg151_o3_native_lto.cx7_1g
q1000.1
q1000.1: range queries with 1000 insert/s per client
Performance metrics for all DBMS, not just the ones listed above. Some are normalized by throughput, others are not. Legend for results is here.
ips	qps	rps	rmbps	wps	wmbps	rpq	rkbpq	wpi	wkbpi	csps	cpups	cspq	cpupq	dbgb1	dbgb2	rss	maxop	p50	p99	tag
998	7884	2	0.0	2635.3	29.0	0.000	0.001	2.640	29.735	30565	14.6	3.877	148	9.0	14.1	0.0	0.006	7574	7466	20m.pg151_def.cx7_1g
998	7537	2	0.0	2622.6	28.9	0.000	0.001	2.627	29.606	29245	14.4	3.880	153	9.0	14.0	0.0	0.005	7336	7238	20m.pg151_o2_nofp.cx7_1g
998	8166	6	0.0	2644.4	29.1	0.001	0.004	2.649	29.883	31675	14.7	3.879	144	9.0	14.1	0.0	0.008	7735	7606	20m.pg151_o3.cx7_1g
998	8281	8	0.0	2648.9	29.2	0.001	0.006	2.653	29.972	32083	14.2	3.874	137	9.0	14.2	0.0	0.006	7957	7847	20m.pg151_o3_native.cx7_1g
998	8824	3	0.0	2663.8	29.3	0.000	0.002	2.668	30.041	34155	14.3	3.871	130	9.0	14.1	0.0	0.006	8518	8357	20m.pg151_o3_native_lto.cx7_1g
l.i0
- l.i0: load without secondary indexes
- Legend for results is here.
- Each entry lists the percentage of responses that fit in that bucket (slower than max time for previous bucket, faster than min time for next bucket).
Insert response time histogram
256us	1ms	4ms	16ms	64ms	256ms	1s	4s	16s	gt	max	tag
0.000	0.000	99.998	0.002	0.000	0.000	0.000	0.000	0.000	0.000	0.006	pg151_def.cx7_1g
0.000	0.000	99.999	0.002	0.000	0.000	0.000	0.000	0.000	0.000	0.005	pg151_o2_nofp.cx7_1g
0.000	0.000	99.998	0.002	0.000	0.000	0.000	0.000	0.000	0.000	0.004	pg151_o3.cx7_1g
0.000	0.000	99.998	0.002	0.000	0.000	0.000	0.000	0.000	0.000	0.006	pg151_o3_native.cx7_1g
0.000	0.003	99.995	0.002	0.000	0.000	0.000	0.000	0.000	0.000	0.006	pg151_o3_native_lto.cx7_1g
l.x
- l.x: create secondary indexes
- Legend for results is here.
- Each entry lists the percentage of responses that fit in that bucket (slower than max time for previous bucket, faster than min time for next bucket).
TODO - determine whether there is data for create index response time
l.i1
- l.i1: continue load after secondary indexes created
- Legend for results is here.
- Each entry lists the percentage of responses that fit in that bucket (slower than max time for previous bucket, faster than min time for next bucket).
Insert response time histogram
256us	1ms	4ms	16ms	64ms	256ms	1s	4s	16s	gt	max	tag
0.000	0.000	99.983	0.017	0.000	0.000	0.000	0.000	0.000	0.000	0.011	pg151_def.cx7_1g
0.000	0.000	99.978	0.022	0.000	0.000	0.000	0.000	0.000	0.000	0.013	pg151_o2_nofp.cx7_1g
0.000	0.000	99.990	0.010	nonzero	0.000	0.000	0.000	0.000	0.000	0.017	pg151_o3.cx7_1g
0.000	0.000	99.990	0.009	0.000	0.000	0.000	0.000	0.000	0.000	0.011	pg151_o3_native.cx7_1g
0.000	0.000	99.987	0.013	nonzero	0.000	0.000	0.000	0.000	0.000	0.021	pg151_o3_native_lto.cx7_1g
q100.1
- q100.1: range queries with 100 insert/s per client
- Legend for results is here.
- Each entry lists the percentage of responses that fit in that bucket (slower than max time for previous bucket, faster than min time for next bucket).
Query response time histogram
256us	1ms	4ms	16ms	64ms	256ms	1s	4s	16s	gt	max	tag
99.936	0.063	nonzero	nonzero	0.000	0.000	0.000	0.000	0.000	0.000	0.010	pg151_def.cx7_1g
99.943	0.056	nonzero	nonzero	0.000	0.000	0.000	0.000	0.000	0.000	0.010	pg151_o2_nofp.cx7_1g
99.938	0.061	nonzero	nonzero	0.000	0.000	0.000	0.000	0.000	0.000	0.010	pg151_o3.cx7_1g
99.944	0.055	nonzero	nonzero	0.000	0.000	0.000	0.000	0.000	0.000	0.010	pg151_o3_native.cx7_1g
99.945	0.054	0.001	nonzero	0.000	0.000	0.000	0.000	0.000	0.000	0.010	pg151_o3_native_lto.cx7_1g
Insert response time histogram
256us	1ms	4ms	16ms	64ms	256ms	1s	4s	16s	gt	max	tag
0.000	0.000	99.167	0.833	0.000	0.000	0.000	0.000	0.000	0.000	0.011	pg151_def.cx7_1g
0.000	0.000	98.778	1.222	0.000	0.000	0.000	0.000	0.000	0.000	0.013	pg151_o2_nofp.cx7_1g
0.000	0.000	99.500	0.500	0.000	0.000	0.000	0.000	0.000	0.000	0.012	pg151_o3.cx7_1g
0.000	0.000	99.833	0.167	0.000	0.000	0.000	0.000	0.000	0.000	0.012	pg151_o3_native.cx7_1g
0.000	0.000	99.611	0.389	0.000	0.000	0.000	0.000	0.000	0.000	0.012	pg151_o3_native_lto.cx7_1g
q500.1
- q500.1: range queries with 500 insert/s per client
- Legend for results is here.
- Each entry lists the percentage of responses that fit in that bucket (slower than max time for previous bucket, faster than min time for next bucket).
Query response time histogram
256us	1ms	4ms	16ms	64ms	256ms	1s	4s	16s	gt	max	tag
99.965	0.035	nonzero	0.000	0.000	0.000	0.000	0.000	0.000	0.000	0.004	pg151_def.cx7_1g
99.969	0.031	nonzero	0.000	0.000	0.000	0.000	0.000	0.000	0.000	0.004	pg151_o2_nofp.cx7_1g
99.966	0.034	nonzero	0.000	0.000	0.000	0.000	0.000	0.000	0.000	0.003	pg151_o3.cx7_1g
99.960	0.040	nonzero	nonzero	0.000	0.000	0.000	0.000	0.000	0.000	0.005	pg151_o3_native.cx7_1g
99.970	0.030	nonzero	nonzero	0.000	0.000	0.000	0.000	0.000	0.000	0.005	pg151_o3_native_lto.cx7_1g
Insert response time histogram
256us	1ms	4ms	16ms	64ms	256ms	1s	4s	16s	gt	max	tag
0.000	0.000	99.250	0.750	0.000	0.000	0.000	0.000	0.000	0.000	0.013	pg151_def.cx7_1g
0.000	0.000	99.239	0.761	0.000	0.000	0.000	0.000	0.000	0.000	0.012	pg151_o2_nofp.cx7_1g
0.000	0.000	99.400	0.600	0.000	0.000	0.000	0.000	0.000	0.000	0.012	pg151_o3.cx7_1g
0.000	0.000	99.722	0.278	0.000	0.000	0.000	0.000	0.000	0.000	0.013	pg151_o3_native.cx7_1g
0.000	0.000	99.733	0.267	0.000	0.000	0.000	0.000	0.000	0.000	0.012	pg151_o3_native_lto.cx7_1g
q1000.1
- q1000.1: range queries with 1000 insert/s per client
- Legend for results is here.
- Each entry lists the percentage of responses that fit in that bucket (slower than max time for previous bucket, faster than min time for next bucket).
Query response time histogram
256us	1ms	4ms	16ms	64ms	256ms	1s	4s	16s	gt	max	tag
99.964	0.036	nonzero	nonzero	0.000	0.000	0.000	0.000	0.000	0.000	0.006	pg151_def.cx7_1g
99.963	0.036	nonzero	nonzero	0.000	0.000	0.000	0.000	0.000	0.000	0.005	pg151_o2_nofp.cx7_1g
99.952	0.048	nonzero	nonzero	0.000	0.000	0.000	0.000	0.000	0.000	0.008	pg151_o3.cx7_1g
99.971	0.029	nonzero	nonzero	0.000	0.000	0.000	0.000	0.000	0.000	0.006	pg151_o3_native.cx7_1g
99.973	0.027	nonzero	nonzero	0.000	0.000	0.000	0.000	0.000	0.000	0.006	pg151_o3_native_lto.cx7_1g
Insert response time histogram
256us	1ms	4ms	16ms	64ms	256ms	1s	4s	16s	gt	max	tag
0.000	0.000	98.256	1.744	0.000	0.000	0.000	0.000	0.000	0.000	0.013	pg151_def.cx7_1g
0.000	0.000	98.278	1.722	0.000	0.000	0.000	0.000	0.000	0.000	0.013	pg151_o2_nofp.cx7_1g
0.000	0.000	98.883	1.117	0.000	0.000	0.000	0.000	0.000	0.000	0.013	pg151_o3.cx7_1g
0.000	0.000	99.278	0.722	0.000	0.000	0.000	0.000	0.000	0.000	0.012	pg151_o3_native.cx7_1g
0.000	0.000	99.486	0.514	0.000	0.000	0.000	0.000	0.000	0.000	0.012	pg151_o3_native_lto.cx7_1g