Introduction
This is a report for the insert benchmark with 400M docs and 20 client(s). It is generated by scripts (bash, awk, sed) and Tufte might not be impressed. An overview of the insert benchmark is here and a short update is here. Below, by DBMS, I mean DBMS+version.config. An example is my8020.c10b40 where my means MySQL, 8020 is version 8.0.20 and c10b40 is the name for the configuration file.
The test server is c2-standard-60 from GCP with 30 cores, hyperthreading disabled, 240G RAM and 3T of NVMe storage. The benchmark was run with 20 clients and there were 1 or 2 connections per client (1 for queries, 1 for inserts). The benchmark loads 400M rows without secondary indexes, creates secondary indexes, loads another 400M rows then does 3 read+write tests for 1800 seconds each that do queries as fast as possible with 100, 500 and then 1000 writes/second/client concurrent with the queries. All clients shared one table. The database is cached by the storage engine and the only IO is for writes. Clients and the DBMS share one server. The per-database configs are in the per-database subdirectories here.
The tested DBMS are:
- fbmy8028_rel_o2.cy9c_gcp_c2s60 - MyRocks 8.0.28, the cy9c_gcp_c2s60 config and compiled with CMAKE_BUILD_TYPE=Release and -O2
- fbmy8028_rel.cy9c_gcp_c2s60 - MyRocks 8.0.28, the cy9c_gcp_c2s60 config and compiled with CMAKE_BUILD_TYPE=Release and -O3
- fbmy8028_rel_native.cy9c_gcp_c2s60 - MyRocks 8.0.28, the cy9c_gcp_c2s60 config and compiled with CMAKE_BUILD_TYPE=Release and -O3 -march=native -mtune=native
- fbmy8028_rel_lto.cy9c_gcp_c2s60 - MyRocks 8.0.28, the cy9c_gcp_c2s60 config and compiled with CMAKE_BUILD_TYPE=Release and -O3 -flto
- fbmy8028_rel_native_lto.cy9c_gcp_c2s60 - MyRocks 8.0.28, the cy9c_gcp_c2s60 config and compiled with CMAKE_BUILD_TYPE=Release and -O3 -flto -march=native -mtune=native
Contents
- Summary
- l.i0: load without secondary indexes
- l.x: create secondary indexes
- l.i1: continue load after secondary indexes created
- q100.1: range queries with 100 insert/s per client
- q500.1: range queries with 500 insert/s per client
- q1000.1: range queries with 1000 insert/s per client
Summary
The numbers are inserts/s for l.i0 and l.i1, indexed docs (or rows) /s for l.x and queries/s for q*.2. The values are the average rate over the entire test for inserts (IPS) and queries (QPS). The range of values for IPS and QPS is split into 3 parts: bottom 25%, middle 50%, top 25%. Values in the bottom 25% have a red background, values in the top 25% have a green background and values in the middle have no color. A gray background is used for values that can be ignored because the DBMS did not sustain the target insert rate. Red backgrounds are not used when the minimum value is within 80% of the max value.
| dbms | l.i0 | l.x | l.i1 | q100.1 | q500.1 | q1000.1 |
|---|---|---|---|---|---|---|
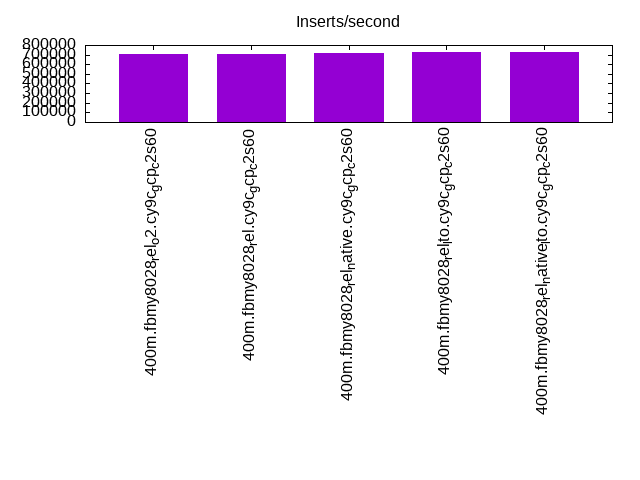
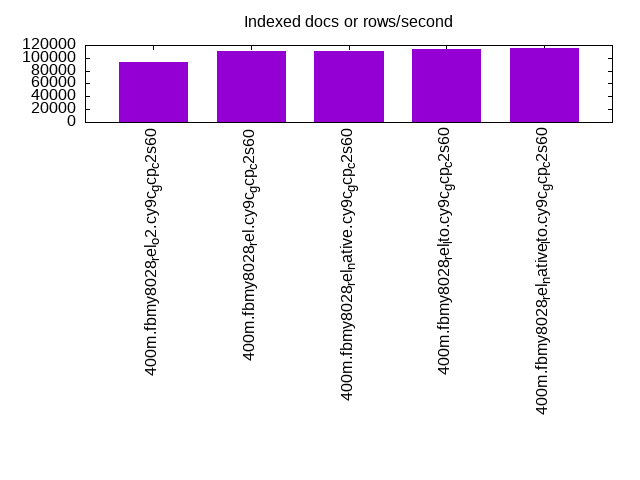
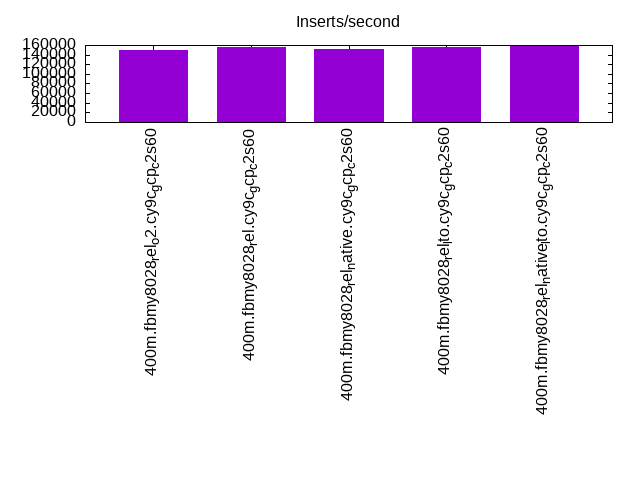
| 400m.fbmy8028_rel_o2.cy9c_gcp_c2s60 | 702988 | 93876 | 150263 | 75507 | 73978 | 71777 |
| 400m.fbmy8028_rel.cy9c_gcp_c2s60 | 710480 | 110923 | 155400 | 82791 | 80602 | 77390 |
| 400m.fbmy8028_rel_native.cy9c_gcp_c2s60 | 713012 | 111232 | 151400 | 82781 | 79972 | 77290 |
| 400m.fbmy8028_rel_lto.cy9c_gcp_c2s60 | 727273 | 113826 | 155159 | 82496 | 80900 | 77982 |
| 400m.fbmy8028_rel_native_lto.cy9c_gcp_c2s60 | 731261 | 115236 | 159744 | 82689 | 80367 | 77959 |
This table has relative throughput, throughput for the DBMS relative to the DBMS in the first line, using the absolute throughput from the previous table.
| dbms | l.i0 | l.x | l.i1 | q100.1 | q500.1 | q1000.1 |
|---|---|---|---|---|---|---|
| 400m.fbmy8028_rel_o2.cy9c_gcp_c2s60 | 1.00 | 1.00 | 1.00 | 1.00 | 1.00 | 1.00 |
| 400m.fbmy8028_rel.cy9c_gcp_c2s60 | 1.01 | 1.18 | 1.03 | 1.10 | 1.09 | 1.08 |
| 400m.fbmy8028_rel_native.cy9c_gcp_c2s60 | 1.01 | 1.18 | 1.01 | 1.10 | 1.08 | 1.08 |
| 400m.fbmy8028_rel_lto.cy9c_gcp_c2s60 | 1.03 | 1.21 | 1.03 | 1.09 | 1.09 | 1.09 |
| 400m.fbmy8028_rel_native_lto.cy9c_gcp_c2s60 | 1.04 | 1.23 | 1.06 | 1.10 | 1.09 | 1.09 |
This lists the average rate of inserts/s for the tests that do inserts concurrent with queries. For such tests the query rate is listed in the table above. The read+write tests are setup so that the insert rate should match the target rate every second. Cells that are not at least 95% of the target have a red background to indicate a failure to satisfy the target.
| dbms | q100.1 | q500.1 | q1000.1 |
|---|---|---|---|
| fbmy8028_rel_o2.cy9c_gcp_c2s60 | 1976 | 9885 | 19769 |
| fbmy8028_rel.cy9c_gcp_c2s60 | 1976 | 9885 | 19769 |
| fbmy8028_rel_native.cy9c_gcp_c2s60 | 1976 | 9885 | 19769 |
| fbmy8028_rel_lto.cy9c_gcp_c2s60 | 1976 | 9885 | 19769 |
| fbmy8028_rel_native_lto.cy9c_gcp_c2s60 | 1977 | 9885 | 19769 |
| target | 2000 | 10000 | 20000 |
l.i0
l.i0: load without secondary indexes. Graphs for performance per 1-second interval are here.
Average throughput:
Insert response time histogram: each cell has the percentage of responses that take <= the time in the header and max is the max response time in seconds. For the max column values in the top 25% of the range have a red background and in the bottom 25% of the range have a green background. The red background is not used when the min value is within 80% of the max value.
| dbms | 256us | 1ms | 4ms | 16ms | 64ms | 256ms | 1s | 4s | 16s | gt | max |
|---|---|---|---|---|---|---|---|---|---|---|---|
| fbmy8028_rel_o2.cy9c_gcp_c2s60 | 0.340 | 98.528 | 1.089 | 0.008 | 0.036 | 0.250 | |||||
| fbmy8028_rel.cy9c_gcp_c2s60 | 0.345 | 98.638 | 0.974 | 0.006 | 0.036 | 0.253 | |||||
| fbmy8028_rel_native.cy9c_gcp_c2s60 | 0.454 | 98.551 | 0.954 | 0.005 | 0.036 | 0.244 | |||||
| fbmy8028_rel_lto.cy9c_gcp_c2s60 | 0.688 | 98.511 | 0.760 | 0.005 | 0.036 | 0.250 | |||||
| fbmy8028_rel_native_lto.cy9c_gcp_c2s60 | 0.525 | 98.682 | 0.751 | 0.007 | 0.036 | 0.239 |
Performance metrics for the DBMS listed above. Some are normalized by throughput, others are not. Legend for results is here.
ips	qps	rps	rmbps	wps	wmbps	rpq	rkbpq	wpi	wkbpi	csps	cpups	cspq	cpupq	dbgb1	dbgb2	rss	maxop	p50	p99	tag
702988	0	0	0.0	442.4	102.1	0.000	0.000	0.001	0.149	129259	44.8	0.184	19	12.6	13.1	1.7	0.250	36959	28669	400m.fbmy8028_rel_o2.cy9c_gcp_c2s60
710480	0	0	0.0	442.1	102.2	0.000	0.000	0.001	0.147	130945	44.6	0.184	19	12.5	13.0	1.7	0.253	37077	28769	400m.fbmy8028_rel.cy9c_gcp_c2s60
713012	0	0	0.0	442.8	104.2	0.000	0.000	0.001	0.150	131557	43.9	0.185	18	12.6	13.1	1.7	0.244	37359	28868	400m.fbmy8028_rel_native.cy9c_gcp_c2s60
727273	0	0	0.0	451.2	105.1	0.000	0.000	0.001	0.148	134990	43.9	0.186	18	12.6	13.1	1.7	0.250	38058	29268	400m.fbmy8028_rel_lto.cy9c_gcp_c2s60
731261	0	0	0.0	455.8	106.5	0.000	0.000	0.001	0.149	134628	44.8	0.184	18	12.5	13.0	1.7	0.239	38173	29467	400m.fbmy8028_rel_native_lto.cy9c_gcp_c2s60
l.x
l.x: create secondary indexes.
Average throughput:
Performance metrics for the DBMS listed above. Some are normalized by throughput, others are not. Legend for results is here.
ips	qps	rps	rmbps	wps	wmbps	rpq	rkbpq	wpi	wkbpi	csps	cpups	cspq	cpupq	dbgb1	dbgb2	rss	maxop	p50	p99	tag
93876	0	0	0.0	33.3	11.1	0.000	0.000	0.000	0.121	669	2.9	0.007	9	25.3	25.8	26.3	0.002	NA	NA	400m.fbmy8028_rel_o2.cy9c_gcp_c2s60
110923	0	0	0.0	39.6	13.3	0.000	0.000	0.000	0.123	723	2.9	0.007	8	25.3	25.9	26.0	0.002	NA	NA	400m.fbmy8028_rel.cy9c_gcp_c2s60
111232	0	0	0.0	40.0	13.5	0.000	0.000	0.000	0.125	729	2.9	0.007	8	25.3	25.8	26.2	0.002	NA	NA	400m.fbmy8028_rel_native.cy9c_gcp_c2s60
113826	0	0	0.0	40.5	13.8	0.000	0.000	0.000	0.124	730	2.9	0.006	8	25.3	25.8	26.3	0.002	NA	NA	400m.fbmy8028_rel_lto.cy9c_gcp_c2s60
115236	0	0	0.0	40.9	14.0	0.000	0.000	0.000	0.124	754	2.9	0.007	8	25.3	25.8	26.0	0.002	NA	NA	400m.fbmy8028_rel_native_lto.cy9c_gcp_c2s60
l.i1
l.i1: continue load after secondary indexes created. Graphs for performance per 1-second interval are here.
Average throughput:
Insert response time histogram: each cell has the percentage of responses that take <= the time in the header and max is the max response time in seconds. For the max column values in the top 25% of the range have a red background and in the bottom 25% of the range have a green background. The red background is not used when the min value is within 80% of the max value.
| dbms | 256us | 1ms | 4ms | 16ms | 64ms | 256ms | 1s | 4s | 16s | gt | max |
|---|---|---|---|---|---|---|---|---|---|---|---|
| fbmy8028_rel_o2.cy9c_gcp_c2s60 | 0.067 | 3.468 | 96.412 | 0.041 | 0.011 | 0.001 | 0.301 | ||||
| fbmy8028_rel.cy9c_gcp_c2s60 | 0.041 | 4.128 | 95.775 | 0.044 | 0.010 | 0.002 | 0.429 | ||||
| fbmy8028_rel_native.cy9c_gcp_c2s60 | 0.044 | 3.564 | 96.334 | 0.048 | 0.010 | 0.001 | 0.307 | ||||
| fbmy8028_rel_lto.cy9c_gcp_c2s60 | 0.048 | 4.340 | 95.556 | 0.041 | 0.014 | 0.001 | 0.292 | ||||
| fbmy8028_rel_native_lto.cy9c_gcp_c2s60 | 0.040 | 5.057 | 94.846 | 0.039 | 0.017 | 0.001 | 0.467 |
Performance metrics for the DBMS listed above. Some are normalized by throughput, others are not. Legend for results is here.
ips	qps	rps	rmbps	wps	wmbps	rpq	rkbpq	wpi	wkbpi	csps	cpups	cspq	cpupq	dbgb1	dbgb2	rss	maxop	p50	p99	tag
150263	0	11	2.4	480.4	115.9	0.000	0.016	0.003	0.790	151277	32.8	1.007	65	53.5	54.7	41.1	0.301	7542	6093	400m.fbmy8028_rel_o2.cy9c_gcp_c2s60
155400	0	12	2.4	489.5	118.0	0.000	0.016	0.003	0.777	153808	33.6	0.990	65	54.8	56.0	40.3	0.429	7742	6343	400m.fbmy8028_rel.cy9c_gcp_c2s60
151400	0	11	2.4	475.7	113.8	0.000	0.016	0.003	0.770	154807	33.4	1.022	66	54.7	55.9	40.6	0.307	7592	6196	400m.fbmy8028_rel_native.cy9c_gcp_c2s60
155159	0	11	2.5	488.4	118.8	0.000	0.016	0.003	0.784	153977	32.8	0.992	63	54.9	56.2	40.9	0.292	7744	6243	400m.fbmy8028_rel_lto.cy9c_gcp_c2s60
159744	0	12	2.5	502.3	122.6	0.000	0.016	0.003	0.786	159975	33.8	1.001	63	54.2	55.4	40.7	0.467	7991	6493	400m.fbmy8028_rel_native_lto.cy9c_gcp_c2s60
q100.1
q100.1: range queries with 100 insert/s per client. Graphs for performance per 1-second interval are here.
Average throughput:

Query response time histogram: each cell has the percentage of responses that take <= the time in the header and max is the max response time in seconds. For max values in the top 25% of the range have a red background and in the bottom 25% of the range have a green background. The red background is not used when the min value is within 80% of the max value.
| dbms | 256us | 1ms | 4ms | 16ms | 64ms | 256ms | 1s | 4s | 16s | gt | max |
|---|---|---|---|---|---|---|---|---|---|---|---|
| fbmy8028_rel_o2.cy9c_gcp_c2s60 | 62.370 | 37.625 | 0.005 | nonzero | nonzero | 0.032 | |||||
| fbmy8028_rel.cy9c_gcp_c2s60 | 81.371 | 18.626 | 0.003 | nonzero | nonzero | 0.017 | |||||
| fbmy8028_rel_native.cy9c_gcp_c2s60 | 81.652 | 18.345 | 0.003 | nonzero | nonzero | 0.024 | |||||
| fbmy8028_rel_lto.cy9c_gcp_c2s60 | 80.994 | 19.003 | 0.003 | nonzero | nonzero | 0.016 | |||||
| fbmy8028_rel_native_lto.cy9c_gcp_c2s60 | 81.163 | 18.834 | 0.003 | nonzero | nonzero | 0.030 |
Insert response time histogram: each cell has the percentage of responses that take <= the time in the header and max is the max response time in seconds. For max values in the top 25% of the range have a red background and in the bottom 25% of the range have a green background. The red background is not used when the min value is within 80% of the max value.
| dbms | 256us | 1ms | 4ms | 16ms | 64ms | 256ms | 1s | 4s | 16s | gt | max |
|---|---|---|---|---|---|---|---|---|---|---|---|
| fbmy8028_rel_o2.cy9c_gcp_c2s60 | 0.001 | 94.219 | 5.779 | 0.015 | |||||||
| fbmy8028_rel.cy9c_gcp_c2s60 | 0.001 | 98.831 | 1.168 | 0.013 | |||||||
| fbmy8028_rel_native.cy9c_gcp_c2s60 | 0.001 | 97.644 | 2.354 | 0.013 | |||||||
| fbmy8028_rel_lto.cy9c_gcp_c2s60 | 0.011 | 96.164 | 3.825 | 0.015 | |||||||
| fbmy8028_rel_native_lto.cy9c_gcp_c2s60 | 0.006 | 99.318 | 0.676 | 0.015 |
Performance metrics for the DBMS listed above. Some are normalized by throughput, others are not. Legend for results is here.
ips	qps	rps	rmbps	wps	wmbps	rpq	rkbpq	wpi	wkbpi	csps	cpups	cspq	cpupq	dbgb1	dbgb2	rss	maxop	p50	p99	tag
1976	75507	0	0.0	20.4	3.3	0.000	0.000	0.010	1.724	301802	66.1	3.997	263	52.4	54.1	48.5	0.032	3804	3404	400m.fbmy8028_rel_o2.cy9c_gcp_c2s60
1976	82791	0	0.0	19.7	3.3	0.000	0.000	0.010	1.718	331923	65.8	4.009	238	52.4	54.0	47.1	0.017	4141	3852	400m.fbmy8028_rel.cy9c_gcp_c2s60
1976	82781	0	0.0	21.0	3.4	0.000	0.000	0.011	1.779	329770	65.9	3.984	239	52.4	54.0	48.1	0.024	4203	3852	400m.fbmy8028_rel_native.cy9c_gcp_c2s60
1976	82496	0	0.0	20.1	3.4	0.000	0.000	0.010	1.753	332143	65.8	4.026	239	52.4	54.0	48.1	0.016	4171	3740	400m.fbmy8028_rel_lto.cy9c_gcp_c2s60
1977	82689	0	0.0	18.7	2.9	0.000	0.000	0.009	1.520	328376	65.8	3.971	239	52.4	54.0	48.0	0.030	4140	3740	400m.fbmy8028_rel_native_lto.cy9c_gcp_c2s60
q500.1
q500.1: range queries with 500 insert/s per client. Graphs for performance per 1-second interval are here.
Average throughput:
Query response time histogram: each cell has the percentage of responses that take <= the time in the header and max is the max response time in seconds. For max values in the top 25% of the range have a red background and in the bottom 25% of the range have a green background. The red background is not used when the min value is within 80% of the max value.
| dbms | 256us | 1ms | 4ms | 16ms | 64ms | 256ms | 1s | 4s | 16s | gt | max |
|---|---|---|---|---|---|---|---|---|---|---|---|
| fbmy8028_rel_o2.cy9c_gcp_c2s60 | 56.670 | 43.299 | 0.029 | 0.001 | 0.001 | 0.030 | |||||
| fbmy8028_rel.cy9c_gcp_c2s60 | 75.660 | 24.315 | 0.024 | 0.001 | nonzero | 0.028 | |||||
| fbmy8028_rel_native.cy9c_gcp_c2s60 | 74.188 | 25.786 | 0.024 | 0.001 | nonzero | 0.030 | |||||
| fbmy8028_rel_lto.cy9c_gcp_c2s60 | 76.130 | 23.845 | 0.023 | 0.001 | 0.001 | 0.027 | |||||
| fbmy8028_rel_native_lto.cy9c_gcp_c2s60 | 74.921 | 25.054 | 0.023 | 0.001 | nonzero | 0.036 |
Insert response time histogram: each cell has the percentage of responses that take <= the time in the header and max is the max response time in seconds. For max values in the top 25% of the range have a red background and in the bottom 25% of the range have a green background. The red background is not used when the min value is within 80% of the max value.
| dbms | 256us | 1ms | 4ms | 16ms | 64ms | 256ms | 1s | 4s | 16s | gt | max |
|---|---|---|---|---|---|---|---|---|---|---|---|
| fbmy8028_rel_o2.cy9c_gcp_c2s60 | 16.273 | 83.315 | 0.413 | 0.036 | |||||||
| fbmy8028_rel.cy9c_gcp_c2s60 | 15.631 | 83.992 | 0.378 | 0.030 | |||||||
| fbmy8028_rel_native.cy9c_gcp_c2s60 | 16.284 | 83.311 | 0.405 | 0.036 | |||||||
| fbmy8028_rel_lto.cy9c_gcp_c2s60 | 17.822 | 81.854 | 0.324 | 0.025 | |||||||
| fbmy8028_rel_native_lto.cy9c_gcp_c2s60 | 0.001 | 16.924 | 82.713 | 0.363 | 0.051 |
Performance metrics for the DBMS listed above. Some are normalized by throughput, others are not. Legend for results is here.
ips	qps	rps	rmbps	wps	wmbps	rpq	rkbpq	wpi	wkbpi	csps	cpups	cspq	cpupq	dbgb1	dbgb2	rss	maxop	p50	p99	tag
9885	73978	0	0.0	44.1	9.6	0.000	0.000	0.004	0.992	292704	67.3	3.957	273	53.5	55.5	60.0	0.030	3726	3389	400m.fbmy8028_rel_o2.cy9c_gcp_c2s60
9885	80602	0	0.0	42.3	10.3	0.000	0.000	0.004	1.067	320898	67.1	3.981	250	53.7	55.7	58.8	0.028	4060	3694	400m.fbmy8028_rel.cy9c_gcp_c2s60
9885	79972	0	0.0	42.4	10.3	0.000	0.000	0.004	1.070	319308	67.1	3.993	252	53.6	55.5	59.3	0.030	4043	3676	400m.fbmy8028_rel_native.cy9c_gcp_c2s60
9885	80900	0	0.0	43.0	10.1	0.000	0.000	0.004	1.042	320964	67.1	3.967	249	53.5	55.5	59.3	0.027	4075	3692	400m.fbmy8028_rel_lto.cy9c_gcp_c2s60
9885	80367	0	0.0	45.2	10.4	0.000	0.000	0.005	1.079	316969	67.1	3.944	250	53.7	55.6	60.5	0.036	4076	3660	400m.fbmy8028_rel_native_lto.cy9c_gcp_c2s60
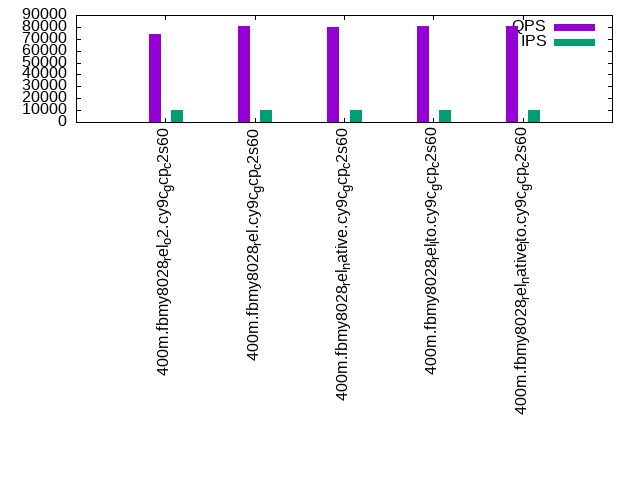
q1000.1
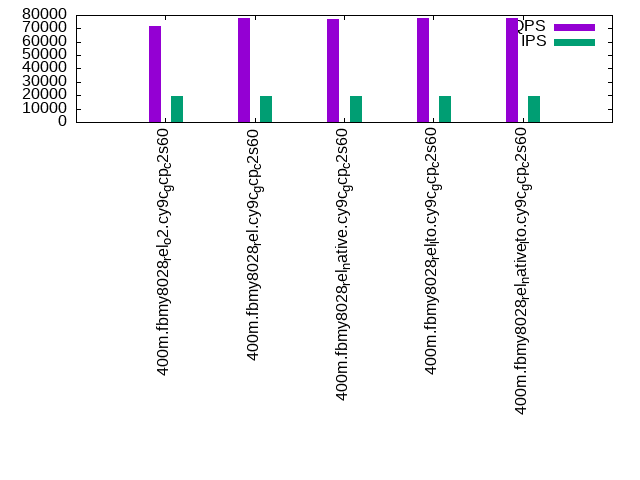
q1000.1: range queries with 1000 insert/s per client. Graphs for performance per 1-second interval are here.
Average throughput:
Query response time histogram: each cell has the percentage of responses that take <= the time in the header and max is the max response time in seconds. For max values in the top 25% of the range have a red background and in the bottom 25% of the range have a green background. The red background is not used when the min value is within 80% of the max value.
| dbms | 256us | 1ms | 4ms | 16ms | 64ms | 256ms | 1s | 4s | 16s | gt | max |
|---|---|---|---|---|---|---|---|---|---|---|---|
| fbmy8028_rel_o2.cy9c_gcp_c2s60 | 47.939 | 52.011 | 0.048 | 0.001 | nonzero | 0.031 | |||||
| fbmy8028_rel.cy9c_gcp_c2s60 | 65.224 | 34.735 | 0.039 | 0.001 | nonzero | 0.036 | |||||
| fbmy8028_rel_native.cy9c_gcp_c2s60 | 64.711 | 35.248 | 0.040 | 0.001 | nonzero | 0.031 | |||||
| fbmy8028_rel_lto.cy9c_gcp_c2s60 | 67.048 | 32.913 | 0.038 | 0.001 | nonzero | 0.025 | |||||
| fbmy8028_rel_native_lto.cy9c_gcp_c2s60 | 66.815 | 33.146 | 0.038 | 0.001 | nonzero | 0.024 |
Insert response time histogram: each cell has the percentage of responses that take <= the time in the header and max is the max response time in seconds. For max values in the top 25% of the range have a red background and in the bottom 25% of the range have a green background. The red background is not used when the min value is within 80% of the max value.
| dbms | 256us | 1ms | 4ms | 16ms | 64ms | 256ms | 1s | 4s | 16s | gt | max |
|---|---|---|---|---|---|---|---|---|---|---|---|
| fbmy8028_rel_o2.cy9c_gcp_c2s60 | 24.761 | 74.751 | 0.487 | 0.042 | |||||||
| fbmy8028_rel.cy9c_gcp_c2s60 | 0.001 | 26.538 | 72.973 | 0.488 | 0.036 | ||||||
| fbmy8028_rel_native.cy9c_gcp_c2s60 | nonzero | 24.080 | 75.405 | 0.515 | 0.039 | ||||||
| fbmy8028_rel_lto.cy9c_gcp_c2s60 | 0.003 | 26.307 | 73.272 | 0.418 | 0.033 | ||||||
| fbmy8028_rel_native_lto.cy9c_gcp_c2s60 | 0.002 | 25.507 | 74.093 | 0.398 | 0.053 |
Performance metrics for the DBMS listed above. Some are normalized by throughput, others are not. Legend for results is here.
ips	qps	rps	rmbps	wps	wmbps	rpq	rkbpq	wpi	wkbpi	csps	cpups	cspq	cpupq	dbgb1	dbgb2	rss	maxop	p50	p99	tag
19769	71777	0	0.0	76.7	23.5	0.000	0.000	0.004	1.216	280888	69.1	3.913	289	56.0	56.5	82.0	0.031	3660	3342	400m.fbmy8028_rel_o2.cy9c_gcp_c2s60
19769	77390	0	0.0	77.8	24.0	0.000	0.000	0.004	1.246	305893	68.9	3.953	267	55.9	56.5	81.5	0.036	3917	3612	400m.fbmy8028_rel.cy9c_gcp_c2s60
19769	77290	0	0.0	80.1	23.4	0.000	0.000	0.004	1.210	305978	69.1	3.959	268	56.3	56.8	82.1	0.031	3935	3612	400m.fbmy8028_rel_native.cy9c_gcp_c2s60
19769	77982	0	0.0	76.7	23.2	0.000	0.000	0.004	1.202	308235	68.8	3.953	265	56.0	56.5	81.2	0.025	3996	3644	400m.fbmy8028_rel_lto.cy9c_gcp_c2s60
19769	77959	0	0.0	78.1	23.9	0.000	0.000	0.004	1.237	306153	68.8	3.927	265	55.9	56.4	82.8	0.024	3932	3596	400m.fbmy8028_rel_native_lto.cy9c_gcp_c2s60
l.i0
l.i0: load without secondary indexes
Performance metrics for all DBMS, not just the ones listed above. Some are normalized by throughput, others are not. Legend for results is here.
ips	qps	rps	rmbps	wps	wmbps	rpq	rkbpq	wpi	wkbpi	csps	cpups	cspq	cpupq	dbgb1	dbgb2	rss	maxop	p50	p99	tag
702988	0	0	0.0	442.4	102.1	0.000	0.000	0.001	0.149	129259	44.8	0.184	19	12.6	13.1	1.7	0.250	36959	28669	400m.fbmy8028_rel_o2.cy9c_gcp_c2s60
710480	0	0	0.0	442.1	102.2	0.000	0.000	0.001	0.147	130945	44.6	0.184	19	12.5	13.0	1.7	0.253	37077	28769	400m.fbmy8028_rel.cy9c_gcp_c2s60
713012	0	0	0.0	442.8	104.2	0.000	0.000	0.001	0.150	131557	43.9	0.185	18	12.6	13.1	1.7	0.244	37359	28868	400m.fbmy8028_rel_native.cy9c_gcp_c2s60
727273	0	0	0.0	451.2	105.1	0.000	0.000	0.001	0.148	134990	43.9	0.186	18	12.6	13.1	1.7	0.250	38058	29268	400m.fbmy8028_rel_lto.cy9c_gcp_c2s60
731261	0	0	0.0	455.8	106.5	0.000	0.000	0.001	0.149	134628	44.8	0.184	18	12.5	13.0	1.7	0.239	38173	29467	400m.fbmy8028_rel_native_lto.cy9c_gcp_c2s60
l.x
l.x: create secondary indexes
Performance metrics for all DBMS, not just the ones listed above. Some are normalized by throughput, others are not. Legend for results is here.
ips	qps	rps	rmbps	wps	wmbps	rpq	rkbpq	wpi	wkbpi	csps	cpups	cspq	cpupq	dbgb1	dbgb2	rss	maxop	p50	p99	tag
93876	0	0	0.0	33.3	11.1	0.000	0.000	0.000	0.121	669	2.9	0.007	9	25.3	25.8	26.3	0.002	NA	NA	400m.fbmy8028_rel_o2.cy9c_gcp_c2s60
110923	0	0	0.0	39.6	13.3	0.000	0.000	0.000	0.123	723	2.9	0.007	8	25.3	25.9	26.0	0.002	NA	NA	400m.fbmy8028_rel.cy9c_gcp_c2s60
111232	0	0	0.0	40.0	13.5	0.000	0.000	0.000	0.125	729	2.9	0.007	8	25.3	25.8	26.2	0.002	NA	NA	400m.fbmy8028_rel_native.cy9c_gcp_c2s60
113826	0	0	0.0	40.5	13.8	0.000	0.000	0.000	0.124	730	2.9	0.006	8	25.3	25.8	26.3	0.002	NA	NA	400m.fbmy8028_rel_lto.cy9c_gcp_c2s60
115236	0	0	0.0	40.9	14.0	0.000	0.000	0.000	0.124	754	2.9	0.007	8	25.3	25.8	26.0	0.002	NA	NA	400m.fbmy8028_rel_native_lto.cy9c_gcp_c2s60
l.i1
l.i1: continue load after secondary indexes created
Performance metrics for all DBMS, not just the ones listed above. Some are normalized by throughput, others are not. Legend for results is here.
ips	qps	rps	rmbps	wps	wmbps	rpq	rkbpq	wpi	wkbpi	csps	cpups	cspq	cpupq	dbgb1	dbgb2	rss	maxop	p50	p99	tag
150263	0	11	2.4	480.4	115.9	0.000	0.016	0.003	0.790	151277	32.8	1.007	65	53.5	54.7	41.1	0.301	7542	6093	400m.fbmy8028_rel_o2.cy9c_gcp_c2s60
155400	0	12	2.4	489.5	118.0	0.000	0.016	0.003	0.777	153808	33.6	0.990	65	54.8	56.0	40.3	0.429	7742	6343	400m.fbmy8028_rel.cy9c_gcp_c2s60
151400	0	11	2.4	475.7	113.8	0.000	0.016	0.003	0.770	154807	33.4	1.022	66	54.7	55.9	40.6	0.307	7592	6196	400m.fbmy8028_rel_native.cy9c_gcp_c2s60
155159	0	11	2.5	488.4	118.8	0.000	0.016	0.003	0.784	153977	32.8	0.992	63	54.9	56.2	40.9	0.292	7744	6243	400m.fbmy8028_rel_lto.cy9c_gcp_c2s60
159744	0	12	2.5	502.3	122.6	0.000	0.016	0.003	0.786	159975	33.8	1.001	63	54.2	55.4	40.7	0.467	7991	6493	400m.fbmy8028_rel_native_lto.cy9c_gcp_c2s60
q100.1
q100.1: range queries with 100 insert/s per client
Performance metrics for all DBMS, not just the ones listed above. Some are normalized by throughput, others are not. Legend for results is here.
ips	qps	rps	rmbps	wps	wmbps	rpq	rkbpq	wpi	wkbpi	csps	cpups	cspq	cpupq	dbgb1	dbgb2	rss	maxop	p50	p99	tag
1976	75507	0	0.0	20.4	3.3	0.000	0.000	0.010	1.724	301802	66.1	3.997	263	52.4	54.1	48.5	0.032	3804	3404	400m.fbmy8028_rel_o2.cy9c_gcp_c2s60
1976	82791	0	0.0	19.7	3.3	0.000	0.000	0.010	1.718	331923	65.8	4.009	238	52.4	54.0	47.1	0.017	4141	3852	400m.fbmy8028_rel.cy9c_gcp_c2s60
1976	82781	0	0.0	21.0	3.4	0.000	0.000	0.011	1.779	329770	65.9	3.984	239	52.4	54.0	48.1	0.024	4203	3852	400m.fbmy8028_rel_native.cy9c_gcp_c2s60
1976	82496	0	0.0	20.1	3.4	0.000	0.000	0.010	1.753	332143	65.8	4.026	239	52.4	54.0	48.1	0.016	4171	3740	400m.fbmy8028_rel_lto.cy9c_gcp_c2s60
1977	82689	0	0.0	18.7	2.9	0.000	0.000	0.009	1.520	328376	65.8	3.971	239	52.4	54.0	48.0	0.030	4140	3740	400m.fbmy8028_rel_native_lto.cy9c_gcp_c2s60
q500.1
q500.1: range queries with 500 insert/s per client
Performance metrics for all DBMS, not just the ones listed above. Some are normalized by throughput, others are not. Legend for results is here.
ips	qps	rps	rmbps	wps	wmbps	rpq	rkbpq	wpi	wkbpi	csps	cpups	cspq	cpupq	dbgb1	dbgb2	rss	maxop	p50	p99	tag
9885	73978	0	0.0	44.1	9.6	0.000	0.000	0.004	0.992	292704	67.3	3.957	273	53.5	55.5	60.0	0.030	3726	3389	400m.fbmy8028_rel_o2.cy9c_gcp_c2s60
9885	80602	0	0.0	42.3	10.3	0.000	0.000	0.004	1.067	320898	67.1	3.981	250	53.7	55.7	58.8	0.028	4060	3694	400m.fbmy8028_rel.cy9c_gcp_c2s60
9885	79972	0	0.0	42.4	10.3	0.000	0.000	0.004	1.070	319308	67.1	3.993	252	53.6	55.5	59.3	0.030	4043	3676	400m.fbmy8028_rel_native.cy9c_gcp_c2s60
9885	80900	0	0.0	43.0	10.1	0.000	0.000	0.004	1.042	320964	67.1	3.967	249	53.5	55.5	59.3	0.027	4075	3692	400m.fbmy8028_rel_lto.cy9c_gcp_c2s60
9885	80367	0	0.0	45.2	10.4	0.000	0.000	0.005	1.079	316969	67.1	3.944	250	53.7	55.6	60.5	0.036	4076	3660	400m.fbmy8028_rel_native_lto.cy9c_gcp_c2s60
q1000.1
q1000.1: range queries with 1000 insert/s per client
Performance metrics for all DBMS, not just the ones listed above. Some are normalized by throughput, others are not. Legend for results is here.
ips	qps	rps	rmbps	wps	wmbps	rpq	rkbpq	wpi	wkbpi	csps	cpups	cspq	cpupq	dbgb1	dbgb2	rss	maxop	p50	p99	tag
19769	71777	0	0.0	76.7	23.5	0.000	0.000	0.004	1.216	280888	69.1	3.913	289	56.0	56.5	82.0	0.031	3660	3342	400m.fbmy8028_rel_o2.cy9c_gcp_c2s60
19769	77390	0	0.0	77.8	24.0	0.000	0.000	0.004	1.246	305893	68.9	3.953	267	55.9	56.5	81.5	0.036	3917	3612	400m.fbmy8028_rel.cy9c_gcp_c2s60
19769	77290	0	0.0	80.1	23.4	0.000	0.000	0.004	1.210	305978	69.1	3.959	268	56.3	56.8	82.1	0.031	3935	3612	400m.fbmy8028_rel_native.cy9c_gcp_c2s60
19769	77982	0	0.0	76.7	23.2	0.000	0.000	0.004	1.202	308235	68.8	3.953	265	56.0	56.5	81.2	0.025	3996	3644	400m.fbmy8028_rel_lto.cy9c_gcp_c2s60
19769	77959	0	0.0	78.1	23.9	0.000	0.000	0.004	1.237	306153	68.8	3.927	265	55.9	56.4	82.8	0.024	3932	3596	400m.fbmy8028_rel_native_lto.cy9c_gcp_c2s60
l.i0
- l.i0: load without secondary indexes
- Legend for results is here.
- Each entry lists the percentage of responses that fit in that bucket (slower than max time for previous bucket, faster than min time for next bucket).
Insert response time histogram
256us	1ms	4ms	16ms	64ms	256ms	1s	4s	16s	gt	max	tag
0.000	0.340	98.528	1.089	0.008	0.036	0.000	0.000	0.000	0.000	0.250	fbmy8028_rel_o2.cy9c_gcp_c2s60
0.000	0.345	98.638	0.974	0.006	0.036	0.000	0.000	0.000	0.000	0.253	fbmy8028_rel.cy9c_gcp_c2s60
0.000	0.454	98.551	0.954	0.005	0.036	0.000	0.000	0.000	0.000	0.244	fbmy8028_rel_native.cy9c_gcp_c2s60
0.000	0.688	98.511	0.760	0.005	0.036	0.000	0.000	0.000	0.000	0.250	fbmy8028_rel_lto.cy9c_gcp_c2s60
0.000	0.525	98.682	0.751	0.007	0.036	0.000	0.000	0.000	0.000	0.239	fbmy8028_rel_native_lto.cy9c_gcp_c2s60
l.x
- l.x: create secondary indexes
- Legend for results is here.
- Each entry lists the percentage of responses that fit in that bucket (slower than max time for previous bucket, faster than min time for next bucket).
TODO - determine whether there is data for create index response time
l.i1
- l.i1: continue load after secondary indexes created
- Legend for results is here.
- Each entry lists the percentage of responses that fit in that bucket (slower than max time for previous bucket, faster than min time for next bucket).
Insert response time histogram
256us	1ms	4ms	16ms	64ms	256ms	1s	4s	16s	gt	max	tag
0.000	0.067	3.468	96.412	0.041	0.011	0.001	0.000	0.000	0.000	0.301	fbmy8028_rel_o2.cy9c_gcp_c2s60
0.000	0.041	4.128	95.775	0.044	0.010	0.002	0.000	0.000	0.000	0.429	fbmy8028_rel.cy9c_gcp_c2s60
0.000	0.044	3.564	96.334	0.048	0.010	0.001	0.000	0.000	0.000	0.307	fbmy8028_rel_native.cy9c_gcp_c2s60
0.000	0.048	4.340	95.556	0.041	0.014	0.001	0.000	0.000	0.000	0.292	fbmy8028_rel_lto.cy9c_gcp_c2s60
0.000	0.040	5.057	94.846	0.039	0.017	0.001	0.000	0.000	0.000	0.467	fbmy8028_rel_native_lto.cy9c_gcp_c2s60
q100.1
- q100.1: range queries with 100 insert/s per client
- Legend for results is here.
- Each entry lists the percentage of responses that fit in that bucket (slower than max time for previous bucket, faster than min time for next bucket).
Query response time histogram
256us	1ms	4ms	16ms	64ms	256ms	1s	4s	16s	gt	max	tag
62.370	37.625	0.005	nonzero	nonzero	0.000	0.000	0.000	0.000	0.000	0.032	fbmy8028_rel_o2.cy9c_gcp_c2s60
81.371	18.626	0.003	nonzero	nonzero	0.000	0.000	0.000	0.000	0.000	0.017	fbmy8028_rel.cy9c_gcp_c2s60
81.652	18.345	0.003	nonzero	nonzero	0.000	0.000	0.000	0.000	0.000	0.024	fbmy8028_rel_native.cy9c_gcp_c2s60
80.994	19.003	0.003	nonzero	nonzero	0.000	0.000	0.000	0.000	0.000	0.016	fbmy8028_rel_lto.cy9c_gcp_c2s60
81.163	18.834	0.003	nonzero	nonzero	0.000	0.000	0.000	0.000	0.000	0.030	fbmy8028_rel_native_lto.cy9c_gcp_c2s60
Insert response time histogram
256us	1ms	4ms	16ms	64ms	256ms	1s	4s	16s	gt	max	tag
0.000	0.001	94.219	5.779	0.000	0.000	0.000	0.000	0.000	0.000	0.015	fbmy8028_rel_o2.cy9c_gcp_c2s60
0.000	0.001	98.831	1.168	0.000	0.000	0.000	0.000	0.000	0.000	0.013	fbmy8028_rel.cy9c_gcp_c2s60
0.000	0.001	97.644	2.354	0.000	0.000	0.000	0.000	0.000	0.000	0.013	fbmy8028_rel_native.cy9c_gcp_c2s60
0.000	0.011	96.164	3.825	0.000	0.000	0.000	0.000	0.000	0.000	0.015	fbmy8028_rel_lto.cy9c_gcp_c2s60
0.000	0.006	99.318	0.676	0.000	0.000	0.000	0.000	0.000	0.000	0.015	fbmy8028_rel_native_lto.cy9c_gcp_c2s60
q500.1
- q500.1: range queries with 500 insert/s per client
- Legend for results is here.
- Each entry lists the percentage of responses that fit in that bucket (slower than max time for previous bucket, faster than min time for next bucket).
Query response time histogram
256us	1ms	4ms	16ms	64ms	256ms	1s	4s	16s	gt	max	tag
56.670	43.299	0.029	0.001	0.001	0.000	0.000	0.000	0.000	0.000	0.030	fbmy8028_rel_o2.cy9c_gcp_c2s60
75.660	24.315	0.024	0.001	nonzero	0.000	0.000	0.000	0.000	0.000	0.028	fbmy8028_rel.cy9c_gcp_c2s60
74.188	25.786	0.024	0.001	nonzero	0.000	0.000	0.000	0.000	0.000	0.030	fbmy8028_rel_native.cy9c_gcp_c2s60
76.130	23.845	0.023	0.001	0.001	0.000	0.000	0.000	0.000	0.000	0.027	fbmy8028_rel_lto.cy9c_gcp_c2s60
74.921	25.054	0.023	0.001	nonzero	0.000	0.000	0.000	0.000	0.000	0.036	fbmy8028_rel_native_lto.cy9c_gcp_c2s60
Insert response time histogram
256us	1ms	4ms	16ms	64ms	256ms	1s	4s	16s	gt	max	tag
0.000	0.000	16.273	83.315	0.413	0.000	0.000	0.000	0.000	0.000	0.036	fbmy8028_rel_o2.cy9c_gcp_c2s60
0.000	0.000	15.631	83.992	0.378	0.000	0.000	0.000	0.000	0.000	0.030	fbmy8028_rel.cy9c_gcp_c2s60
0.000	0.000	16.284	83.311	0.405	0.000	0.000	0.000	0.000	0.000	0.036	fbmy8028_rel_native.cy9c_gcp_c2s60
0.000	0.000	17.822	81.854	0.324	0.000	0.000	0.000	0.000	0.000	0.025	fbmy8028_rel_lto.cy9c_gcp_c2s60
0.000	0.001	16.924	82.713	0.363	0.000	0.000	0.000	0.000	0.000	0.051	fbmy8028_rel_native_lto.cy9c_gcp_c2s60
q1000.1
- q1000.1: range queries with 1000 insert/s per client
- Legend for results is here.
- Each entry lists the percentage of responses that fit in that bucket (slower than max time for previous bucket, faster than min time for next bucket).
Query response time histogram
256us	1ms	4ms	16ms	64ms	256ms	1s	4s	16s	gt	max	tag
47.939	52.011	0.048	0.001	nonzero	0.000	0.000	0.000	0.000	0.000	0.031	fbmy8028_rel_o2.cy9c_gcp_c2s60
65.224	34.735	0.039	0.001	nonzero	0.000	0.000	0.000	0.000	0.000	0.036	fbmy8028_rel.cy9c_gcp_c2s60
64.711	35.248	0.040	0.001	nonzero	0.000	0.000	0.000	0.000	0.000	0.031	fbmy8028_rel_native.cy9c_gcp_c2s60
67.048	32.913	0.038	0.001	nonzero	0.000	0.000	0.000	0.000	0.000	0.025	fbmy8028_rel_lto.cy9c_gcp_c2s60
66.815	33.146	0.038	0.001	nonzero	0.000	0.000	0.000	0.000	0.000	0.024	fbmy8028_rel_native_lto.cy9c_gcp_c2s60
Insert response time histogram
256us	1ms	4ms	16ms	64ms	256ms	1s	4s	16s	gt	max	tag
0.000	0.000	24.761	74.751	0.487	0.000	0.000	0.000	0.000	0.000	0.042	fbmy8028_rel_o2.cy9c_gcp_c2s60
0.000	0.001	26.538	72.973	0.488	0.000	0.000	0.000	0.000	0.000	0.036	fbmy8028_rel.cy9c_gcp_c2s60
0.000	nonzero	24.080	75.405	0.515	0.000	0.000	0.000	0.000	0.000	0.039	fbmy8028_rel_native.cy9c_gcp_c2s60
0.000	0.003	26.307	73.272	0.418	0.000	0.000	0.000	0.000	0.000	0.033	fbmy8028_rel_lto.cy9c_gcp_c2s60
0.000	0.002	25.507	74.093	0.398	0.000	0.000	0.000	0.000	0.000	0.053	fbmy8028_rel_native_lto.cy9c_gcp_c2s60