Introduction
This is a report for the insert benchmark with 400M docs and 20 client(s). It is generated by scripts (bash, awk, sed) and Tufte might not be impressed. An overview of the insert benchmark is here and a short update is here. Below, by DBMS, I mean DBMS+version.config. An example is my8020.c10b40 where my means MySQL, 8020 is version 8.0.20 and c10b40 is the name for the configuration file.
The test server is c2-standard-60 from GCP with 30 cores, hyperthreading disabled, 240G RAM and 3T of NVMe storage. The benchmark was run with 20 clients and there were 1 or 2 connections per client (1 for queries, 1 for inserts). The benchmark loads 400M rows without secondary indexes, creates secondary indexes, loads another 400M rows then does 3 read+write tests for 1800 seconds each that do queries as fast as possible with 100, 500 and then 1000 writes/second/client concurrent with the queries. All clients shared one table. The database is cached by the storage engine and the only IO is for writes. Clients and the DBMS share one server. The per-database configs are in the per-database subdirectories here.
The tested DBMS are:
- fbmy5635_rel.cy9c_gcp_c2s60 - MyRocks 5.6.35, the cy9c_gcp_c2s60 config and compiled with CMAKE_BUILD_TYPE=Release and -O3
- fbmy8028_rel_lto.cy9c_gcp_c2s60 - MyRocks 8.0.28, the cy9c_gcp_c2s60 config and compiled with CMAKE_BUILD_TYPE=Release and -O3 -flto
Contents
- Summary
- l.i0: load without secondary indexes
- l.x: create secondary indexes
- l.i1: continue load after secondary indexes created
- q100.1: range queries with 100 insert/s per client
- q500.1: range queries with 500 insert/s per client
- q1000.1: range queries with 1000 insert/s per client
Summary
The numbers are inserts/s for l.i0 and l.i1, indexed docs (or rows) /s for l.x and queries/s for q*.2. The values are the average rate over the entire test for inserts (IPS) and queries (QPS). The range of values for IPS and QPS is split into 3 parts: bottom 25%, middle 50%, top 25%. Values in the bottom 25% have a red background, values in the top 25% have a green background and values in the middle have no color. A gray background is used for values that can be ignored because the DBMS did not sustain the target insert rate. Red backgrounds are not used when the minimum value is within 80% of the max value.
| dbms | l.i0 | l.x | l.i1 | q100.1 | q500.1 | q1000.1 |
|---|---|---|---|---|---|---|
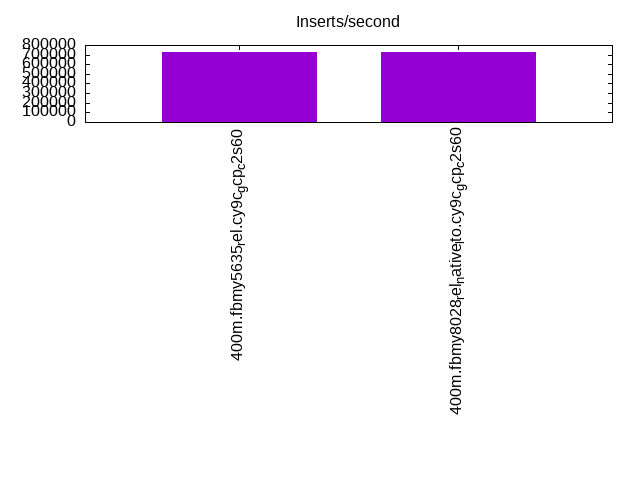
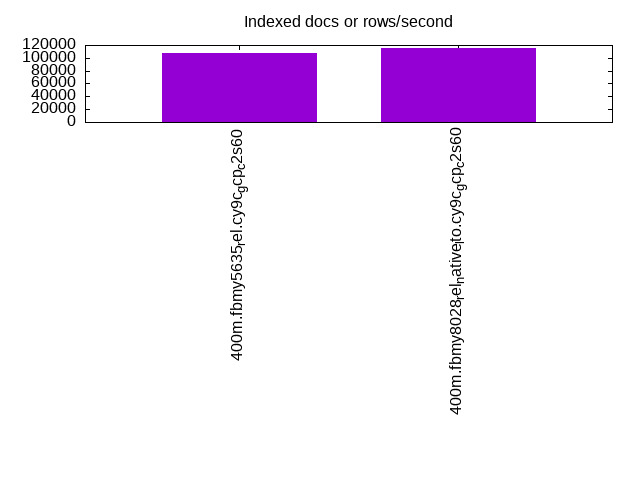
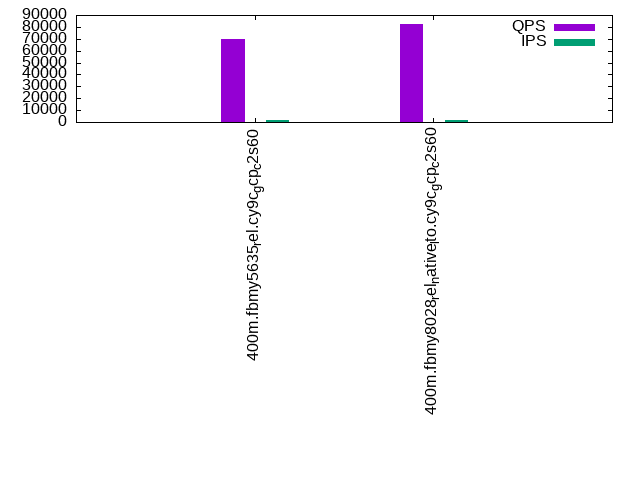
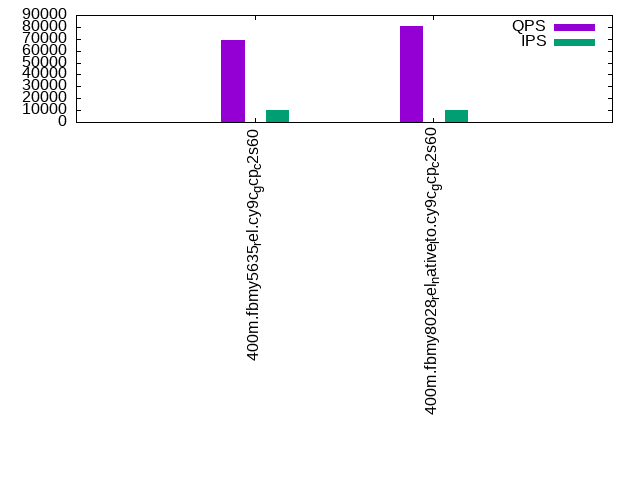
| 400m.fbmy5635_rel.cy9c_gcp_c2s60 | 724638 | 107554 | 151458 | 70189 | 68893 | 66416 |
| 400m.fbmy8028_rel_native_lto.cy9c_gcp_c2s60 | 731261 | 115236 | 159744 | 82689 | 80367 | 77959 |
This table has relative throughput, throughput for the DBMS relative to the DBMS in the first line, using the absolute throughput from the previous table.
| dbms | l.i0 | l.x | l.i1 | q100.1 | q500.1 | q1000.1 |
|---|---|---|---|---|---|---|
| 400m.fbmy5635_rel.cy9c_gcp_c2s60 | 1.00 | 1.00 | 1.00 | 1.00 | 1.00 | 1.00 |
| 400m.fbmy8028_rel_native_lto.cy9c_gcp_c2s60 | 1.01 | 1.07 | 1.05 | 1.18 | 1.17 | 1.17 |
This lists the average rate of inserts/s for the tests that do inserts concurrent with queries. For such tests the query rate is listed in the table above. The read+write tests are setup so that the insert rate should match the target rate every second. Cells that are not at least 95% of the target have a red background to indicate a failure to satisfy the target.
| dbms | q100.1 | q500.1 | q1000.1 |
|---|---|---|---|
| fbmy5635_rel.cy9c_gcp_c2s60 | 1976 | 9885 | 19769 |
| fbmy8028_rel_native_lto.cy9c_gcp_c2s60 | 1977 | 9885 | 19769 |
| target | 2000 | 10000 | 20000 |
l.i0
l.i0: load without secondary indexes. Graphs for performance per 1-second interval are here.
Average throughput:
Insert response time histogram: each cell has the percentage of responses that take <= the time in the header and max is the max response time in seconds. For the max column values in the top 25% of the range have a red background and in the bottom 25% of the range have a green background. The red background is not used when the min value is within 80% of the max value.
| dbms | 256us | 1ms | 4ms | 16ms | 64ms | 256ms | 1s | 4s | 16s | gt | max |
|---|---|---|---|---|---|---|---|---|---|---|---|
| fbmy5635_rel.cy9c_gcp_c2s60 | 1.594 | 98.265 | 0.105 | 0.001 | 0.034 | 0.002 | 0.309 | ||||
| fbmy8028_rel_native_lto.cy9c_gcp_c2s60 | 0.525 | 98.682 | 0.751 | 0.007 | 0.036 | 0.239 |
Performance metrics for the DBMS listed above. Some are normalized by throughput, others are not. Legend for results is here.
ips	qps	rps	rmbps	wps	wmbps	rpq	rkbpq	wpi	wkbpi	csps	cpups	cspq	cpupq	dbgb1	dbgb2	rss	maxop	p50	p99	tag
724638	0	0	0.0	549.8	144.6	0.000	0.000	0.001	0.204	136598	39.0	0.189	16	12.6	12.9	NA	0.309	37958	28580	400m.fbmy5635_rel.cy9c_gcp_c2s60
731261	0	0	0.0	455.8	106.5	0.000	0.000	0.001	0.149	134628	44.8	0.184	18	12.5	13.0	1.7	0.239	38173	29467	400m.fbmy8028_rel_native_lto.cy9c_gcp_c2s60
l.x
l.x: create secondary indexes.
Average throughput:
Performance metrics for the DBMS listed above. Some are normalized by throughput, others are not. Legend for results is here.
ips	qps	rps	rmbps	wps	wmbps	rpq	rkbpq	wpi	wkbpi	csps	cpups	cspq	cpupq	dbgb1	dbgb2	rss	maxop	p50	p99	tag
107554	0	0	0.0	50.9	11.7	0.000	0.000	0.000	0.111	575	2.9	0.005	8	25.3	25.7	NA	0.001	NA	NA	400m.fbmy5635_rel.cy9c_gcp_c2s60
115236	0	0	0.0	40.9	14.0	0.000	0.000	0.000	0.124	754	2.9	0.007	8	25.3	25.8	26.0	0.002	NA	NA	400m.fbmy8028_rel_native_lto.cy9c_gcp_c2s60
l.i1
l.i1: continue load after secondary indexes created. Graphs for performance per 1-second interval are here.
Average throughput:

Insert response time histogram: each cell has the percentage of responses that take <= the time in the header and max is the max response time in seconds. For the max column values in the top 25% of the range have a red background and in the bottom 25% of the range have a green background. The red background is not used when the min value is within 80% of the max value.
| dbms | 256us | 1ms | 4ms | 16ms | 64ms | 256ms | 1s | 4s | 16s | gt | max |
|---|---|---|---|---|---|---|---|---|---|---|---|
| fbmy5635_rel.cy9c_gcp_c2s60 | 0.066 | 7.549 | 92.353 | 0.030 | 0.002 | 0.226 | |||||
| fbmy8028_rel_native_lto.cy9c_gcp_c2s60 | 0.040 | 5.057 | 94.846 | 0.039 | 0.017 | 0.001 | 0.467 |
Performance metrics for the DBMS listed above. Some are normalized by throughput, others are not. Legend for results is here.
ips	qps	rps	rmbps	wps	wmbps	rpq	rkbpq	wpi	wkbpi	csps	cpups	cspq	cpupq	dbgb1	dbgb2	rss	maxop	p50	p99	tag
151458	0	15	2.4	611.1	176.4	0.000	0.016	0.004	1.193	140012	29.3	0.924	58	54.5	55.5	NA	0.226	7592	7042	400m.fbmy5635_rel.cy9c_gcp_c2s60
159744	0	12	2.5	502.3	122.6	0.000	0.016	0.003	0.786	159975	33.8	1.001	63	54.2	55.4	40.7	0.467	7991	6493	400m.fbmy8028_rel_native_lto.cy9c_gcp_c2s60
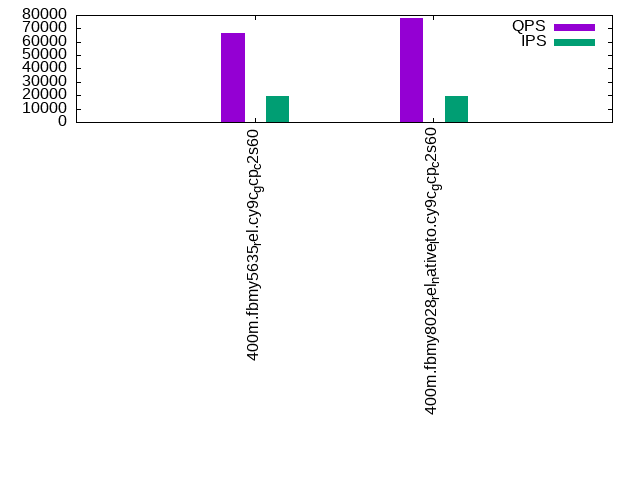
q100.1
q100.1: range queries with 100 insert/s per client. Graphs for performance per 1-second interval are here.
Average throughput:
Query response time histogram: each cell has the percentage of responses that take <= the time in the header and max is the max response time in seconds. For max values in the top 25% of the range have a red background and in the bottom 25% of the range have a green background. The red background is not used when the min value is within 80% of the max value.
| dbms | 256us | 1ms | 4ms | 16ms | 64ms | 256ms | 1s | 4s | 16s | gt | max |
|---|---|---|---|---|---|---|---|---|---|---|---|
| fbmy5635_rel.cy9c_gcp_c2s60 | 26.821 | 73.176 | 0.003 | nonzero | nonzero | 0.037 | |||||
| fbmy8028_rel_native_lto.cy9c_gcp_c2s60 | 81.163 | 18.834 | 0.003 | nonzero | nonzero | 0.030 |
Insert response time histogram: each cell has the percentage of responses that take <= the time in the header and max is the max response time in seconds. For max values in the top 25% of the range have a red background and in the bottom 25% of the range have a green background. The red background is not used when the min value is within 80% of the max value.
| dbms | 256us | 1ms | 4ms | 16ms | 64ms | 256ms | 1s | 4s | 16s | gt | max |
|---|---|---|---|---|---|---|---|---|---|---|---|
| fbmy5635_rel.cy9c_gcp_c2s60 | 0.011 | 95.525 | 4.462 | 0.001 | 0.016 | ||||||
| fbmy8028_rel_native_lto.cy9c_gcp_c2s60 | 0.006 | 99.318 | 0.676 | 0.015 |
Performance metrics for the DBMS listed above. Some are normalized by throughput, others are not. Legend for results is here.
ips	qps	rps	rmbps	wps	wmbps	rpq	rkbpq	wpi	wkbpi	csps	cpups	cspq	cpupq	dbgb1	dbgb2	rss	maxop	p50	p99	tag
1976	70189	0	0.0	18.0	4.8	0.000	0.000	0.009	2.494	294570	64.8	4.197	277	52.4	53.9	NA	0.037	3532	3133	400m.fbmy5635_rel.cy9c_gcp_c2s60
1977	82689	0	0.0	18.7	2.9	0.000	0.000	0.009	1.520	328376	65.8	3.971	239	52.4	54.0	48.0	0.030	4140	3740	400m.fbmy8028_rel_native_lto.cy9c_gcp_c2s60
q500.1
q500.1: range queries with 500 insert/s per client. Graphs for performance per 1-second interval are here.
Average throughput:
Query response time histogram: each cell has the percentage of responses that take <= the time in the header and max is the max response time in seconds. For max values in the top 25% of the range have a red background and in the bottom 25% of the range have a green background. The red background is not used when the min value is within 80% of the max value.
| dbms | 256us | 1ms | 4ms | 16ms | 64ms | 256ms | 1s | 4s | 16s | gt | max |
|---|---|---|---|---|---|---|---|---|---|---|---|
| fbmy5635_rel.cy9c_gcp_c2s60 | 22.815 | 77.155 | 0.028 | 0.001 | 0.001 | 0.039 | |||||
| fbmy8028_rel_native_lto.cy9c_gcp_c2s60 | 74.921 | 25.054 | 0.023 | 0.001 | nonzero | 0.036 |
Insert response time histogram: each cell has the percentage of responses that take <= the time in the header and max is the max response time in seconds. For max values in the top 25% of the range have a red background and in the bottom 25% of the range have a green background. The red background is not used when the min value is within 80% of the max value.
| dbms | 256us | 1ms | 4ms | 16ms | 64ms | 256ms | 1s | 4s | 16s | gt | max |
|---|---|---|---|---|---|---|---|---|---|---|---|
| fbmy5635_rel.cy9c_gcp_c2s60 | 0.006 | 10.419 | 88.820 | 0.755 | 0.031 | ||||||
| fbmy8028_rel_native_lto.cy9c_gcp_c2s60 | 0.001 | 16.924 | 82.713 | 0.363 | 0.051 |
Performance metrics for the DBMS listed above. Some are normalized by throughput, others are not. Legend for results is here.
ips	qps	rps	rmbps	wps	wmbps	rpq	rkbpq	wpi	wkbpi	csps	cpups	cspq	cpupq	dbgb1	dbgb2	rss	maxop	p50	p99	tag
9885	68893	0	0.0	54.0	15.7	0.000	0.000	0.005	1.626	279940	66.2	4.063	288	53.6	55.4	NA	0.039	3484	3180	400m.fbmy5635_rel.cy9c_gcp_c2s60
9885	80367	0	0.0	45.2	10.4	0.000	0.000	0.005	1.079	316969	67.1	3.944	250	53.7	55.6	60.5	0.036	4076	3660	400m.fbmy8028_rel_native_lto.cy9c_gcp_c2s60
q1000.1
q1000.1: range queries with 1000 insert/s per client. Graphs for performance per 1-second interval are here.
Average throughput:
Query response time histogram: each cell has the percentage of responses that take <= the time in the header and max is the max response time in seconds. For max values in the top 25% of the range have a red background and in the bottom 25% of the range have a green background. The red background is not used when the min value is within 80% of the max value.
| dbms | 256us | 1ms | 4ms | 16ms | 64ms | 256ms | 1s | 4s | 16s | gt | max |
|---|---|---|---|---|---|---|---|---|---|---|---|
| fbmy5635_rel.cy9c_gcp_c2s60 | 14.469 | 85.480 | 0.050 | 0.001 | nonzero | 0.046 | |||||
| fbmy8028_rel_native_lto.cy9c_gcp_c2s60 | 66.815 | 33.146 | 0.038 | 0.001 | nonzero | 0.024 |
Insert response time histogram: each cell has the percentage of responses that take <= the time in the header and max is the max response time in seconds. For max values in the top 25% of the range have a red background and in the bottom 25% of the range have a green background. The red background is not used when the min value is within 80% of the max value.
| dbms | 256us | 1ms | 4ms | 16ms | 64ms | 256ms | 1s | 4s | 16s | gt | max |
|---|---|---|---|---|---|---|---|---|---|---|---|
| fbmy5635_rel.cy9c_gcp_c2s60 | 0.010 | 15.862 | 83.479 | 0.649 | 0.036 | ||||||
| fbmy8028_rel_native_lto.cy9c_gcp_c2s60 | 0.002 | 25.507 | 74.093 | 0.398 | 0.053 |
Performance metrics for the DBMS listed above. Some are normalized by throughput, others are not. Legend for results is here.
ips	qps	rps	rmbps	wps	wmbps	rpq	rkbpq	wpi	wkbpi	csps	cpups	cspq	cpupq	dbgb1	dbgb2	rss	maxop	p50	p99	tag
19769	66416	0	0.0	108.2	32.1	0.000	0.000	0.005	1.664	265043	68.2	3.991	308	55.9	56.3	NA	0.046	3372	3084	400m.fbmy5635_rel.cy9c_gcp_c2s60
19769	77959	0	0.0	78.1	23.9	0.000	0.000	0.004	1.237	306153	68.8	3.927	265	55.9	56.4	82.8	0.024	3932	3596	400m.fbmy8028_rel_native_lto.cy9c_gcp_c2s60
l.i0
l.i0: load without secondary indexes
Performance metrics for all DBMS, not just the ones listed above. Some are normalized by throughput, others are not. Legend for results is here.
ips	qps	rps	rmbps	wps	wmbps	rpq	rkbpq	wpi	wkbpi	csps	cpups	cspq	cpupq	dbgb1	dbgb2	rss	maxop	p50	p99	tag
724638	0	0	0.0	549.8	144.6	0.000	0.000	0.001	0.204	136598	39.0	0.189	16	12.6	12.9	NA	0.309	37958	28580	400m.fbmy5635_rel.cy9c_gcp_c2s60
731261	0	0	0.0	455.8	106.5	0.000	0.000	0.001	0.149	134628	44.8	0.184	18	12.5	13.0	1.7	0.239	38173	29467	400m.fbmy8028_rel_native_lto.cy9c_gcp_c2s60
l.x
l.x: create secondary indexes
Performance metrics for all DBMS, not just the ones listed above. Some are normalized by throughput, others are not. Legend for results is here.
ips	qps	rps	rmbps	wps	wmbps	rpq	rkbpq	wpi	wkbpi	csps	cpups	cspq	cpupq	dbgb1	dbgb2	rss	maxop	p50	p99	tag
107554	0	0	0.0	50.9	11.7	0.000	0.000	0.000	0.111	575	2.9	0.005	8	25.3	25.7	NA	0.001	NA	NA	400m.fbmy5635_rel.cy9c_gcp_c2s60
115236	0	0	0.0	40.9	14.0	0.000	0.000	0.000	0.124	754	2.9	0.007	8	25.3	25.8	26.0	0.002	NA	NA	400m.fbmy8028_rel_native_lto.cy9c_gcp_c2s60
l.i1
l.i1: continue load after secondary indexes created
Performance metrics for all DBMS, not just the ones listed above. Some are normalized by throughput, others are not. Legend for results is here.
ips	qps	rps	rmbps	wps	wmbps	rpq	rkbpq	wpi	wkbpi	csps	cpups	cspq	cpupq	dbgb1	dbgb2	rss	maxop	p50	p99	tag
151458	0	15	2.4	611.1	176.4	0.000	0.016	0.004	1.193	140012	29.3	0.924	58	54.5	55.5	NA	0.226	7592	7042	400m.fbmy5635_rel.cy9c_gcp_c2s60
159744	0	12	2.5	502.3	122.6	0.000	0.016	0.003	0.786	159975	33.8	1.001	63	54.2	55.4	40.7	0.467	7991	6493	400m.fbmy8028_rel_native_lto.cy9c_gcp_c2s60
q100.1
q100.1: range queries with 100 insert/s per client
Performance metrics for all DBMS, not just the ones listed above. Some are normalized by throughput, others are not. Legend for results is here.
ips	qps	rps	rmbps	wps	wmbps	rpq	rkbpq	wpi	wkbpi	csps	cpups	cspq	cpupq	dbgb1	dbgb2	rss	maxop	p50	p99	tag
1976	70189	0	0.0	18.0	4.8	0.000	0.000	0.009	2.494	294570	64.8	4.197	277	52.4	53.9	NA	0.037	3532	3133	400m.fbmy5635_rel.cy9c_gcp_c2s60
1977	82689	0	0.0	18.7	2.9	0.000	0.000	0.009	1.520	328376	65.8	3.971	239	52.4	54.0	48.0	0.030	4140	3740	400m.fbmy8028_rel_native_lto.cy9c_gcp_c2s60
q500.1
q500.1: range queries with 500 insert/s per client
Performance metrics for all DBMS, not just the ones listed above. Some are normalized by throughput, others are not. Legend for results is here.
ips	qps	rps	rmbps	wps	wmbps	rpq	rkbpq	wpi	wkbpi	csps	cpups	cspq	cpupq	dbgb1	dbgb2	rss	maxop	p50	p99	tag
9885	68893	0	0.0	54.0	15.7	0.000	0.000	0.005	1.626	279940	66.2	4.063	288	53.6	55.4	NA	0.039	3484	3180	400m.fbmy5635_rel.cy9c_gcp_c2s60
9885	80367	0	0.0	45.2	10.4	0.000	0.000	0.005	1.079	316969	67.1	3.944	250	53.7	55.6	60.5	0.036	4076	3660	400m.fbmy8028_rel_native_lto.cy9c_gcp_c2s60
q1000.1
q1000.1: range queries with 1000 insert/s per client
Performance metrics for all DBMS, not just the ones listed above. Some are normalized by throughput, others are not. Legend for results is here.
ips	qps	rps	rmbps	wps	wmbps	rpq	rkbpq	wpi	wkbpi	csps	cpups	cspq	cpupq	dbgb1	dbgb2	rss	maxop	p50	p99	tag
19769	66416	0	0.0	108.2	32.1	0.000	0.000	0.005	1.664	265043	68.2	3.991	308	55.9	56.3	NA	0.046	3372	3084	400m.fbmy5635_rel.cy9c_gcp_c2s60
19769	77959	0	0.0	78.1	23.9	0.000	0.000	0.004	1.237	306153	68.8	3.927	265	55.9	56.4	82.8	0.024	3932	3596	400m.fbmy8028_rel_native_lto.cy9c_gcp_c2s60
l.i0
- l.i0: load without secondary indexes
- Legend for results is here.
- Each entry lists the percentage of responses that fit in that bucket (slower than max time for previous bucket, faster than min time for next bucket).
Insert response time histogram
256us	1ms	4ms	16ms	64ms	256ms	1s	4s	16s	gt	max	tag
0.000	1.594	98.265	0.105	0.001	0.034	0.002	0.000	0.000	0.000	0.309	fbmy5635_rel.cy9c_gcp_c2s60
0.000	0.525	98.682	0.751	0.007	0.036	0.000	0.000	0.000	0.000	0.239	fbmy8028_rel_native_lto.cy9c_gcp_c2s60
l.x
- l.x: create secondary indexes
- Legend for results is here.
- Each entry lists the percentage of responses that fit in that bucket (slower than max time for previous bucket, faster than min time for next bucket).
TODO - determine whether there is data for create index response time
l.i1
- l.i1: continue load after secondary indexes created
- Legend for results is here.
- Each entry lists the percentage of responses that fit in that bucket (slower than max time for previous bucket, faster than min time for next bucket).
Insert response time histogram
256us	1ms	4ms	16ms	64ms	256ms	1s	4s	16s	gt	max	tag
0.000	0.066	7.549	92.353	0.030	0.002	0.000	0.000	0.000	0.000	0.226	fbmy5635_rel.cy9c_gcp_c2s60
0.000	0.040	5.057	94.846	0.039	0.017	0.001	0.000	0.000	0.000	0.467	fbmy8028_rel_native_lto.cy9c_gcp_c2s60
q100.1
- q100.1: range queries with 100 insert/s per client
- Legend for results is here.
- Each entry lists the percentage of responses that fit in that bucket (slower than max time for previous bucket, faster than min time for next bucket).
Query response time histogram
256us	1ms	4ms	16ms	64ms	256ms	1s	4s	16s	gt	max	tag
26.821	73.176	0.003	nonzero	nonzero	0.000	0.000	0.000	0.000	0.000	0.037	fbmy5635_rel.cy9c_gcp_c2s60
81.163	18.834	0.003	nonzero	nonzero	0.000	0.000	0.000	0.000	0.000	0.030	fbmy8028_rel_native_lto.cy9c_gcp_c2s60
Insert response time histogram
256us	1ms	4ms	16ms	64ms	256ms	1s	4s	16s	gt	max	tag
0.000	0.011	95.525	4.462	0.001	0.000	0.000	0.000	0.000	0.000	0.016	fbmy5635_rel.cy9c_gcp_c2s60
0.000	0.006	99.318	0.676	0.000	0.000	0.000	0.000	0.000	0.000	0.015	fbmy8028_rel_native_lto.cy9c_gcp_c2s60
q500.1
- q500.1: range queries with 500 insert/s per client
- Legend for results is here.
- Each entry lists the percentage of responses that fit in that bucket (slower than max time for previous bucket, faster than min time for next bucket).
Query response time histogram
256us	1ms	4ms	16ms	64ms	256ms	1s	4s	16s	gt	max	tag
22.815	77.155	0.028	0.001	0.001	0.000	0.000	0.000	0.000	0.000	0.039	fbmy5635_rel.cy9c_gcp_c2s60
74.921	25.054	0.023	0.001	nonzero	0.000	0.000	0.000	0.000	0.000	0.036	fbmy8028_rel_native_lto.cy9c_gcp_c2s60
Insert response time histogram
256us	1ms	4ms	16ms	64ms	256ms	1s	4s	16s	gt	max	tag
0.000	0.006	10.419	88.820	0.755	0.000	0.000	0.000	0.000	0.000	0.031	fbmy5635_rel.cy9c_gcp_c2s60
0.000	0.001	16.924	82.713	0.363	0.000	0.000	0.000	0.000	0.000	0.051	fbmy8028_rel_native_lto.cy9c_gcp_c2s60
q1000.1
- q1000.1: range queries with 1000 insert/s per client
- Legend for results is here.
- Each entry lists the percentage of responses that fit in that bucket (slower than max time for previous bucket, faster than min time for next bucket).
Query response time histogram
256us	1ms	4ms	16ms	64ms	256ms	1s	4s	16s	gt	max	tag
14.469	85.480	0.050	0.001	nonzero	0.000	0.000	0.000	0.000	0.000	0.046	fbmy5635_rel.cy9c_gcp_c2s60
66.815	33.146	0.038	0.001	nonzero	0.000	0.000	0.000	0.000	0.000	0.024	fbmy8028_rel_native_lto.cy9c_gcp_c2s60
Insert response time histogram
256us	1ms	4ms	16ms	64ms	256ms	1s	4s	16s	gt	max	tag
0.000	0.010	15.862	83.479	0.649	0.000	0.000	0.000	0.000	0.000	0.036	fbmy5635_rel.cy9c_gcp_c2s60
0.000	0.002	25.507	74.093	0.398	0.000	0.000	0.000	0.000	0.000	0.053	fbmy8028_rel_native_lto.cy9c_gcp_c2s60