Introduction
This is a report for the insert benchmark with 400M docs and 20 client(s). It is generated by scripts (bash, awk, sed) and Tufte might not be impressed. An overview of the insert benchmark is here and a short update is here. Below, by DBMS, I mean DBMS+version.config. An example is my8020.c10b40 where my means MySQL, 8020 is version 8.0.20 and c10b40 is the name for the configuration file.
The test server is c2-standard-60 from GCP with 30 cores, hyperthreading disabled, 240G RAM and 3T of NVMe storage. The benchmark was run with 20 clients and there were 1 or 2 connections per client (1 for queries, 1 for inserts). The benchmark loads 400M rows without secondary indexes, creates secondary indexes, loads another 400M rows then does 3 read+write tests for 1800 seconds each that do queries as fast as possible with 100, 500 and then 1000 writes/second/client concurrent with the queries. All clients share one table. The database is cached by the OS page cache but not the storage engine. Clients and the DBMS share one server. The per-database configs are in the per-database subdirectories here.
The tested DBMS are:
- fbmy8028_rel_withdbg.cy9c4g_gcp_c2s60 - MyRocks 8.0.28, the cy9c4g_gcp_c2s60 config and compiled with CMAKE_BUILD_TYPE=RelWithDebInfo and -O2
- fbmy8028_rel.cy9c4g_gcp_c2s60 - MyRocks 8.0.28, the cy9c4g_gcp_c2s60 config and compiled with CMAKE_BUILD_TYPE=Release and -O3
- fbmy8028_rel_o2.cy9c4g_gcp_c2s60 - MyRocks 8.0.28, the cy9c4g_gcp_c2s60 config and compiled with CMAKE_BUILD_TYPE=Release and -O2
- fbmy8028_rel_native.cy9c4g_gcp_c2s60 - MyRocks 8.0.28, the cy9c4g_gcp_c2s60 config and compiled with CMAKE_BUILD_TYPE=Release and -O3 -march=native -mtune=native
- fbmy8028_rel_o2_lto.cy9c4g_gcp_c2s60 - MyRocks 8.0.28, the cy9c4g_gcp_c2s60 config and compiled with CMAKE_BUILD_TYPE=Release and -O2 -flto
- fbmy8028_rel_lto.cy9c4g_gcp_c2s60 - MyRocks 8.0.28, the cy9c4g_gcp_c2s60 config and compiled with CMAKE_BUILD_TYPE=Release and -O3 -flto
- fbmy8028_rel_native_lto.cy9c4g_gcp_c2s60 - MyRocks 8.0.28, the cy9c4g_gcp_c2s60 config and compiled with CMAKE_BUILD_TYPE=Release and -O3 -flto -march=native -mtune=native
Contents
- Summary
- l.i0: load without secondary indexes
- l.x: create secondary indexes
- l.i1: continue load after secondary indexes created
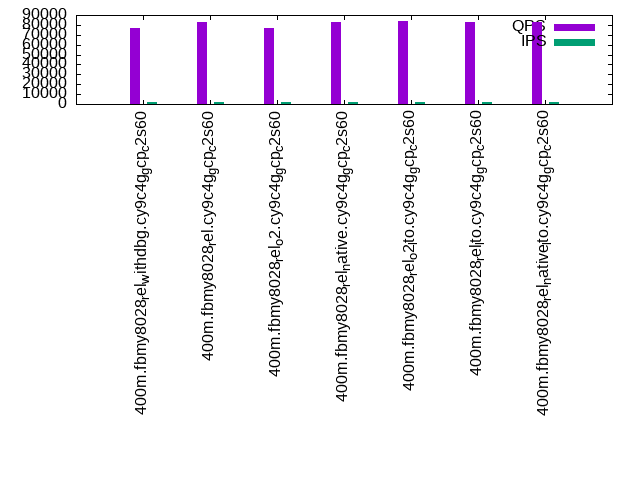
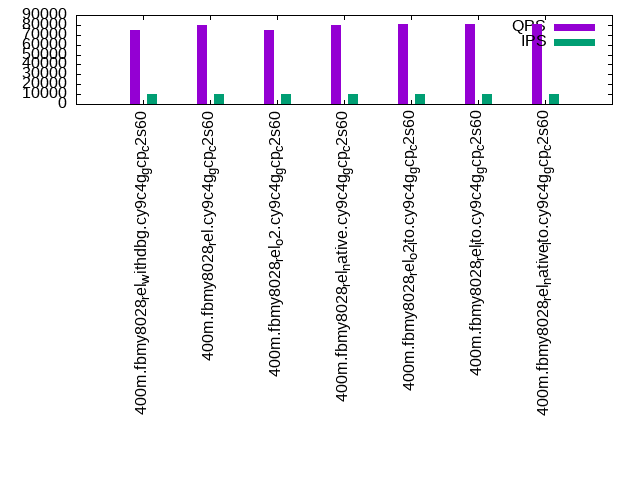
- q100.1: range queries with 100 insert/s per client
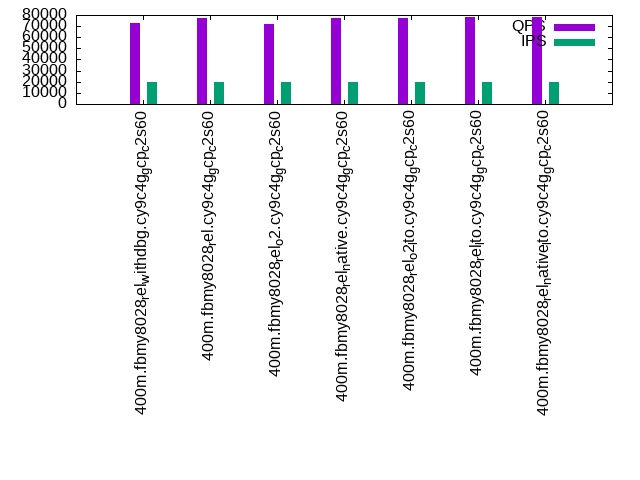
- q500.1: range queries with 500 insert/s per client
- q1000.1: range queries with 1000 insert/s per client
Summary
The numbers are inserts/s for l.i0 and l.i1, indexed docs (or rows) /s for l.x and queries/s for q*.2. The values are the average rate over the entire test for inserts (IPS) and queries (QPS). The range of values for IPS and QPS is split into 3 parts: bottom 25%, middle 50%, top 25%. Values in the bottom 25% have a red background, values in the top 25% have a green background and values in the middle have no color. A gray background is used for values that can be ignored because the DBMS did not sustain the target insert rate. Red backgrounds are not used when the minimum value is within 80% of the max value.
| dbms | l.i0 | l.x | l.i1 | q100.1 | q500.1 | q1000.1 |
|---|---|---|---|---|---|---|
| 400m.fbmy8028_rel_withdbg.cy9c4g_gcp_c2s60 | 701754 | 93591 | 152555 | 76362 | 74739 | 72426 |
| 400m.fbmy8028_rel.cy9c4g_gcp_c2s60 | 714286 | 102301 | 154261 | 83015 | 80337 | 77027 |
| 400m.fbmy8028_rel_o2.cy9c4g_gcp_c2s60 | 698080 | 94788 | 152497 | 76454 | 74399 | 72145 |
| 400m.fbmy8028_rel_native.cy9c4g_gcp_c2s60 | 705467 | 103841 | 149981 | 82472 | 80282 | 77188 |
| 400m.fbmy8028_rel_o2_lto.cy9c4g_gcp_c2s60 | 704225 | 91977 | 158919 | 83636 | 80676 | 77490 |
| 400m.fbmy8028_rel_lto.cy9c4g_gcp_c2s60 | 731261 | 108311 | 159109 | 83141 | 81121 | 78065 |
| 400m.fbmy8028_rel_native_lto.cy9c4g_gcp_c2s60 | 728597 | 107786 | 159808 | 82778 | 80883 | 77800 |
This table has relative throughput, throughput for the DBMS relative to the DBMS in the first line, using the absolute throughput from the previous table.
| dbms | l.i0 | l.x | l.i1 | q100.1 | q500.1 | q1000.1 |
|---|---|---|---|---|---|---|
| 400m.fbmy8028_rel_withdbg.cy9c4g_gcp_c2s60 | 1.00 | 1.00 | 1.00 | 1.00 | 1.00 | 1.00 |
| 400m.fbmy8028_rel.cy9c4g_gcp_c2s60 | 1.02 | 1.09 | 1.01 | 1.09 | 1.07 | 1.06 |
| 400m.fbmy8028_rel_o2.cy9c4g_gcp_c2s60 | 0.99 | 1.01 | 1.00 | 1.00 | 1.00 | 1.00 |
| 400m.fbmy8028_rel_native.cy9c4g_gcp_c2s60 | 1.01 | 1.11 | 0.98 | 1.08 | 1.07 | 1.07 |
| 400m.fbmy8028_rel_o2_lto.cy9c4g_gcp_c2s60 | 1.00 | 0.98 | 1.04 | 1.10 | 1.08 | 1.07 |
| 400m.fbmy8028_rel_lto.cy9c4g_gcp_c2s60 | 1.04 | 1.16 | 1.04 | 1.09 | 1.09 | 1.08 |
| 400m.fbmy8028_rel_native_lto.cy9c4g_gcp_c2s60 | 1.04 | 1.15 | 1.05 | 1.08 | 1.08 | 1.07 |
This lists the average rate of inserts/s for the tests that do inserts concurrent with queries. For such tests the query rate is listed in the table above. The read+write tests are setup so that the insert rate should match the target rate every second. Cells that are not at least 95% of the target have a red background to indicate a failure to satisfy the target.
| dbms | q100.1 | q500.1 | q1000.1 |
|---|---|---|---|
| fbmy8028_rel_withdbg.cy9c4g_gcp_c2s60 | 1976 | 9885 | 19769 |
| fbmy8028_rel.cy9c4g_gcp_c2s60 | 1976 | 9885 | 19769 |
| fbmy8028_rel_o2.cy9c4g_gcp_c2s60 | 1976 | 9879 | 19769 |
| fbmy8028_rel_native.cy9c4g_gcp_c2s60 | 1976 | 9890 | 19769 |
| fbmy8028_rel_o2_lto.cy9c4g_gcp_c2s60 | 1976 | 9885 | 19769 |
| fbmy8028_rel_lto.cy9c4g_gcp_c2s60 | 1976 | 9890 | 19769 |
| fbmy8028_rel_native_lto.cy9c4g_gcp_c2s60 | 1976 | 9885 | 19769 |
| target | 2000 | 10000 | 20000 |
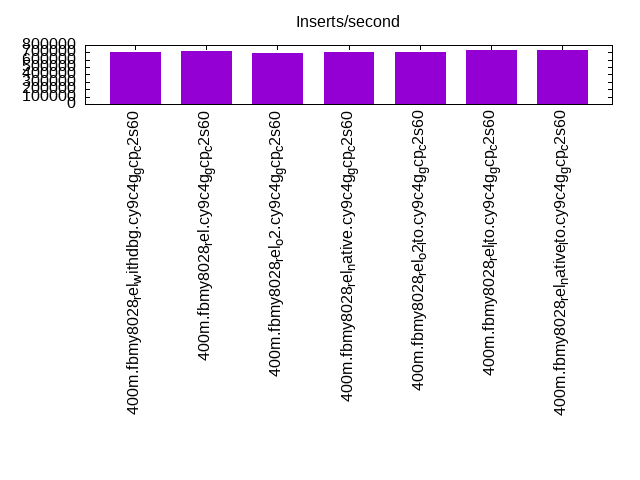
l.i0
l.i0: load without secondary indexes. Graphs for performance per 1-second interval are here.
Average throughput:
Insert response time histogram: each cell has the percentage of responses that take <= the time in the header and max is the max response time in seconds. For the max column values in the top 25% of the range have a red background and in the bottom 25% of the range have a green background. The red background is not used when the min value is within 80% of the max value.
| dbms | 256us | 1ms | 4ms | 16ms | 64ms | 256ms | 1s | 4s | 16s | gt | max |
|---|---|---|---|---|---|---|---|---|---|---|---|
| fbmy8028_rel_withdbg.cy9c4g_gcp_c2s60 | 0.300 | 98.567 | 1.091 | 0.006 | 0.036 | 0.250 | |||||
| fbmy8028_rel.cy9c4g_gcp_c2s60 | 0.375 | 98.573 | 1.009 | 0.007 | 0.036 | 0.247 | |||||
| fbmy8028_rel_o2.cy9c4g_gcp_c2s60 | 0.345 | 98.422 | 1.190 | 0.007 | 0.036 | 0.254 | |||||
| fbmy8028_rel_native.cy9c4g_gcp_c2s60 | 0.414 | 98.487 | 1.055 | 0.008 | 0.036 | 0.245 | |||||
| fbmy8028_rel_o2_lto.cy9c4g_gcp_c2s60 | 0.407 | 98.439 | 1.105 | 0.011 | 0.036 | 0.250 | |||||
| fbmy8028_rel_lto.cy9c4g_gcp_c2s60 | 0.680 | 98.536 | 0.741 | 0.006 | 0.036 | 0.245 | |||||
| fbmy8028_rel_native_lto.cy9c4g_gcp_c2s60 | 0.515 | 98.689 | 0.757 | 0.004 | 0.036 | 0.243 |
Performance metrics for the DBMS listed above. Some are normalized by throughput, others are not. Legend for results is here.
ips	qps	rps	rmbps	wps	wmbps	rpq	rkbpq	wpi	wkbpi	csps	cpups	cspq	cpupq	dbgb1	dbgb2	rss	maxop	p50	p99	tag
701754	0	0	0.0	444.0	106.7	0.000	0.000	0.001	0.156	128436	44.6	0.183	19	12.6	13.1	1.7	0.250	36860	28270	400m.fbmy8028_rel_withdbg.cy9c4g_gcp_c2s60
714286	0	0	0.0	453.4	109.3	0.000	0.000	0.001	0.157	130508	44.9	0.183	19	12.5	13.1	1.7	0.247	37060	28769	400m.fbmy8028_rel.cy9c4g_gcp_c2s60
698080	0	0	0.0	439.6	105.7	0.000	0.000	0.001	0.155	129139	44.3	0.185	19	12.5	13.0	1.7	0.254	36572	28469	400m.fbmy8028_rel_o2.cy9c4g_gcp_c2s60
705467	0	0	0.0	446.4	107.5	0.000	0.000	0.001	0.156	130839	44.0	0.185	19	12.5	13.0	1.7	0.245	36860	28369	400m.fbmy8028_rel_native.cy9c4g_gcp_c2s60
704225	0	0	0.0	445.9	106.4	0.000	0.000	0.001	0.155	130220	44.4	0.185	19	12.5	13.1	1.7	0.250	36793	28278	400m.fbmy8028_rel_o2_lto.cy9c4g_gcp_c2s60
731261	0	0	0.0	464.8	111.0	0.000	0.000	0.001	0.155	135382	44.1	0.185	18	12.6	13.1	1.7	0.245	38373	29068	400m.fbmy8028_rel_lto.cy9c4g_gcp_c2s60
728597	0	0	0.0	460.1	110.8	0.000	0.000	0.001	0.156	135114	44.6	0.185	18	12.5	13.0	1.7	0.243	38158	29468	400m.fbmy8028_rel_native_lto.cy9c4g_gcp_c2s60
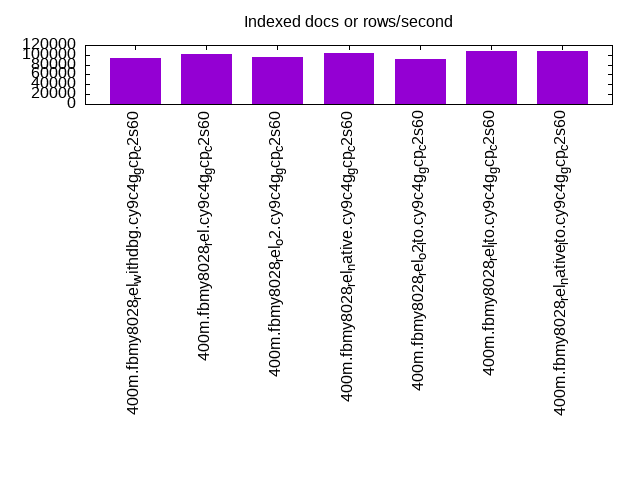
l.x
l.x: create secondary indexes.
Average throughput:
Performance metrics for the DBMS listed above. Some are normalized by throughput, others are not. Legend for results is here.
ips	qps	rps	rmbps	wps	wmbps	rpq	rkbpq	wpi	wkbpi	csps	cpups	cspq	cpupq	dbgb1	dbgb2	rss	maxop	p50	p99	tag
93591	0	0	0.0	33.5	10.4	0.000	0.000	0.000	0.114	670	2.9	0.007	9	25.4	25.9	6.0	0.003	NA	NA	400m.fbmy8028_rel_withdbg.cy9c4g_gcp_c2s60
102301	0	0	0.0	36.3	11.9	0.000	0.000	0.000	0.120	699	2.9	0.007	9	25.3	25.9	6.0	0.003	NA	NA	400m.fbmy8028_rel.cy9c4g_gcp_c2s60
94788	0	0	0.0	33.9	10.9	0.000	0.000	0.000	0.118	649	2.9	0.007	9	25.4	25.9	6.0	0.002	NA	NA	400m.fbmy8028_rel_o2.cy9c4g_gcp_c2s60
103841	0	0	0.0	36.9	11.5	0.000	0.000	0.000	0.114	719	2.9	0.007	8	25.3	25.9	6.0	0.003	NA	NA	400m.fbmy8028_rel_native.cy9c4g_gcp_c2s60
91977	0	0	0.0	32.8	9.9	0.000	0.000	0.000	0.110	671	2.9	0.007	9	25.4	25.9	6.0	0.003	NA	NA	400m.fbmy8028_rel_o2_lto.cy9c4g_gcp_c2s60
108311	0	0	0.0	38.8	11.4	0.000	0.000	0.000	0.108	708	2.9	0.007	8	25.3	25.8	6.0	0.002	NA	NA	400m.fbmy8028_rel_lto.cy9c4g_gcp_c2s60
107786	0	0	0.0	38.4	11.5	0.000	0.000	0.000	0.109	792	2.9	0.007	8	25.3	25.8	6.0	0.002	NA	NA	400m.fbmy8028_rel_native_lto.cy9c4g_gcp_c2s60
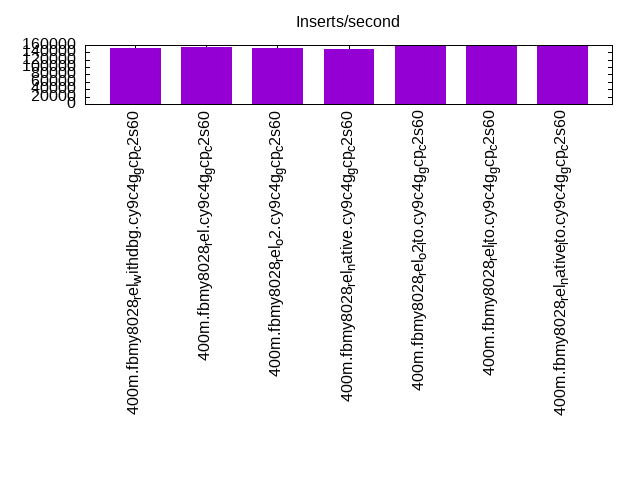
l.i1
l.i1: continue load after secondary indexes created. Graphs for performance per 1-second interval are here.
Average throughput:
Insert response time histogram: each cell has the percentage of responses that take <= the time in the header and max is the max response time in seconds. For the max column values in the top 25% of the range have a red background and in the bottom 25% of the range have a green background. The red background is not used when the min value is within 80% of the max value.
| dbms | 256us | 1ms | 4ms | 16ms | 64ms | 256ms | 1s | 4s | 16s | gt | max |
|---|---|---|---|---|---|---|---|---|---|---|---|
| fbmy8028_rel_withdbg.cy9c4g_gcp_c2s60 | 0.068 | 3.901 | 95.973 | 0.048 | 0.009 | 0.001 | 0.365 | ||||
| fbmy8028_rel.cy9c4g_gcp_c2s60 | 0.039 | 4.105 | 95.799 | 0.045 | 0.011 | 0.001 | 0.397 | ||||
| fbmy8028_rel_o2.cy9c4g_gcp_c2s60 | 0.032 | 3.831 | 96.081 | 0.045 | 0.011 | nonzero | 0.277 | ||||
| fbmy8028_rel_native.cy9c4g_gcp_c2s60 | 0.039 | 3.393 | 96.510 | 0.050 | 0.008 | 0.001 | 0.346 | ||||
| fbmy8028_rel_o2_lto.cy9c4g_gcp_c2s60 | 0.017 | 4.750 | 95.169 | 0.047 | 0.017 | 0.001 | 0.312 | ||||
| fbmy8028_rel_lto.cy9c4g_gcp_c2s60 | 0.052 | 4.966 | 94.929 | 0.038 | 0.014 | 0.001 | 0.404 | ||||
| fbmy8028_rel_native_lto.cy9c4g_gcp_c2s60 | 0.043 | 5.387 | 94.514 | 0.036 | 0.018 | 0.001 | 0.349 |
Performance metrics for the DBMS listed above. Some are normalized by throughput, others are not. Legend for results is here.
ips	qps	rps	rmbps	wps	wmbps	rpq	rkbpq	wpi	wkbpi	csps	cpups	cspq	cpupq	dbgb1	dbgb2	rss	maxop	p50	p99	tag
152555	0	12	2.3	482.9	110.7	0.000	0.016	0.003	0.743	141064	32.8	0.925	65	54.6	55.9	4.9	0.365	7642	6595	400m.fbmy8028_rel_withdbg.cy9c4g_gcp_c2s60
154261	0	12	2.4	481.7	111.7	0.000	0.016	0.003	0.741	148161	34.0	0.960	66	55.8	57.1	5.0	0.397	7692	6493	400m.fbmy8028_rel.cy9c4g_gcp_c2s60
152497	0	11	2.4	484.7	111.2	0.000	0.016	0.003	0.747	148037	32.9	0.971	65	56.0	57.1	5.1	0.277	7597	6543	400m.fbmy8028_rel_o2.cy9c4g_gcp_c2s60
149981	0	11	2.3	477.5	110.0	0.000	0.016	0.003	0.751	139965	32.4	0.933	65	52.9	54.1	4.9	0.346	7494	6645	400m.fbmy8028_rel_native.cy9c4g_gcp_c2s60
158919	0	12	2.5	504.0	118.3	0.000	0.016	0.003	0.762	148219	33.9	0.933	64	52.6	53.8	4.9	0.312	7944	6592	400m.fbmy8028_rel_o2_lto.cy9c4g_gcp_c2s60
159109	0	12	2.5	505.2	117.0	0.000	0.016	0.003	0.753	149909	33.4	0.942	63	52.6	53.9	4.9	0.404	7944	6543	400m.fbmy8028_rel_lto.cy9c4g_gcp_c2s60
159808	0	12	2.5	512.3	119.3	0.000	0.016	0.003	0.765	150452	33.2	0.941	62	53.6	54.8	5.1	0.349	7991	6443	400m.fbmy8028_rel_native_lto.cy9c4g_gcp_c2s60
q100.1
q100.1: range queries with 100 insert/s per client. Graphs for performance per 1-second interval are here.
Average throughput:
Query response time histogram: each cell has the percentage of responses that take <= the time in the header and max is the max response time in seconds. For max values in the top 25% of the range have a red background and in the bottom 25% of the range have a green background. The red background is not used when the min value is within 80% of the max value.
| dbms | 256us | 1ms | 4ms | 16ms | 64ms | 256ms | 1s | 4s | 16s | gt | max |
|---|---|---|---|---|---|---|---|---|---|---|---|
| fbmy8028_rel_withdbg.cy9c4g_gcp_c2s60 | 65.557 | 34.438 | 0.006 | nonzero | 0.013 | ||||||
| fbmy8028_rel.cy9c4g_gcp_c2s60 | 81.913 | 18.084 | 0.003 | nonzero | nonzero | 0.028 | |||||
| fbmy8028_rel_o2.cy9c4g_gcp_c2s60 | 65.791 | 34.205 | 0.005 | nonzero | nonzero | 0.024 | |||||
| fbmy8028_rel_native.cy9c4g_gcp_c2s60 | 81.172 | 18.824 | 0.003 | nonzero | nonzero | 0.016 | |||||
| fbmy8028_rel_o2_lto.cy9c4g_gcp_c2s60 | 82.972 | 17.025 | 0.003 | nonzero | 0.015 | ||||||
| fbmy8028_rel_lto.cy9c4g_gcp_c2s60 | 82.084 | 17.913 | 0.003 | nonzero | nonzero | 0.017 | |||||
| fbmy8028_rel_native_lto.cy9c4g_gcp_c2s60 | 81.609 | 18.388 | 0.003 | nonzero | 0.016 |
Insert response time histogram: each cell has the percentage of responses that take <= the time in the header and max is the max response time in seconds. For max values in the top 25% of the range have a red background and in the bottom 25% of the range have a green background. The red background is not used when the min value is within 80% of the max value.
| dbms | 256us | 1ms | 4ms | 16ms | 64ms | 256ms | 1s | 4s | 16s | gt | max |
|---|---|---|---|---|---|---|---|---|---|---|---|
| fbmy8028_rel_withdbg.cy9c4g_gcp_c2s60 | 89.031 | 10.969 | 0.015 | ||||||||
| fbmy8028_rel.cy9c4g_gcp_c2s60 | 95.472 | 4.528 | 0.010 | ||||||||
| fbmy8028_rel_o2.cy9c4g_gcp_c2s60 | 98.211 | 1.765 | 0.024 | 0.032 | |||||||
| fbmy8028_rel_native.cy9c4g_gcp_c2s60 | 0.004 | 99.519 | 0.476 | 0.012 | |||||||
| fbmy8028_rel_o2_lto.cy9c4g_gcp_c2s60 | 0.004 | 95.511 | 4.485 | 0.014 | |||||||
| fbmy8028_rel_lto.cy9c4g_gcp_c2s60 | 0.008 | 98.647 | 1.344 | 0.008 | |||||||
| fbmy8028_rel_native_lto.cy9c4g_gcp_c2s60 | 0.019 | 99.597 | 0.382 | 0.001 | 0.017 |
Performance metrics for the DBMS listed above. Some are normalized by throughput, others are not. Legend for results is here.
ips	qps	rps	rmbps	wps	wmbps	rpq	rkbpq	wpi	wkbpi	csps	cpups	cspq	cpupq	dbgb1	dbgb2	rss	maxop	p50	p99	tag
1976	76362	0	0.0	17.7	2.6	0.000	0.000	0.009	1.324	302918	66.0	3.967	259	52.4	54.1	5.4	0.013	3870	3580	400m.fbmy8028_rel_withdbg.cy9c4g_gcp_c2s60
1976	83015	0	0.0	19.7	3.0	0.000	0.000	0.010	1.531	325452	66.1	3.920	239	52.4	54.1	5.3	0.028	4171	3646	400m.fbmy8028_rel.cy9c4g_gcp_c2s60
1976	76454	0	0.0	19.2	2.9	0.000	0.000	0.010	1.513	300112	66.1	3.925	259	52.4	54.0	5.2	0.024	3869	3547	400m.fbmy8028_rel_o2.cy9c4g_gcp_c2s60
1976	82472	0	0.0	22.6	3.5	0.000	0.000	0.011	1.811	324652	66.1	3.936	240	52.4	54.1	5.6	0.016	4203	3821	400m.fbmy8028_rel_native.cy9c4g_gcp_c2s60
1976	83636	0	0.0	18.9	3.0	0.000	0.000	0.010	1.568	329445	65.8	3.939	236	52.4	54.1	5.6	0.015	4237	3836	400m.fbmy8028_rel_o2_lto.cy9c4g_gcp_c2s60
1976	83141	0	0.0	20.7	3.0	0.000	0.000	0.010	1.576	327907	65.8	3.944	237	52.3	54.0	5.2	0.017	4203	3836	400m.fbmy8028_rel_lto.cy9c4g_gcp_c2s60
1976	82778	0	0.0	23.7	3.7	0.000	0.000	0.012	1.940	323952	66.0	3.913	239	52.3	54.0	5.3	0.016	4171	3804	400m.fbmy8028_rel_native_lto.cy9c4g_gcp_c2s60
q500.1
q500.1: range queries with 500 insert/s per client. Graphs for performance per 1-second interval are here.
Average throughput:
Query response time histogram: each cell has the percentage of responses that take <= the time in the header and max is the max response time in seconds. For max values in the top 25% of the range have a red background and in the bottom 25% of the range have a green background. The red background is not used when the min value is within 80% of the max value.
| dbms | 256us | 1ms | 4ms | 16ms | 64ms | 256ms | 1s | 4s | 16s | gt | max |
|---|---|---|---|---|---|---|---|---|---|---|---|
| fbmy8028_rel_withdbg.cy9c4g_gcp_c2s60 | 59.231 | 40.739 | 0.029 | 0.001 | nonzero | 0.043 | |||||
| fbmy8028_rel.cy9c4g_gcp_c2s60 | 74.620 | 25.356 | 0.024 | 0.001 | nonzero | 0.024 | |||||
| fbmy8028_rel_o2.cy9c4g_gcp_c2s60 | 58.325 | 41.645 | 0.029 | 0.001 | nonzero | 0.055 | |||||
| fbmy8028_rel_native.cy9c4g_gcp_c2s60 | 74.603 | 25.372 | 0.024 | 0.001 | nonzero | 0.023 | |||||
| fbmy8028_rel_o2_lto.cy9c4g_gcp_c2s60 | 75.684 | 24.291 | 0.024 | 0.001 | nonzero | 0.031 | |||||
| fbmy8028_rel_lto.cy9c4g_gcp_c2s60 | 76.458 | 23.519 | 0.023 | 0.001 | nonzero | 0.042 | |||||
| fbmy8028_rel_native_lto.cy9c4g_gcp_c2s60 | 75.953 | 24.024 | 0.022 | 0.001 | nonzero | 0.049 |
Insert response time histogram: each cell has the percentage of responses that take <= the time in the header and max is the max response time in seconds. For max values in the top 25% of the range have a red background and in the bottom 25% of the range have a green background. The red background is not used when the min value is within 80% of the max value.
| dbms | 256us | 1ms | 4ms | 16ms | 64ms | 256ms | 1s | 4s | 16s | gt | max |
|---|---|---|---|---|---|---|---|---|---|---|---|
| fbmy8028_rel_withdbg.cy9c4g_gcp_c2s60 | 16.327 | 83.189 | 0.483 | 0.030 | |||||||
| fbmy8028_rel.cy9c4g_gcp_c2s60 | 15.661 | 83.887 | 0.453 | 0.029 | |||||||
| fbmy8028_rel_o2.cy9c4g_gcp_c2s60 | 16.419 | 83.112 | 0.469 | 0.063 | |||||||
| fbmy8028_rel_native.cy9c4g_gcp_c2s60 | 0.001 | 15.857 | 83.719 | 0.423 | 0.031 | ||||||
| fbmy8028_rel_o2_lto.cy9c4g_gcp_c2s60 | 0.001 | 15.698 | 83.881 | 0.420 | 0.034 | ||||||
| fbmy8028_rel_lto.cy9c4g_gcp_c2s60 | 0.001 | 17.194 | 82.486 | 0.318 | 0.028 | ||||||
| fbmy8028_rel_native_lto.cy9c4g_gcp_c2s60 | nonzero | 16.435 | 83.221 | 0.344 | 0.031 |
Performance metrics for the DBMS listed above. Some are normalized by throughput, others are not. Legend for results is here.
ips	qps	rps	rmbps	wps	wmbps	rpq	rkbpq	wpi	wkbpi	csps	cpups	cspq	cpupq	dbgb1	dbgb2	rss	maxop	p50	p99	tag
9885	74739	0	0.0	50.3	8.6	0.000	0.000	0.005	0.892	292819	67.4	3.918	271	53.6	55.5	5.2	0.043	3789	3468	400m.fbmy8028_rel_withdbg.cy9c4g_gcp_c2s60
9885	80337	0	0.0	50.1	8.7	0.000	0.000	0.005	0.901	314792	67.3	3.918	251	53.5	55.5	5.2	0.024	4091	3710	400m.fbmy8028_rel.cy9c4g_gcp_c2s60
9879	74399	0	0.0	45.5	8.4	0.000	0.000	0.005	0.874	291040	67.2	3.912	271	53.6	55.5	5.3	0.055	3758	3420	400m.fbmy8028_rel_o2.cy9c4g_gcp_c2s60
9890	80282	0	0.0	48.0	7.7	0.000	0.000	0.005	0.802	314473	67.2	3.917	251	53.6	55.6	5.3	0.023	4060	3692	400m.fbmy8028_rel_native.cy9c4g_gcp_c2s60
9885	80676	0	0.0	46.9	8.6	0.000	0.000	0.005	0.892	316351	67.1	3.921	250	53.6	55.6	5.3	0.031	4091	3708	400m.fbmy8028_rel_o2_lto.cy9c4g_gcp_c2s60
9890	81121	0	0.0	44.5	7.9	0.000	0.000	0.005	0.822	318387	67.0	3.925	248	53.5	55.5	5.2	0.042	4139	3771	400m.fbmy8028_rel_lto.cy9c4g_gcp_c2s60
9885	80883	0	0.0	47.8	8.5	0.000	0.000	0.005	0.885	315965	67.1	3.906	249	53.5	55.4	5.3	0.049	4123	3756	400m.fbmy8028_rel_native_lto.cy9c4g_gcp_c2s60
q1000.1
q1000.1: range queries with 1000 insert/s per client. Graphs for performance per 1-second interval are here.
Average throughput:
Query response time histogram: each cell has the percentage of responses that take <= the time in the header and max is the max response time in seconds. For max values in the top 25% of the range have a red background and in the bottom 25% of the range have a green background. The red background is not used when the min value is within 80% of the max value.
| dbms | 256us | 1ms | 4ms | 16ms | 64ms | 256ms | 1s | 4s | 16s | gt | max |
|---|---|---|---|---|---|---|---|---|---|---|---|
| fbmy8028_rel_withdbg.cy9c4g_gcp_c2s60 | 50.502 | 49.449 | 0.048 | 0.001 | nonzero | 0.048 | |||||
| fbmy8028_rel.cy9c4g_gcp_c2s60 | 63.895 | 36.064 | 0.040 | 0.001 | nonzero | 0.037 | |||||
| fbmy8028_rel_o2.cy9c4g_gcp_c2s60 | 49.589 | 50.362 | 0.048 | 0.001 | nonzero | 0.034 | |||||
| fbmy8028_rel_native.cy9c4g_gcp_c2s60 | 64.354 | 35.605 | 0.040 | 0.001 | nonzero | 0.039 | |||||
| fbmy8028_rel_o2_lto.cy9c4g_gcp_c2s60 | 65.289 | 34.671 | 0.040 | 0.001 | nonzero | 0.031 | |||||
| fbmy8028_rel_lto.cy9c4g_gcp_c2s60 | 66.880 | 33.080 | 0.039 | 0.001 | nonzero | 0.029 | |||||
| fbmy8028_rel_native_lto.cy9c4g_gcp_c2s60 | 66.275 | 33.685 | 0.039 | 0.001 | nonzero | 0.034 |
Insert response time histogram: each cell has the percentage of responses that take <= the time in the header and max is the max response time in seconds. For max values in the top 25% of the range have a red background and in the bottom 25% of the range have a green background. The red background is not used when the min value is within 80% of the max value.
| dbms | 256us | 1ms | 4ms | 16ms | 64ms | 256ms | 1s | 4s | 16s | gt | max |
|---|---|---|---|---|---|---|---|---|---|---|---|
| fbmy8028_rel_withdbg.cy9c4g_gcp_c2s60 | 25.244 | 74.238 | 0.518 | 0.037 | |||||||
| fbmy8028_rel.cy9c4g_gcp_c2s60 | 0.005 | 24.452 | 74.948 | 0.594 | 0.038 | ||||||
| fbmy8028_rel_o2.cy9c4g_gcp_c2s60 | nonzero | 25.131 | 74.289 | 0.580 | 0.044 | ||||||
| fbmy8028_rel_native.cy9c4g_gcp_c2s60 | nonzero | 24.385 | 75.004 | 0.610 | 0.035 | ||||||
| fbmy8028_rel_o2_lto.cy9c4g_gcp_c2s60 | 24.359 | 75.094 | 0.547 | 0.039 | |||||||
| fbmy8028_rel_lto.cy9c4g_gcp_c2s60 | 0.007 | 24.907 | 74.639 | 0.448 | 0.047 | ||||||
| fbmy8028_rel_native_lto.cy9c4g_gcp_c2s60 | 0.003 | 25.428 | 74.119 | 0.450 | 0.034 |
Performance metrics for the DBMS listed above. Some are normalized by throughput, others are not. Legend for results is here.
ips	qps	rps	rmbps	wps	wmbps	rpq	rkbpq	wpi	wkbpi	csps	cpups	cspq	cpupq	dbgb1	dbgb2	rss	maxop	p50	p99	tag
19769	72426	0	0.0	90.6	17.7	0.000	0.000	0.005	0.917	279725	69.2	3.862	287	55.9	56.5	5.2	0.048	3676	3340	400m.fbmy8028_rel_withdbg.cy9c4g_gcp_c2s60
19769	77027	0	0.0	89.6	17.0	0.000	0.000	0.005	0.883	298249	69.1	3.872	269	56.1	56.7	5.2	0.037	3900	3564	400m.fbmy8028_rel.cy9c4g_gcp_c2s60
19769	72145	0	0.0	84.7	17.7	0.000	0.000	0.004	0.917	277085	69.1	3.841	287	56.0	56.5	5.2	0.034	3628	3325	400m.fbmy8028_rel_o2.cy9c4g_gcp_c2s60
19769	77188	0	0.0	91.6	17.9	0.000	0.000	0.005	0.925	298748	69.2	3.870	269	56.1	56.6	5.3	0.039	3915	3564	400m.fbmy8028_rel_native.cy9c4g_gcp_c2s60
19769	77490	0	0.0	86.1	17.8	0.000	0.000	0.004	0.922	300538	69.0	3.878	267	55.9	56.4	5.2	0.031	3932	3580	400m.fbmy8028_rel_o2_lto.cy9c4g_gcp_c2s60
19769	78065	0	0.0	86.4	18.1	0.000	0.000	0.004	0.938	303623	68.8	3.889	264	55.9	56.4	5.3	0.029	3963	3644	400m.fbmy8028_rel_lto.cy9c4g_gcp_c2s60
19769	77800	0	0.0	88.2	17.9	0.000	0.000	0.004	0.927	299809	68.8	3.854	265	56.2	56.7	5.4	0.034	3933	3596	400m.fbmy8028_rel_native_lto.cy9c4g_gcp_c2s60
l.i0
l.i0: load without secondary indexes
Performance metrics for all DBMS, not just the ones listed above. Some are normalized by throughput, others are not. Legend for results is here.
ips	qps	rps	rmbps	wps	wmbps	rpq	rkbpq	wpi	wkbpi	csps	cpups	cspq	cpupq	dbgb1	dbgb2	rss	maxop	p50	p99	tag
701754	0	0	0.0	444.0	106.7	0.000	0.000	0.001	0.156	128436	44.6	0.183	19	12.6	13.1	1.7	0.250	36860	28270	400m.fbmy8028_rel_withdbg.cy9c4g_gcp_c2s60
714286	0	0	0.0	453.4	109.3	0.000	0.000	0.001	0.157	130508	44.9	0.183	19	12.5	13.1	1.7	0.247	37060	28769	400m.fbmy8028_rel.cy9c4g_gcp_c2s60
698080	0	0	0.0	439.6	105.7	0.000	0.000	0.001	0.155	129139	44.3	0.185	19	12.5	13.0	1.7	0.254	36572	28469	400m.fbmy8028_rel_o2.cy9c4g_gcp_c2s60
705467	0	0	0.0	446.4	107.5	0.000	0.000	0.001	0.156	130839	44.0	0.185	19	12.5	13.0	1.7	0.245	36860	28369	400m.fbmy8028_rel_native.cy9c4g_gcp_c2s60
704225	0	0	0.0	445.9	106.4	0.000	0.000	0.001	0.155	130220	44.4	0.185	19	12.5	13.1	1.7	0.250	36793	28278	400m.fbmy8028_rel_o2_lto.cy9c4g_gcp_c2s60
731261	0	0	0.0	464.8	111.0	0.000	0.000	0.001	0.155	135382	44.1	0.185	18	12.6	13.1	1.7	0.245	38373	29068	400m.fbmy8028_rel_lto.cy9c4g_gcp_c2s60
728597	0	0	0.0	460.1	110.8	0.000	0.000	0.001	0.156	135114	44.6	0.185	18	12.5	13.0	1.7	0.243	38158	29468	400m.fbmy8028_rel_native_lto.cy9c4g_gcp_c2s60
l.x
l.x: create secondary indexes
Performance metrics for all DBMS, not just the ones listed above. Some are normalized by throughput, others are not. Legend for results is here.
ips	qps	rps	rmbps	wps	wmbps	rpq	rkbpq	wpi	wkbpi	csps	cpups	cspq	cpupq	dbgb1	dbgb2	rss	maxop	p50	p99	tag
93591	0	0	0.0	33.5	10.4	0.000	0.000	0.000	0.114	670	2.9	0.007	9	25.4	25.9	6.0	0.003	NA	NA	400m.fbmy8028_rel_withdbg.cy9c4g_gcp_c2s60
102301	0	0	0.0	36.3	11.9	0.000	0.000	0.000	0.120	699	2.9	0.007	9	25.3	25.9	6.0	0.003	NA	NA	400m.fbmy8028_rel.cy9c4g_gcp_c2s60
94788	0	0	0.0	33.9	10.9	0.000	0.000	0.000	0.118	649	2.9	0.007	9	25.4	25.9	6.0	0.002	NA	NA	400m.fbmy8028_rel_o2.cy9c4g_gcp_c2s60
103841	0	0	0.0	36.9	11.5	0.000	0.000	0.000	0.114	719	2.9	0.007	8	25.3	25.9	6.0	0.003	NA	NA	400m.fbmy8028_rel_native.cy9c4g_gcp_c2s60
91977	0	0	0.0	32.8	9.9	0.000	0.000	0.000	0.110	671	2.9	0.007	9	25.4	25.9	6.0	0.003	NA	NA	400m.fbmy8028_rel_o2_lto.cy9c4g_gcp_c2s60
108311	0	0	0.0	38.8	11.4	0.000	0.000	0.000	0.108	708	2.9	0.007	8	25.3	25.8	6.0	0.002	NA	NA	400m.fbmy8028_rel_lto.cy9c4g_gcp_c2s60
107786	0	0	0.0	38.4	11.5	0.000	0.000	0.000	0.109	792	2.9	0.007	8	25.3	25.8	6.0	0.002	NA	NA	400m.fbmy8028_rel_native_lto.cy9c4g_gcp_c2s60
l.i1
l.i1: continue load after secondary indexes created
Performance metrics for all DBMS, not just the ones listed above. Some are normalized by throughput, others are not. Legend for results is here.
ips	qps	rps	rmbps	wps	wmbps	rpq	rkbpq	wpi	wkbpi	csps	cpups	cspq	cpupq	dbgb1	dbgb2	rss	maxop	p50	p99	tag
152555	0	12	2.3	482.9	110.7	0.000	0.016	0.003	0.743	141064	32.8	0.925	65	54.6	55.9	4.9	0.365	7642	6595	400m.fbmy8028_rel_withdbg.cy9c4g_gcp_c2s60
154261	0	12	2.4	481.7	111.7	0.000	0.016	0.003	0.741	148161	34.0	0.960	66	55.8	57.1	5.0	0.397	7692	6493	400m.fbmy8028_rel.cy9c4g_gcp_c2s60
152497	0	11	2.4	484.7	111.2	0.000	0.016	0.003	0.747	148037	32.9	0.971	65	56.0	57.1	5.1	0.277	7597	6543	400m.fbmy8028_rel_o2.cy9c4g_gcp_c2s60
149981	0	11	2.3	477.5	110.0	0.000	0.016	0.003	0.751	139965	32.4	0.933	65	52.9	54.1	4.9	0.346	7494	6645	400m.fbmy8028_rel_native.cy9c4g_gcp_c2s60
158919	0	12	2.5	504.0	118.3	0.000	0.016	0.003	0.762	148219	33.9	0.933	64	52.6	53.8	4.9	0.312	7944	6592	400m.fbmy8028_rel_o2_lto.cy9c4g_gcp_c2s60
159109	0	12	2.5	505.2	117.0	0.000	0.016	0.003	0.753	149909	33.4	0.942	63	52.6	53.9	4.9	0.404	7944	6543	400m.fbmy8028_rel_lto.cy9c4g_gcp_c2s60
159808	0	12	2.5	512.3	119.3	0.000	0.016	0.003	0.765	150452	33.2	0.941	62	53.6	54.8	5.1	0.349	7991	6443	400m.fbmy8028_rel_native_lto.cy9c4g_gcp_c2s60
q100.1
q100.1: range queries with 100 insert/s per client
Performance metrics for all DBMS, not just the ones listed above. Some are normalized by throughput, others are not. Legend for results is here.
ips	qps	rps	rmbps	wps	wmbps	rpq	rkbpq	wpi	wkbpi	csps	cpups	cspq	cpupq	dbgb1	dbgb2	rss	maxop	p50	p99	tag
1976	76362	0	0.0	17.7	2.6	0.000	0.000	0.009	1.324	302918	66.0	3.967	259	52.4	54.1	5.4	0.013	3870	3580	400m.fbmy8028_rel_withdbg.cy9c4g_gcp_c2s60
1976	83015	0	0.0	19.7	3.0	0.000	0.000	0.010	1.531	325452	66.1	3.920	239	52.4	54.1	5.3	0.028	4171	3646	400m.fbmy8028_rel.cy9c4g_gcp_c2s60
1976	76454	0	0.0	19.2	2.9	0.000	0.000	0.010	1.513	300112	66.1	3.925	259	52.4	54.0	5.2	0.024	3869	3547	400m.fbmy8028_rel_o2.cy9c4g_gcp_c2s60
1976	82472	0	0.0	22.6	3.5	0.000	0.000	0.011	1.811	324652	66.1	3.936	240	52.4	54.1	5.6	0.016	4203	3821	400m.fbmy8028_rel_native.cy9c4g_gcp_c2s60
1976	83636	0	0.0	18.9	3.0	0.000	0.000	0.010	1.568	329445	65.8	3.939	236	52.4	54.1	5.6	0.015	4237	3836	400m.fbmy8028_rel_o2_lto.cy9c4g_gcp_c2s60
1976	83141	0	0.0	20.7	3.0	0.000	0.000	0.010	1.576	327907	65.8	3.944	237	52.3	54.0	5.2	0.017	4203	3836	400m.fbmy8028_rel_lto.cy9c4g_gcp_c2s60
1976	82778	0	0.0	23.7	3.7	0.000	0.000	0.012	1.940	323952	66.0	3.913	239	52.3	54.0	5.3	0.016	4171	3804	400m.fbmy8028_rel_native_lto.cy9c4g_gcp_c2s60
q500.1
q500.1: range queries with 500 insert/s per client
Performance metrics for all DBMS, not just the ones listed above. Some are normalized by throughput, others are not. Legend for results is here.
ips	qps	rps	rmbps	wps	wmbps	rpq	rkbpq	wpi	wkbpi	csps	cpups	cspq	cpupq	dbgb1	dbgb2	rss	maxop	p50	p99	tag
9885	74739	0	0.0	50.3	8.6	0.000	0.000	0.005	0.892	292819	67.4	3.918	271	53.6	55.5	5.2	0.043	3789	3468	400m.fbmy8028_rel_withdbg.cy9c4g_gcp_c2s60
9885	80337	0	0.0	50.1	8.7	0.000	0.000	0.005	0.901	314792	67.3	3.918	251	53.5	55.5	5.2	0.024	4091	3710	400m.fbmy8028_rel.cy9c4g_gcp_c2s60
9879	74399	0	0.0	45.5	8.4	0.000	0.000	0.005	0.874	291040	67.2	3.912	271	53.6	55.5	5.3	0.055	3758	3420	400m.fbmy8028_rel_o2.cy9c4g_gcp_c2s60
9890	80282	0	0.0	48.0	7.7	0.000	0.000	0.005	0.802	314473	67.2	3.917	251	53.6	55.6	5.3	0.023	4060	3692	400m.fbmy8028_rel_native.cy9c4g_gcp_c2s60
9885	80676	0	0.0	46.9	8.6	0.000	0.000	0.005	0.892	316351	67.1	3.921	250	53.6	55.6	5.3	0.031	4091	3708	400m.fbmy8028_rel_o2_lto.cy9c4g_gcp_c2s60
9890	81121	0	0.0	44.5	7.9	0.000	0.000	0.005	0.822	318387	67.0	3.925	248	53.5	55.5	5.2	0.042	4139	3771	400m.fbmy8028_rel_lto.cy9c4g_gcp_c2s60
9885	80883	0	0.0	47.8	8.5	0.000	0.000	0.005	0.885	315965	67.1	3.906	249	53.5	55.4	5.3	0.049	4123	3756	400m.fbmy8028_rel_native_lto.cy9c4g_gcp_c2s60
q1000.1
q1000.1: range queries with 1000 insert/s per client
Performance metrics for all DBMS, not just the ones listed above. Some are normalized by throughput, others are not. Legend for results is here.
ips	qps	rps	rmbps	wps	wmbps	rpq	rkbpq	wpi	wkbpi	csps	cpups	cspq	cpupq	dbgb1	dbgb2	rss	maxop	p50	p99	tag
19769	72426	0	0.0	90.6	17.7	0.000	0.000	0.005	0.917	279725	69.2	3.862	287	55.9	56.5	5.2	0.048	3676	3340	400m.fbmy8028_rel_withdbg.cy9c4g_gcp_c2s60
19769	77027	0	0.0	89.6	17.0	0.000	0.000	0.005	0.883	298249	69.1	3.872	269	56.1	56.7	5.2	0.037	3900	3564	400m.fbmy8028_rel.cy9c4g_gcp_c2s60
19769	72145	0	0.0	84.7	17.7	0.000	0.000	0.004	0.917	277085	69.1	3.841	287	56.0	56.5	5.2	0.034	3628	3325	400m.fbmy8028_rel_o2.cy9c4g_gcp_c2s60
19769	77188	0	0.0	91.6	17.9	0.000	0.000	0.005	0.925	298748	69.2	3.870	269	56.1	56.6	5.3	0.039	3915	3564	400m.fbmy8028_rel_native.cy9c4g_gcp_c2s60
19769	77490	0	0.0	86.1	17.8	0.000	0.000	0.004	0.922	300538	69.0	3.878	267	55.9	56.4	5.2	0.031	3932	3580	400m.fbmy8028_rel_o2_lto.cy9c4g_gcp_c2s60
19769	78065	0	0.0	86.4	18.1	0.000	0.000	0.004	0.938	303623	68.8	3.889	264	55.9	56.4	5.3	0.029	3963	3644	400m.fbmy8028_rel_lto.cy9c4g_gcp_c2s60
19769	77800	0	0.0	88.2	17.9	0.000	0.000	0.004	0.927	299809	68.8	3.854	265	56.2	56.7	5.4	0.034	3933	3596	400m.fbmy8028_rel_native_lto.cy9c4g_gcp_c2s60
l.i0
- l.i0: load without secondary indexes
- Legend for results is here.
- Each entry lists the percentage of responses that fit in that bucket (slower than max time for previous bucket, faster than min time for next bucket).
Insert response time histogram
256us	1ms	4ms	16ms	64ms	256ms	1s	4s	16s	gt	max	tag
0.000	0.300	98.567	1.091	0.006	0.036	0.000	0.000	0.000	0.000	0.250	fbmy8028_rel_withdbg.cy9c4g_gcp_c2s60
0.000	0.375	98.573	1.009	0.007	0.036	0.000	0.000	0.000	0.000	0.247	fbmy8028_rel.cy9c4g_gcp_c2s60
0.000	0.345	98.422	1.190	0.007	0.036	0.000	0.000	0.000	0.000	0.254	fbmy8028_rel_o2.cy9c4g_gcp_c2s60
0.000	0.414	98.487	1.055	0.008	0.036	0.000	0.000	0.000	0.000	0.245	fbmy8028_rel_native.cy9c4g_gcp_c2s60
0.000	0.407	98.439	1.105	0.011	0.036	0.000	0.000	0.000	0.000	0.250	fbmy8028_rel_o2_lto.cy9c4g_gcp_c2s60
0.000	0.680	98.536	0.741	0.006	0.036	0.000	0.000	0.000	0.000	0.245	fbmy8028_rel_lto.cy9c4g_gcp_c2s60
0.000	0.515	98.689	0.757	0.004	0.036	0.000	0.000	0.000	0.000	0.243	fbmy8028_rel_native_lto.cy9c4g_gcp_c2s60
l.x
- l.x: create secondary indexes
- Legend for results is here.
- Each entry lists the percentage of responses that fit in that bucket (slower than max time for previous bucket, faster than min time for next bucket).
TODO - determine whether there is data for create index response time
l.i1
- l.i1: continue load after secondary indexes created
- Legend for results is here.
- Each entry lists the percentage of responses that fit in that bucket (slower than max time for previous bucket, faster than min time for next bucket).
Insert response time histogram
256us	1ms	4ms	16ms	64ms	256ms	1s	4s	16s	gt	max	tag
0.000	0.068	3.901	95.973	0.048	0.009	0.001	0.000	0.000	0.000	0.365	fbmy8028_rel_withdbg.cy9c4g_gcp_c2s60
0.000	0.039	4.105	95.799	0.045	0.011	0.001	0.000	0.000	0.000	0.397	fbmy8028_rel.cy9c4g_gcp_c2s60
0.000	0.032	3.831	96.081	0.045	0.011	nonzero	0.000	0.000	0.000	0.277	fbmy8028_rel_o2.cy9c4g_gcp_c2s60
0.000	0.039	3.393	96.510	0.050	0.008	0.001	0.000	0.000	0.000	0.346	fbmy8028_rel_native.cy9c4g_gcp_c2s60
0.000	0.017	4.750	95.169	0.047	0.017	0.001	0.000	0.000	0.000	0.312	fbmy8028_rel_o2_lto.cy9c4g_gcp_c2s60
0.000	0.052	4.966	94.929	0.038	0.014	0.001	0.000	0.000	0.000	0.404	fbmy8028_rel_lto.cy9c4g_gcp_c2s60
0.000	0.043	5.387	94.514	0.036	0.018	0.001	0.000	0.000	0.000	0.349	fbmy8028_rel_native_lto.cy9c4g_gcp_c2s60
q100.1
- q100.1: range queries with 100 insert/s per client
- Legend for results is here.
- Each entry lists the percentage of responses that fit in that bucket (slower than max time for previous bucket, faster than min time for next bucket).
Query response time histogram
256us	1ms	4ms	16ms	64ms	256ms	1s	4s	16s	gt	max	tag
65.557	34.438	0.006	nonzero	0.000	0.000	0.000	0.000	0.000	0.000	0.013	fbmy8028_rel_withdbg.cy9c4g_gcp_c2s60
81.913	18.084	0.003	nonzero	nonzero	0.000	0.000	0.000	0.000	0.000	0.028	fbmy8028_rel.cy9c4g_gcp_c2s60
65.791	34.205	0.005	nonzero	nonzero	0.000	0.000	0.000	0.000	0.000	0.024	fbmy8028_rel_o2.cy9c4g_gcp_c2s60
81.172	18.824	0.003	nonzero	nonzero	0.000	0.000	0.000	0.000	0.000	0.016	fbmy8028_rel_native.cy9c4g_gcp_c2s60
82.972	17.025	0.003	nonzero	0.000	0.000	0.000	0.000	0.000	0.000	0.015	fbmy8028_rel_o2_lto.cy9c4g_gcp_c2s60
82.084	17.913	0.003	nonzero	nonzero	0.000	0.000	0.000	0.000	0.000	0.017	fbmy8028_rel_lto.cy9c4g_gcp_c2s60
81.609	18.388	0.003	nonzero	0.000	0.000	0.000	0.000	0.000	0.000	0.016	fbmy8028_rel_native_lto.cy9c4g_gcp_c2s60
Insert response time histogram
256us	1ms	4ms	16ms	64ms	256ms	1s	4s	16s	gt	max	tag
0.000	0.000	89.031	10.969	0.000	0.000	0.000	0.000	0.000	0.000	0.015	fbmy8028_rel_withdbg.cy9c4g_gcp_c2s60
0.000	0.000	95.472	4.528	0.000	0.000	0.000	0.000	0.000	0.000	0.010	fbmy8028_rel.cy9c4g_gcp_c2s60
0.000	0.000	98.211	1.765	0.024	0.000	0.000	0.000	0.000	0.000	0.032	fbmy8028_rel_o2.cy9c4g_gcp_c2s60
0.000	0.004	99.519	0.476	0.000	0.000	0.000	0.000	0.000	0.000	0.012	fbmy8028_rel_native.cy9c4g_gcp_c2s60
0.000	0.004	95.511	4.485	0.000	0.000	0.000	0.000	0.000	0.000	0.014	fbmy8028_rel_o2_lto.cy9c4g_gcp_c2s60
0.000	0.008	98.647	1.344	0.000	0.000	0.000	0.000	0.000	0.000	0.008	fbmy8028_rel_lto.cy9c4g_gcp_c2s60
0.000	0.019	99.597	0.382	0.001	0.000	0.000	0.000	0.000	0.000	0.017	fbmy8028_rel_native_lto.cy9c4g_gcp_c2s60
q500.1
- q500.1: range queries with 500 insert/s per client
- Legend for results is here.
- Each entry lists the percentage of responses that fit in that bucket (slower than max time for previous bucket, faster than min time for next bucket).
Query response time histogram
256us	1ms	4ms	16ms	64ms	256ms	1s	4s	16s	gt	max	tag
59.231	40.739	0.029	0.001	nonzero	0.000	0.000	0.000	0.000	0.000	0.043	fbmy8028_rel_withdbg.cy9c4g_gcp_c2s60
74.620	25.356	0.024	0.001	nonzero	0.000	0.000	0.000	0.000	0.000	0.024	fbmy8028_rel.cy9c4g_gcp_c2s60
58.325	41.645	0.029	0.001	nonzero	0.000	0.000	0.000	0.000	0.000	0.055	fbmy8028_rel_o2.cy9c4g_gcp_c2s60
74.603	25.372	0.024	0.001	nonzero	0.000	0.000	0.000	0.000	0.000	0.023	fbmy8028_rel_native.cy9c4g_gcp_c2s60
75.684	24.291	0.024	0.001	nonzero	0.000	0.000	0.000	0.000	0.000	0.031	fbmy8028_rel_o2_lto.cy9c4g_gcp_c2s60
76.458	23.519	0.023	0.001	nonzero	0.000	0.000	0.000	0.000	0.000	0.042	fbmy8028_rel_lto.cy9c4g_gcp_c2s60
75.953	24.024	0.022	0.001	nonzero	0.000	0.000	0.000	0.000	0.000	0.049	fbmy8028_rel_native_lto.cy9c4g_gcp_c2s60
Insert response time histogram
256us	1ms	4ms	16ms	64ms	256ms	1s	4s	16s	gt	max	tag
0.000	0.000	16.327	83.189	0.483	0.000	0.000	0.000	0.000	0.000	0.030	fbmy8028_rel_withdbg.cy9c4g_gcp_c2s60
0.000	0.000	15.661	83.887	0.453	0.000	0.000	0.000	0.000	0.000	0.029	fbmy8028_rel.cy9c4g_gcp_c2s60
0.000	0.000	16.419	83.112	0.469	0.000	0.000	0.000	0.000	0.000	0.063	fbmy8028_rel_o2.cy9c4g_gcp_c2s60
0.000	0.001	15.857	83.719	0.423	0.000	0.000	0.000	0.000	0.000	0.031	fbmy8028_rel_native.cy9c4g_gcp_c2s60
0.000	0.001	15.698	83.881	0.420	0.000	0.000	0.000	0.000	0.000	0.034	fbmy8028_rel_o2_lto.cy9c4g_gcp_c2s60
0.000	0.001	17.194	82.486	0.318	0.000	0.000	0.000	0.000	0.000	0.028	fbmy8028_rel_lto.cy9c4g_gcp_c2s60
0.000	nonzero	16.435	83.221	0.344	0.000	0.000	0.000	0.000	0.000	0.031	fbmy8028_rel_native_lto.cy9c4g_gcp_c2s60
q1000.1
- q1000.1: range queries with 1000 insert/s per client
- Legend for results is here.
- Each entry lists the percentage of responses that fit in that bucket (slower than max time for previous bucket, faster than min time for next bucket).
Query response time histogram
256us	1ms	4ms	16ms	64ms	256ms	1s	4s	16s	gt	max	tag
50.502	49.449	0.048	0.001	nonzero	0.000	0.000	0.000	0.000	0.000	0.048	fbmy8028_rel_withdbg.cy9c4g_gcp_c2s60
63.895	36.064	0.040	0.001	nonzero	0.000	0.000	0.000	0.000	0.000	0.037	fbmy8028_rel.cy9c4g_gcp_c2s60
49.589	50.362	0.048	0.001	nonzero	0.000	0.000	0.000	0.000	0.000	0.034	fbmy8028_rel_o2.cy9c4g_gcp_c2s60
64.354	35.605	0.040	0.001	nonzero	0.000	0.000	0.000	0.000	0.000	0.039	fbmy8028_rel_native.cy9c4g_gcp_c2s60
65.289	34.671	0.040	0.001	nonzero	0.000	0.000	0.000	0.000	0.000	0.031	fbmy8028_rel_o2_lto.cy9c4g_gcp_c2s60
66.880	33.080	0.039	0.001	nonzero	0.000	0.000	0.000	0.000	0.000	0.029	fbmy8028_rel_lto.cy9c4g_gcp_c2s60
66.275	33.685	0.039	0.001	nonzero	0.000	0.000	0.000	0.000	0.000	0.034	fbmy8028_rel_native_lto.cy9c4g_gcp_c2s60
Insert response time histogram
256us	1ms	4ms	16ms	64ms	256ms	1s	4s	16s	gt	max	tag
0.000	0.000	25.244	74.238	0.518	0.000	0.000	0.000	0.000	0.000	0.037	fbmy8028_rel_withdbg.cy9c4g_gcp_c2s60
0.000	0.005	24.452	74.948	0.594	0.000	0.000	0.000	0.000	0.000	0.038	fbmy8028_rel.cy9c4g_gcp_c2s60
0.000	nonzero	25.131	74.289	0.580	0.000	0.000	0.000	0.000	0.000	0.044	fbmy8028_rel_o2.cy9c4g_gcp_c2s60
0.000	nonzero	24.385	75.004	0.610	0.000	0.000	0.000	0.000	0.000	0.035	fbmy8028_rel_native.cy9c4g_gcp_c2s60
0.000	0.000	24.359	75.094	0.547	0.000	0.000	0.000	0.000	0.000	0.039	fbmy8028_rel_o2_lto.cy9c4g_gcp_c2s60
0.000	0.007	24.907	74.639	0.448	0.000	0.000	0.000	0.000	0.000	0.047	fbmy8028_rel_lto.cy9c4g_gcp_c2s60
0.000	0.003	25.428	74.119	0.450	0.000	0.000	0.000	0.000	0.000	0.034	fbmy8028_rel_native_lto.cy9c4g_gcp_c2s60