Introduction
This is a report for the insert benchmark with 400M docs and 20 client(s). It is generated by scripts (bash, awk, sed) and Tufte might not be impressed. An overview of the insert benchmark is here and a short update is here. Below, by DBMS, I mean DBMS+version.config. An example is my8020.c10b40 where my means MySQL, 8020 is version 8.0.20 and c10b40 is the name for the configuration file.
The test server is c2-standard-60 from GCP with 30 cores, hyperthreading disabled, 240G RAM and 3T of NVMe storage. The benchmark was run with 20 clients and there were 1 or 2 connections per client (1 for queries, 1 for inserts). The benchmark loads 400M rows without secondary indexes, creates secondary indexes, loads another 400M rows then does 3 read+write tests for 1800 seconds each that do queries as fast as possible with 100, 500 and then 1000 writes/second/client concurrent with the queries. All clients share one table. The database is cached by the OS page cache but not the storage engine. Clients and the DBMS share one server. The per-database configs are in the per-database subdirectories here.
The tested DBMS are:
- fbmy5635_rel.cy9c4g_gcp_c2s60 - MyRocks 5.6.35, the cy9c4g_gcp_c2s60 config and compiled with CMAKE_BUILD_TYPE=Release and -O3
- fbmy8028_rel_lto.cy9c4g_gcp_c2s60 - MyRocks 8.0.28, the cy9c4g_gcp_c2s60 config and compiled with CMAKE_BUILD_TYPE=Release and -O3 -flto
Contents
- Summary
- l.i0: load without secondary indexes
- l.x: create secondary indexes
- l.i1: continue load after secondary indexes created
- q100.1: range queries with 100 insert/s per client
- q500.1: range queries with 500 insert/s per client
- q1000.1: range queries with 1000 insert/s per client
Summary
The numbers are inserts/s for l.i0 and l.i1, indexed docs (or rows) /s for l.x and queries/s for q*.2. The values are the average rate over the entire test for inserts (IPS) and queries (QPS). The range of values for IPS and QPS is split into 3 parts: bottom 25%, middle 50%, top 25%. Values in the bottom 25% have a red background, values in the top 25% have a green background and values in the middle have no color. A gray background is used for values that can be ignored because the DBMS did not sustain the target insert rate. Red backgrounds are not used when the minimum value is within 80% of the max value.
| dbms | l.i0 | l.x | l.i1 | q100.1 | q500.1 | q1000.1 |
|---|---|---|---|---|---|---|
| 400m.fbmy5635_rel.cy9c4g_gcp_c2s60 | 727273 | 101010 | 151286 | 70778 | 69230 | 66332 |
| 400m.fbmy8028_rel_native_lto.cy9c4g_gcp_c2s60 | 728597 | 107786 | 159808 | 82778 | 80883 | 77800 |
This table has relative throughput, throughput for the DBMS relative to the DBMS in the first line, using the absolute throughput from the previous table.
| dbms | l.i0 | l.x | l.i1 | q100.1 | q500.1 | q1000.1 |
|---|---|---|---|---|---|---|
| 400m.fbmy5635_rel.cy9c4g_gcp_c2s60 | 1.00 | 1.00 | 1.00 | 1.00 | 1.00 | 1.00 |
| 400m.fbmy8028_rel_native_lto.cy9c4g_gcp_c2s60 | 1.00 | 1.07 | 1.06 | 1.17 | 1.17 | 1.17 |
This lists the average rate of inserts/s for the tests that do inserts concurrent with queries. For such tests the query rate is listed in the table above. The read+write tests are setup so that the insert rate should match the target rate every second. Cells that are not at least 95% of the target have a red background to indicate a failure to satisfy the target.
| dbms | q100.1 | q500.1 | q1000.1 |
|---|---|---|---|
| fbmy5635_rel.cy9c4g_gcp_c2s60 | 1976 | 9890 | 19769 |
| fbmy8028_rel_native_lto.cy9c4g_gcp_c2s60 | 1976 | 9885 | 19769 |
| target | 2000 | 10000 | 20000 |
l.i0
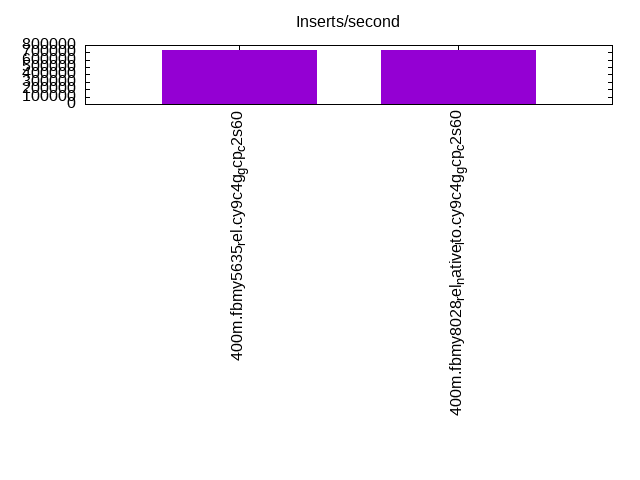
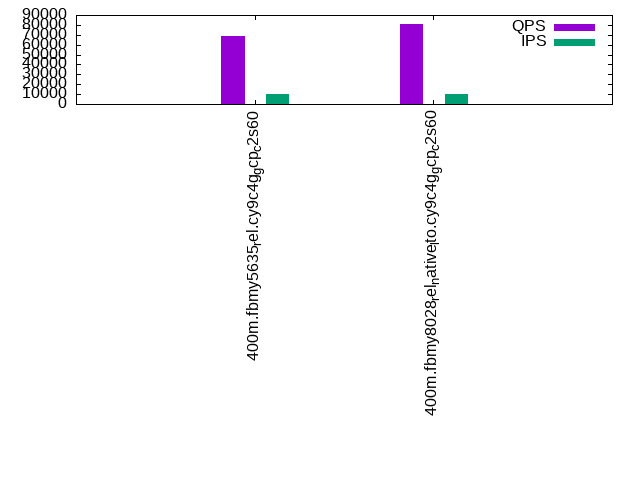
l.i0: load without secondary indexes. Graphs for performance per 1-second interval are here.
Average throughput:
Insert response time histogram: each cell has the percentage of responses that take <= the time in the header and max is the max response time in seconds. For the max column values in the top 25% of the range have a red background and in the bottom 25% of the range have a green background. The red background is not used when the min value is within 80% of the max value.
| dbms | 256us | 1ms | 4ms | 16ms | 64ms | 256ms | 1s | 4s | 16s | gt | max |
|---|---|---|---|---|---|---|---|---|---|---|---|
| fbmy5635_rel.cy9c4g_gcp_c2s60 | 1.502 | 98.361 | 0.100 | 0.002 | 0.035 | 0.001 | 0.264 | ||||
| fbmy8028_rel_native_lto.cy9c4g_gcp_c2s60 | 0.515 | 98.689 | 0.757 | 0.004 | 0.036 | 0.243 |
Performance metrics for the DBMS listed above. Some are normalized by throughput, others are not. Legend for results is here.
ips	qps	rps	rmbps	wps	wmbps	rpq	rkbpq	wpi	wkbpi	csps	cpups	cspq	cpupq	dbgb1	dbgb2	rss	maxop	p50	p99	tag
727273	0	0	0.0	550.8	152.5	0.000	0.000	0.001	0.215	136590	39.0	0.188	16	12.6	12.9	NA	0.264	37974	28879	400m.fbmy5635_rel.cy9c4g_gcp_c2s60
728597	0	0	0.0	460.1	110.8	0.000	0.000	0.001	0.156	135114	44.6	0.185	18	12.5	13.0	1.7	0.243	38158	29468	400m.fbmy8028_rel_native_lto.cy9c4g_gcp_c2s60
l.x
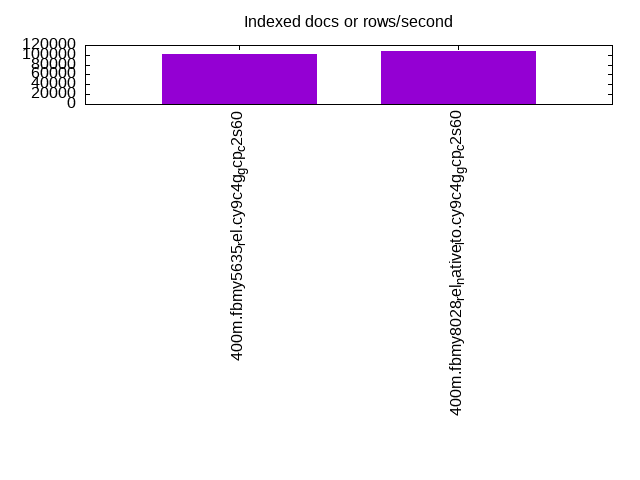
l.x: create secondary indexes.
Average throughput:
Performance metrics for the DBMS listed above. Some are normalized by throughput, others are not. Legend for results is here.
ips	qps	rps	rmbps	wps	wmbps	rpq	rkbpq	wpi	wkbpi	csps	cpups	cspq	cpupq	dbgb1	dbgb2	rss	maxop	p50	p99	tag
101010	0	0	0.0	47.8	13.5	0.000	0.000	0.000	0.137	592	2.9	0.006	9	25.3	25.7	NA	0.001	NA	NA	400m.fbmy5635_rel.cy9c4g_gcp_c2s60
107786	0	0	0.0	38.4	11.5	0.000	0.000	0.000	0.109	792	2.9	0.007	8	25.3	25.8	6.0	0.002	NA	NA	400m.fbmy8028_rel_native_lto.cy9c4g_gcp_c2s60
l.i1
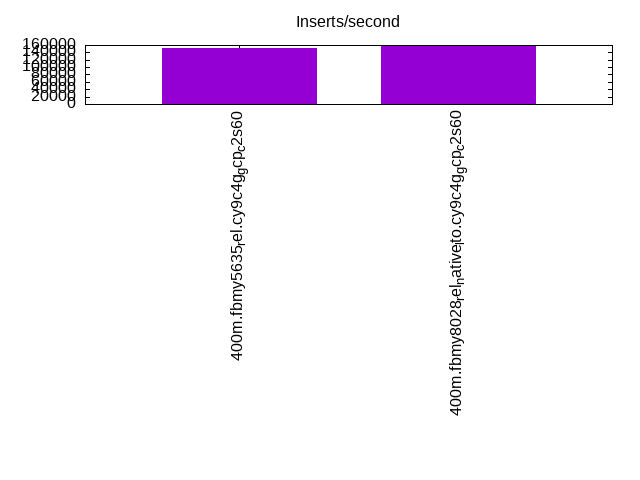
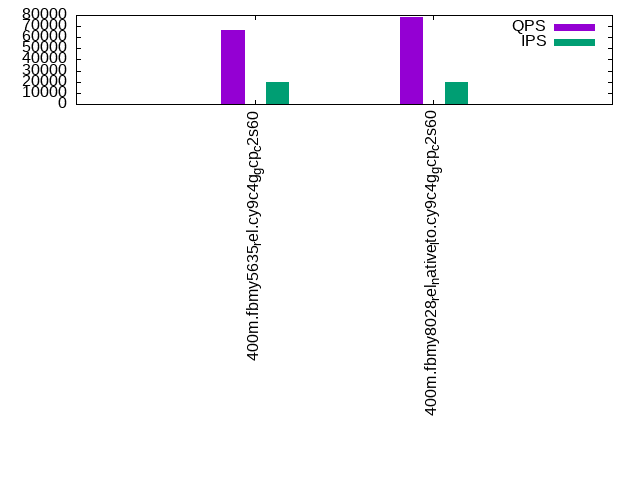
l.i1: continue load after secondary indexes created. Graphs for performance per 1-second interval are here.
Average throughput:
Insert response time histogram: each cell has the percentage of responses that take <= the time in the header and max is the max response time in seconds. For the max column values in the top 25% of the range have a red background and in the bottom 25% of the range have a green background. The red background is not used when the min value is within 80% of the max value.
| dbms | 256us | 1ms | 4ms | 16ms | 64ms | 256ms | 1s | 4s | 16s | gt | max |
|---|---|---|---|---|---|---|---|---|---|---|---|
| fbmy5635_rel.cy9c4g_gcp_c2s60 | 0.060 | 7.484 | 92.420 | 0.031 | 0.005 | 0.208 | |||||
| fbmy8028_rel_native_lto.cy9c4g_gcp_c2s60 | 0.043 | 5.387 | 94.514 | 0.036 | 0.018 | 0.001 | 0.349 |
Performance metrics for the DBMS listed above. Some are normalized by throughput, others are not. Legend for results is here.
ips	qps	rps	rmbps	wps	wmbps	rpq	rkbpq	wpi	wkbpi	csps	cpups	cspq	cpupq	dbgb1	dbgb2	rss	maxop	p50	p99	tag
151286	0	15	2.4	622.6	186.5	0.000	0.017	0.004	1.262	139305	29.4	0.921	58	54.5	55.5	NA	0.208	7591	6945	400m.fbmy5635_rel.cy9c4g_gcp_c2s60
159808	0	12	2.5	512.3	119.3	0.000	0.016	0.003	0.765	150452	33.2	0.941	62	53.6	54.8	5.1	0.349	7991	6443	400m.fbmy8028_rel_native_lto.cy9c4g_gcp_c2s60
q100.1
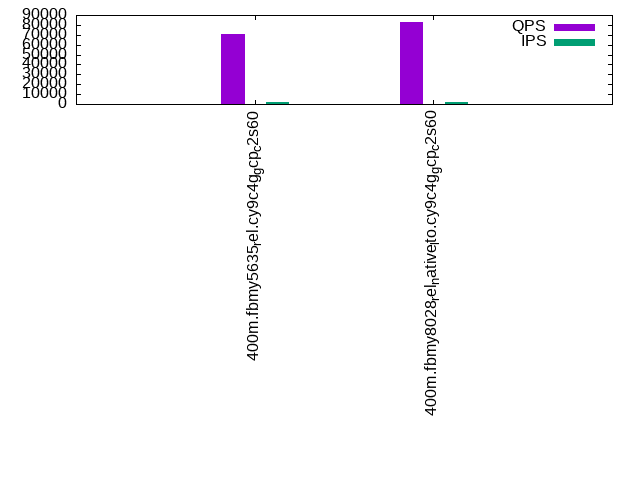
q100.1: range queries with 100 insert/s per client. Graphs for performance per 1-second interval are here.
Average throughput:
Query response time histogram: each cell has the percentage of responses that take <= the time in the header and max is the max response time in seconds. For max values in the top 25% of the range have a red background and in the bottom 25% of the range have a green background. The red background is not used when the min value is within 80% of the max value.
| dbms | 256us | 1ms | 4ms | 16ms | 64ms | 256ms | 1s | 4s | 16s | gt | max |
|---|---|---|---|---|---|---|---|---|---|---|---|
| fbmy5635_rel.cy9c4g_gcp_c2s60 | 30.707 | 69.289 | 0.003 | nonzero | nonzero | 0.051 | |||||
| fbmy8028_rel_native_lto.cy9c4g_gcp_c2s60 | 81.609 | 18.388 | 0.003 | nonzero | 0.016 |
Insert response time histogram: each cell has the percentage of responses that take <= the time in the header and max is the max response time in seconds. For max values in the top 25% of the range have a red background and in the bottom 25% of the range have a green background. The red background is not used when the min value is within 80% of the max value.
| dbms | 256us | 1ms | 4ms | 16ms | 64ms | 256ms | 1s | 4s | 16s | gt | max |
|---|---|---|---|---|---|---|---|---|---|---|---|
| fbmy5635_rel.cy9c4g_gcp_c2s60 | 0.026 | 99.254 | 0.719 | 0.010 | |||||||
| fbmy8028_rel_native_lto.cy9c4g_gcp_c2s60 | 0.019 | 99.597 | 0.382 | 0.001 | 0.017 |
Performance metrics for the DBMS listed above. Some are normalized by throughput, others are not. Legend for results is here.
ips	qps	rps	rmbps	wps	wmbps	rpq	rkbpq	wpi	wkbpi	csps	cpups	cspq	cpupq	dbgb1	dbgb2	rss	maxop	p50	p99	tag
1976	70778	0	0.0	18.5	5.0	0.000	0.000	0.009	2.580	292942	64.9	4.139	275	52.4	53.9	NA	0.051	3580	3276	400m.fbmy5635_rel.cy9c4g_gcp_c2s60
1976	82778	0	0.0	23.7	3.7	0.000	0.000	0.012	1.940	323952	66.0	3.913	239	52.3	54.0	5.3	0.016	4171	3804	400m.fbmy8028_rel_native_lto.cy9c4g_gcp_c2s60
q500.1
q500.1: range queries with 500 insert/s per client. Graphs for performance per 1-second interval are here.
Average throughput:
Query response time histogram: each cell has the percentage of responses that take <= the time in the header and max is the max response time in seconds. For max values in the top 25% of the range have a red background and in the bottom 25% of the range have a green background. The red background is not used when the min value is within 80% of the max value.
| dbms | 256us | 1ms | 4ms | 16ms | 64ms | 256ms | 1s | 4s | 16s | gt | max |
|---|---|---|---|---|---|---|---|---|---|---|---|
| fbmy5635_rel.cy9c4g_gcp_c2s60 | 24.487 | 75.484 | 0.028 | 0.001 | nonzero | 0.042 | |||||
| fbmy8028_rel_native_lto.cy9c4g_gcp_c2s60 | 75.953 | 24.024 | 0.022 | 0.001 | nonzero | 0.049 |
Insert response time histogram: each cell has the percentage of responses that take <= the time in the header and max is the max response time in seconds. For max values in the top 25% of the range have a red background and in the bottom 25% of the range have a green background. The red background is not used when the min value is within 80% of the max value.
| dbms | 256us | 1ms | 4ms | 16ms | 64ms | 256ms | 1s | 4s | 16s | gt | max |
|---|---|---|---|---|---|---|---|---|---|---|---|
| fbmy5635_rel.cy9c4g_gcp_c2s60 | 0.001 | 10.253 | 88.440 | 1.306 | 0.035 | ||||||
| fbmy8028_rel_native_lto.cy9c4g_gcp_c2s60 | nonzero | 16.435 | 83.221 | 0.344 | 0.031 |
Performance metrics for the DBMS listed above. Some are normalized by throughput, others are not. Legend for results is here.
ips	qps	rps	rmbps	wps	wmbps	rpq	rkbpq	wpi	wkbpi	csps	cpups	cspq	cpupq	dbgb1	dbgb2	rss	maxop	p50	p99	tag
9890	69230	0	0.0	51.4	14.8	0.000	0.000	0.005	1.534	279025	66.2	4.030	287	53.6	55.4	NA	0.042	3486	3196	400m.fbmy5635_rel.cy9c4g_gcp_c2s60
9885	80883	0	0.0	47.8	8.5	0.000	0.000	0.005	0.885	315965	67.1	3.906	249	53.5	55.4	5.3	0.049	4123	3756	400m.fbmy8028_rel_native_lto.cy9c4g_gcp_c2s60
q1000.1
q1000.1: range queries with 1000 insert/s per client. Graphs for performance per 1-second interval are here.
Average throughput:
Query response time histogram: each cell has the percentage of responses that take <= the time in the header and max is the max response time in seconds. For max values in the top 25% of the range have a red background and in the bottom 25% of the range have a green background. The red background is not used when the min value is within 80% of the max value.
| dbms | 256us | 1ms | 4ms | 16ms | 64ms | 256ms | 1s | 4s | 16s | gt | max |
|---|---|---|---|---|---|---|---|---|---|---|---|
| fbmy5635_rel.cy9c4g_gcp_c2s60 | 14.603 | 85.345 | 0.050 | 0.001 | nonzero | 0.050 | |||||
| fbmy8028_rel_native_lto.cy9c4g_gcp_c2s60 | 66.275 | 33.685 | 0.039 | 0.001 | nonzero | 0.034 |
Insert response time histogram: each cell has the percentage of responses that take <= the time in the header and max is the max response time in seconds. For max values in the top 25% of the range have a red background and in the bottom 25% of the range have a green background. The red background is not used when the min value is within 80% of the max value.
| dbms | 256us | 1ms | 4ms | 16ms | 64ms | 256ms | 1s | 4s | 16s | gt | max |
|---|---|---|---|---|---|---|---|---|---|---|---|
| fbmy5635_rel.cy9c4g_gcp_c2s60 | 0.003 | 15.153 | 83.734 | 1.110 | 0.037 | ||||||
| fbmy8028_rel_native_lto.cy9c4g_gcp_c2s60 | 0.003 | 25.428 | 74.119 | 0.450 | 0.034 |
Performance metrics for the DBMS listed above. Some are normalized by throughput, others are not. Legend for results is here.
ips	qps	rps	rmbps	wps	wmbps	rpq	rkbpq	wpi	wkbpi	csps	cpups	cspq	cpupq	dbgb1	dbgb2	rss	maxop	p50	p99	tag
19769	66332	0	0.0	105.1	31.4	0.000	0.000	0.005	1.625	261855	68.2	3.948	308	55.9	56.2	NA	0.050	3340	3085	400m.fbmy5635_rel.cy9c4g_gcp_c2s60
19769	77800	0	0.0	88.2	17.9	0.000	0.000	0.004	0.927	299809	68.8	3.854	265	56.2	56.7	5.4	0.034	3933	3596	400m.fbmy8028_rel_native_lto.cy9c4g_gcp_c2s60
l.i0
l.i0: load without secondary indexes
Performance metrics for all DBMS, not just the ones listed above. Some are normalized by throughput, others are not. Legend for results is here.
ips	qps	rps	rmbps	wps	wmbps	rpq	rkbpq	wpi	wkbpi	csps	cpups	cspq	cpupq	dbgb1	dbgb2	rss	maxop	p50	p99	tag
727273	0	0	0.0	550.8	152.5	0.000	0.000	0.001	0.215	136590	39.0	0.188	16	12.6	12.9	NA	0.264	37974	28879	400m.fbmy5635_rel.cy9c4g_gcp_c2s60
728597	0	0	0.0	460.1	110.8	0.000	0.000	0.001	0.156	135114	44.6	0.185	18	12.5	13.0	1.7	0.243	38158	29468	400m.fbmy8028_rel_native_lto.cy9c4g_gcp_c2s60
l.x
l.x: create secondary indexes
Performance metrics for all DBMS, not just the ones listed above. Some are normalized by throughput, others are not. Legend for results is here.
ips	qps	rps	rmbps	wps	wmbps	rpq	rkbpq	wpi	wkbpi	csps	cpups	cspq	cpupq	dbgb1	dbgb2	rss	maxop	p50	p99	tag
101010	0	0	0.0	47.8	13.5	0.000	0.000	0.000	0.137	592	2.9	0.006	9	25.3	25.7	NA	0.001	NA	NA	400m.fbmy5635_rel.cy9c4g_gcp_c2s60
107786	0	0	0.0	38.4	11.5	0.000	0.000	0.000	0.109	792	2.9	0.007	8	25.3	25.8	6.0	0.002	NA	NA	400m.fbmy8028_rel_native_lto.cy9c4g_gcp_c2s60
l.i1
l.i1: continue load after secondary indexes created
Performance metrics for all DBMS, not just the ones listed above. Some are normalized by throughput, others are not. Legend for results is here.
ips	qps	rps	rmbps	wps	wmbps	rpq	rkbpq	wpi	wkbpi	csps	cpups	cspq	cpupq	dbgb1	dbgb2	rss	maxop	p50	p99	tag
151286	0	15	2.4	622.6	186.5	0.000	0.017	0.004	1.262	139305	29.4	0.921	58	54.5	55.5	NA	0.208	7591	6945	400m.fbmy5635_rel.cy9c4g_gcp_c2s60
159808	0	12	2.5	512.3	119.3	0.000	0.016	0.003	0.765	150452	33.2	0.941	62	53.6	54.8	5.1	0.349	7991	6443	400m.fbmy8028_rel_native_lto.cy9c4g_gcp_c2s60
q100.1
q100.1: range queries with 100 insert/s per client
Performance metrics for all DBMS, not just the ones listed above. Some are normalized by throughput, others are not. Legend for results is here.
ips	qps	rps	rmbps	wps	wmbps	rpq	rkbpq	wpi	wkbpi	csps	cpups	cspq	cpupq	dbgb1	dbgb2	rss	maxop	p50	p99	tag
1976	70778	0	0.0	18.5	5.0	0.000	0.000	0.009	2.580	292942	64.9	4.139	275	52.4	53.9	NA	0.051	3580	3276	400m.fbmy5635_rel.cy9c4g_gcp_c2s60
1976	82778	0	0.0	23.7	3.7	0.000	0.000	0.012	1.940	323952	66.0	3.913	239	52.3	54.0	5.3	0.016	4171	3804	400m.fbmy8028_rel_native_lto.cy9c4g_gcp_c2s60
q500.1
q500.1: range queries with 500 insert/s per client
Performance metrics for all DBMS, not just the ones listed above. Some are normalized by throughput, others are not. Legend for results is here.
ips	qps	rps	rmbps	wps	wmbps	rpq	rkbpq	wpi	wkbpi	csps	cpups	cspq	cpupq	dbgb1	dbgb2	rss	maxop	p50	p99	tag
9890	69230	0	0.0	51.4	14.8	0.000	0.000	0.005	1.534	279025	66.2	4.030	287	53.6	55.4	NA	0.042	3486	3196	400m.fbmy5635_rel.cy9c4g_gcp_c2s60
9885	80883	0	0.0	47.8	8.5	0.000	0.000	0.005	0.885	315965	67.1	3.906	249	53.5	55.4	5.3	0.049	4123	3756	400m.fbmy8028_rel_native_lto.cy9c4g_gcp_c2s60
q1000.1
q1000.1: range queries with 1000 insert/s per client
Performance metrics for all DBMS, not just the ones listed above. Some are normalized by throughput, others are not. Legend for results is here.
ips	qps	rps	rmbps	wps	wmbps	rpq	rkbpq	wpi	wkbpi	csps	cpups	cspq	cpupq	dbgb1	dbgb2	rss	maxop	p50	p99	tag
19769	66332	0	0.0	105.1	31.4	0.000	0.000	0.005	1.625	261855	68.2	3.948	308	55.9	56.2	NA	0.050	3340	3085	400m.fbmy5635_rel.cy9c4g_gcp_c2s60
19769	77800	0	0.0	88.2	17.9	0.000	0.000	0.004	0.927	299809	68.8	3.854	265	56.2	56.7	5.4	0.034	3933	3596	400m.fbmy8028_rel_native_lto.cy9c4g_gcp_c2s60
l.i0
- l.i0: load without secondary indexes
- Legend for results is here.
- Each entry lists the percentage of responses that fit in that bucket (slower than max time for previous bucket, faster than min time for next bucket).
Insert response time histogram
256us	1ms	4ms	16ms	64ms	256ms	1s	4s	16s	gt	max	tag
0.000	1.502	98.361	0.100	0.002	0.035	0.001	0.000	0.000	0.000	0.264	fbmy5635_rel.cy9c4g_gcp_c2s60
0.000	0.515	98.689	0.757	0.004	0.036	0.000	0.000	0.000	0.000	0.243	fbmy8028_rel_native_lto.cy9c4g_gcp_c2s60
l.x
- l.x: create secondary indexes
- Legend for results is here.
- Each entry lists the percentage of responses that fit in that bucket (slower than max time for previous bucket, faster than min time for next bucket).
TODO - determine whether there is data for create index response time
l.i1
- l.i1: continue load after secondary indexes created
- Legend for results is here.
- Each entry lists the percentage of responses that fit in that bucket (slower than max time for previous bucket, faster than min time for next bucket).
Insert response time histogram
256us	1ms	4ms	16ms	64ms	256ms	1s	4s	16s	gt	max	tag
0.000	0.060	7.484	92.420	0.031	0.005	0.000	0.000	0.000	0.000	0.208	fbmy5635_rel.cy9c4g_gcp_c2s60
0.000	0.043	5.387	94.514	0.036	0.018	0.001	0.000	0.000	0.000	0.349	fbmy8028_rel_native_lto.cy9c4g_gcp_c2s60
q100.1
- q100.1: range queries with 100 insert/s per client
- Legend for results is here.
- Each entry lists the percentage of responses that fit in that bucket (slower than max time for previous bucket, faster than min time for next bucket).
Query response time histogram
256us	1ms	4ms	16ms	64ms	256ms	1s	4s	16s	gt	max	tag
30.707	69.289	0.003	nonzero	nonzero	0.000	0.000	0.000	0.000	0.000	0.051	fbmy5635_rel.cy9c4g_gcp_c2s60
81.609	18.388	0.003	nonzero	0.000	0.000	0.000	0.000	0.000	0.000	0.016	fbmy8028_rel_native_lto.cy9c4g_gcp_c2s60
Insert response time histogram
256us	1ms	4ms	16ms	64ms	256ms	1s	4s	16s	gt	max	tag
0.000	0.026	99.254	0.719	0.000	0.000	0.000	0.000	0.000	0.000	0.010	fbmy5635_rel.cy9c4g_gcp_c2s60
0.000	0.019	99.597	0.382	0.001	0.000	0.000	0.000	0.000	0.000	0.017	fbmy8028_rel_native_lto.cy9c4g_gcp_c2s60
q500.1
- q500.1: range queries with 500 insert/s per client
- Legend for results is here.
- Each entry lists the percentage of responses that fit in that bucket (slower than max time for previous bucket, faster than min time for next bucket).
Query response time histogram
256us	1ms	4ms	16ms	64ms	256ms	1s	4s	16s	gt	max	tag
24.487	75.484	0.028	0.001	nonzero	0.000	0.000	0.000	0.000	0.000	0.042	fbmy5635_rel.cy9c4g_gcp_c2s60
75.953	24.024	0.022	0.001	nonzero	0.000	0.000	0.000	0.000	0.000	0.049	fbmy8028_rel_native_lto.cy9c4g_gcp_c2s60
Insert response time histogram
256us	1ms	4ms	16ms	64ms	256ms	1s	4s	16s	gt	max	tag
0.000	0.001	10.253	88.440	1.306	0.000	0.000	0.000	0.000	0.000	0.035	fbmy5635_rel.cy9c4g_gcp_c2s60
0.000	nonzero	16.435	83.221	0.344	0.000	0.000	0.000	0.000	0.000	0.031	fbmy8028_rel_native_lto.cy9c4g_gcp_c2s60
q1000.1
- q1000.1: range queries with 1000 insert/s per client
- Legend for results is here.
- Each entry lists the percentage of responses that fit in that bucket (slower than max time for previous bucket, faster than min time for next bucket).
Query response time histogram
256us	1ms	4ms	16ms	64ms	256ms	1s	4s	16s	gt	max	tag
14.603	85.345	0.050	0.001	nonzero	0.000	0.000	0.000	0.000	0.000	0.050	fbmy5635_rel.cy9c4g_gcp_c2s60
66.275	33.685	0.039	0.001	nonzero	0.000	0.000	0.000	0.000	0.000	0.034	fbmy8028_rel_native_lto.cy9c4g_gcp_c2s60
Insert response time histogram
256us	1ms	4ms	16ms	64ms	256ms	1s	4s	16s	gt	max	tag
0.000	0.003	15.153	83.734	1.110	0.000	0.000	0.000	0.000	0.000	0.037	fbmy5635_rel.cy9c4g_gcp_c2s60
0.000	0.003	25.428	74.119	0.450	0.000	0.000	0.000	0.000	0.000	0.034	fbmy8028_rel_native_lto.cy9c4g_gcp_c2s60