Introduction
This is a report for the insert benchmark with 400M docs and 20 client(s). It is generated by scripts (bash, awk, sed) and Tufte might not be impressed. An overview of the insert benchmark is here and a short update is here. Below, by DBMS, I mean DBMS+version.config. An example is my8020.c10b40 where my means MySQL, 8020 is version 8.0.20 and c10b40 is the name for the configuration file.
The test server is c2-standard-60 from GCP with 30 cores, hyperthreading disabled, 240G RAM and 3T of NVMe storage. The benchmark was run with 20 clients and there were 1 or 2 connections per client (1 for queries, 1 for inserts). The benchmark loads 400M rows without secondary indexes, creates secondary indexes, loads another 400M rows then does 3 read+write tests for 1800 seconds each that do queries as fast as possible with 100, 500 and then 1000 writes/second/client concurrent with the queries. There was 1 table per client. The database is cached by the storage engine and the only IO is for writes. Clients and the DBMS share one server. The per-database configs are in the per-database subdirectories here.
The tested DBMS are:
- fbmy8028_rel_withdbg.cy9c_gcp_c2s60 - MyRocks 8.0.28, the cy9c_gcp_c2s60 config and compiled with CMAKE_BUILD_TYPE=RelWithDebInfo and -O2
- fbmy8028_rel.cy9c_gcp_c2s60 - MyRocks 8.0.28, the cy9c_gcp_c2s60 config and compiled with CMAKE_BUILD_TYPE=Release and -O3
- fbmy8028_rel_o2.cy9c_gcp_c2s60 - MyRocks 8.0.28, the cy9c_gcp_c2s60 config and compiled with CMAKE_BUILD_TYPE=Release and -O2
- fbmy8028_rel_native.cy9c_gcp_c2s60 - MyRocks 8.0.28, the cy9c_gcp_c2s60 config and compiled with CMAKE_BUILD_TYPE=Release and -O3 -march=native -mtune=native
- fbmy8028_rel_o2_lto.cy9c_gcp_c2s60 - MyRocks 8.0.28, the cy9c_gcp_c2s60 config and compiled with CMAKE_BUILD_TYPE=Release and -O2 -flto
- fbmy8028_rel_lto.cy9c_gcp_c2s60 - MyRocks 8.0.28, the cy9c_gcp_c2s60 config and compiled with CMAKE_BUILD_TYPE=Release and -O3 -flto
- fbmy8028_rel_native_lto.cy9c_gcp_c2s60 - MyRocks 8.0.28, the cy9c_gcp_c2s60 config and compiled with CMAKE_BUILD_TYPE=Release and -O3 -flto -march=native -mtune=native
Contents
- Summary
- l.i0: load without secondary indexes
- l.x: create secondary indexes
- l.i1: continue load after secondary indexes created
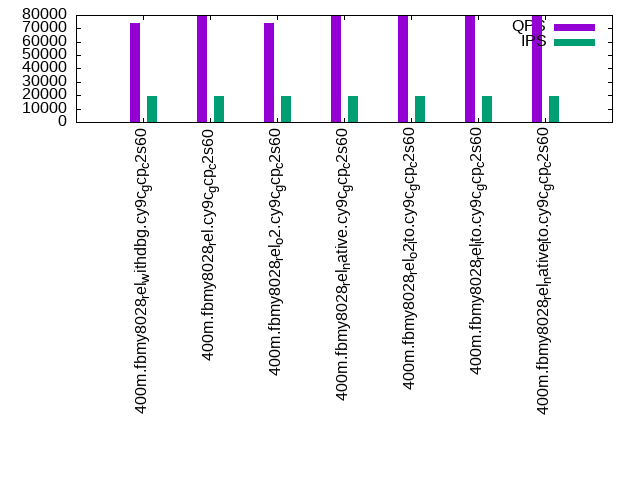
- q100.1: range queries with 100 insert/s per client
- q500.1: range queries with 500 insert/s per client
- q1000.1: range queries with 1000 insert/s per client
Summary
The numbers are inserts/s for l.i0 and l.i1, indexed docs (or rows) /s for l.x and queries/s for q*.2. The values are the average rate over the entire test for inserts (IPS) and queries (QPS). The range of values for IPS and QPS is split into 3 parts: bottom 25%, middle 50%, top 25%. Values in the bottom 25% have a red background, values in the top 25% have a green background and values in the middle have no color. A gray background is used for values that can be ignored because the DBMS did not sustain the target insert rate. Red backgrounds are not used when the minimum value is within 80% of the max value.
| dbms | l.i0 | l.x | l.i1 | q100.1 | q500.1 | q1000.1 |
|---|---|---|---|---|---|---|
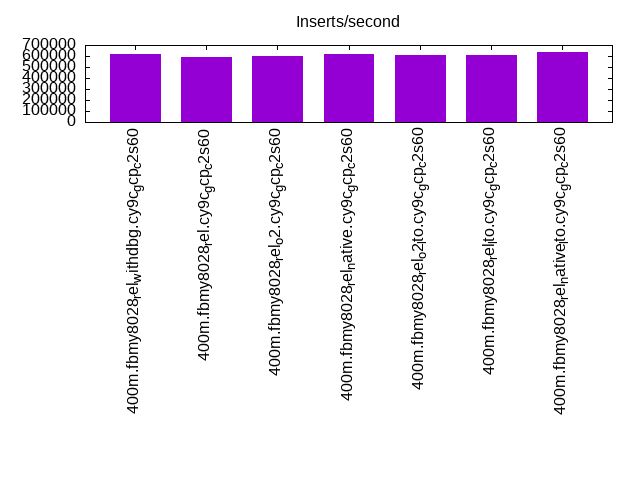
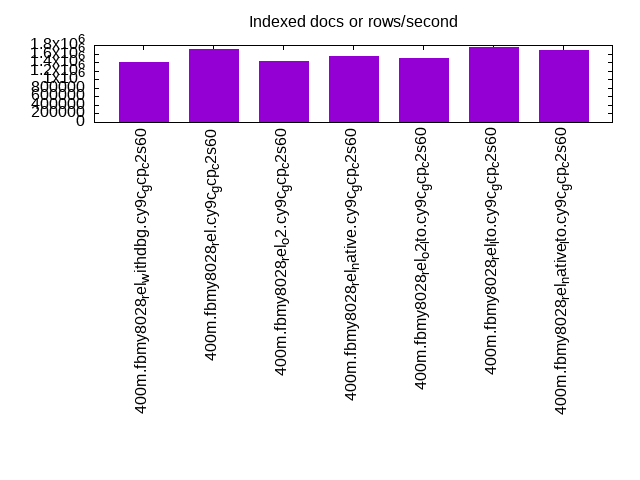
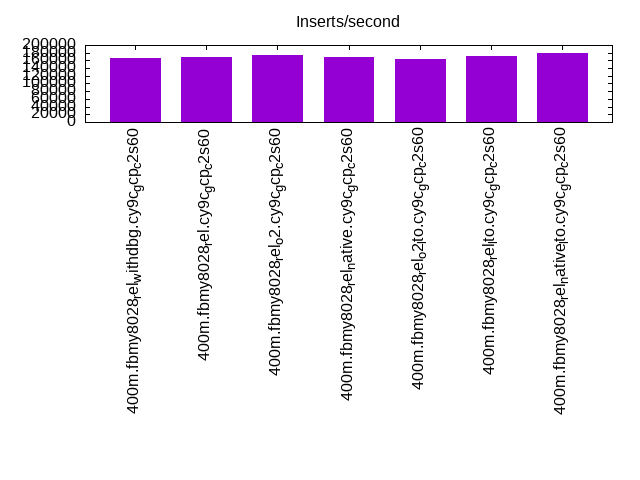
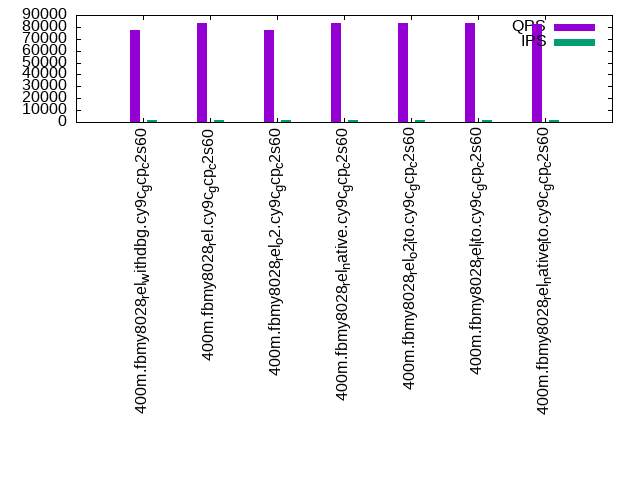
| 400m.fbmy8028_rel_withdbg.cy9c_gcp_c2s60 | 615385 | 1398951 | 167154 | 77048 | 76096 | 73869 |
| 400m.fbmy8028_rel.cy9c_gcp_c2s60 | 589970 | 1717167 | 168776 | 83164 | 82280 | 79192 |
| 400m.fbmy8028_rel_o2.cy9c_gcp_c2s60 | 602410 | 1428928 | 174140 | 77010 | 75774 | 73711 |
| 400m.fbmy8028_rel_native.cy9c_gcp_c2s60 | 619195 | 1532950 | 169924 | 82911 | 82265 | 79189 |
| 400m.fbmy8028_rel_o2_lto.cy9c_gcp_c2s60 | 608828 | 1504135 | 162536 | 83547 | 82600 | 79602 |
| 400m.fbmy8028_rel_lto.cy9c_gcp_c2s60 | 613497 | 1762555 | 171013 | 83632 | 82851 | 79913 |
| 400m.fbmy8028_rel_native_lto.cy9c_gcp_c2s60 | 632911 | 1688186 | 180424 | 82640 | 82027 | 79462 |
This table has relative throughput, throughput for the DBMS relative to the DBMS in the first line, using the absolute throughput from the previous table.
| dbms | l.i0 | l.x | l.i1 | q100.1 | q500.1 | q1000.1 |
|---|---|---|---|---|---|---|
| 400m.fbmy8028_rel_withdbg.cy9c_gcp_c2s60 | 1.00 | 1.00 | 1.00 | 1.00 | 1.00 | 1.00 |
| 400m.fbmy8028_rel.cy9c_gcp_c2s60 | 0.96 | 1.23 | 1.01 | 1.08 | 1.08 | 1.07 |
| 400m.fbmy8028_rel_o2.cy9c_gcp_c2s60 | 0.98 | 1.02 | 1.04 | 1.00 | 1.00 | 1.00 |
| 400m.fbmy8028_rel_native.cy9c_gcp_c2s60 | 1.01 | 1.10 | 1.02 | 1.08 | 1.08 | 1.07 |
| 400m.fbmy8028_rel_o2_lto.cy9c_gcp_c2s60 | 0.99 | 1.08 | 0.97 | 1.08 | 1.09 | 1.08 |
| 400m.fbmy8028_rel_lto.cy9c_gcp_c2s60 | 1.00 | 1.26 | 1.02 | 1.09 | 1.09 | 1.08 |
| 400m.fbmy8028_rel_native_lto.cy9c_gcp_c2s60 | 1.03 | 1.21 | 1.08 | 1.07 | 1.08 | 1.08 |
This lists the average rate of inserts/s for the tests that do inserts concurrent with queries. For such tests the query rate is listed in the table above. The read+write tests are setup so that the insert rate should match the target rate every second. Cells that are not at least 95% of the target have a red background to indicate a failure to satisfy the target.
| dbms | q100.1 | q500.1 | q1000.1 |
|---|---|---|---|
| fbmy8028_rel_withdbg.cy9c_gcp_c2s60 | 1977 | 9879 | 19769 |
| fbmy8028_rel.cy9c_gcp_c2s60 | 1976 | 9879 | 19769 |
| fbmy8028_rel_o2.cy9c_gcp_c2s60 | 1976 | 9879 | 19769 |
| fbmy8028_rel_native.cy9c_gcp_c2s60 | 1976 | 9879 | 19769 |
| fbmy8028_rel_o2_lto.cy9c_gcp_c2s60 | 1976 | 9879 | 19769 |
| fbmy8028_rel_lto.cy9c_gcp_c2s60 | 1976 | 9879 | 19769 |
| fbmy8028_rel_native_lto.cy9c_gcp_c2s60 | 1976 | 9879 | 19769 |
| target | 2000 | 10000 | 20000 |
l.i0
l.i0: load without secondary indexes. Graphs for performance per 1-second interval are here.
Average throughput:
Insert response time histogram: each cell has the percentage of responses that take <= the time in the header and max is the max response time in seconds. For the max column values in the top 25% of the range have a red background and in the bottom 25% of the range have a green background. The red background is not used when the min value is within 80% of the max value.
| dbms | 256us | 1ms | 4ms | 16ms | 64ms | 256ms | 1s | 4s | 16s | gt | max |
|---|---|---|---|---|---|---|---|---|---|---|---|
| fbmy8028_rel_withdbg.cy9c_gcp_c2s60 | 0.325 | 93.782 | 5.819 | 0.032 | 0.038 | 0.003 | 0.340 | ||||
| fbmy8028_rel.cy9c_gcp_c2s60 | 0.465 | 87.859 | 11.597 | 0.034 | 0.043 | 0.002 | 0.532 | ||||
| fbmy8028_rel_o2.cy9c_gcp_c2s60 | 0.294 | 91.871 | 7.755 | 0.033 | 0.043 | 0.003 | 0.282 | ||||
| fbmy8028_rel_native.cy9c_gcp_c2s60 | 0.513 | 92.009 | 7.407 | 0.026 | 0.042 | 0.002 | 0.380 | ||||
| fbmy8028_rel_o2_lto.cy9c_gcp_c2s60 | 0.394 | 91.155 | 8.378 | 0.030 | 0.042 | 0.002 | 0.346 | ||||
| fbmy8028_rel_lto.cy9c_gcp_c2s60 | 1.199 | 90.901 | 7.817 | 0.038 | 0.044 | 0.001 | 0.285 | ||||
| fbmy8028_rel_native_lto.cy9c_gcp_c2s60 | 0.529 | 93.214 | 6.183 | 0.032 | 0.037 | 0.004 | 0.376 |
Performance metrics for the DBMS listed above. Some are normalized by throughput, others are not. Legend for results is here.
ips	qps	rps	rmbps	wps	wmbps	rpq	rkbpq	wpi	wkbpi	csps	cpups	cspq	cpupq	dbgb1	dbgb2	rss	maxop	p50	p99	tag
615385	0	0	0.0	594.3	139.8	0.000	0.000	0.001	0.233	480559	63.6	0.781	31	12.8	13.3	3.8	0.340	31665	18180	400m.fbmy8028_rel_withdbg.cy9c_gcp_c2s60
589970	0	0	0.0	628.7	147.9	0.000	0.000	0.001	0.257	496913	64.7	0.842	33	12.9	13.5	4.0	0.532	29967	14691	400m.fbmy8028_rel.cy9c_gcp_c2s60
602410	0	0	0.0	638.9	149.4	0.000	0.000	0.001	0.254	498691	64.8	0.828	32	12.7	13.3	3.9	0.282	30567	19878	400m.fbmy8028_rel_o2.cy9c_gcp_c2s60
619195	0	0	0.0	625.4	144.4	0.000	0.000	0.001	0.239	491979	63.6	0.795	31	12.8	13.3	3.8	0.380	31077	19978	400m.fbmy8028_rel_native.cy9c_gcp_c2s60
608828	0	0	0.0	630.5	146.1	0.000	0.000	0.001	0.246	480143	64.0	0.789	32	12.6	13.2	3.9	0.346	31366	19479	400m.fbmy8028_rel_o2_lto.cy9c_gcp_c2s60
613497	0	0	0.0	640.8	149.0	0.000	0.000	0.001	0.249	507022	63.8	0.826	31	12.8	13.3	3.9	0.285	29977	18783	400m.fbmy8028_rel_lto.cy9c_gcp_c2s60
632911	0	0	0.0	634.5	147.7	0.000	0.000	0.001	0.239	458866	63.3	0.725	30	12.6	13.2	3.8	0.376	32565	15983	400m.fbmy8028_rel_native_lto.cy9c_gcp_c2s60
l.x
l.x: create secondary indexes.
Average throughput:
Performance metrics for the DBMS listed above. Some are normalized by throughput, others are not. Legend for results is here.
ips	qps	rps	rmbps	wps	wmbps	rpq	rkbpq	wpi	wkbpi	csps	cpups	cspq	cpupq	dbgb1	dbgb2	rss	maxop	p50	p99	tag
1398951	0	2	0.2	515.4	151.2	0.000	0.000	0.000	0.111	5278	56.1	0.004	12	27.0	27.5	26.1	0.003	NA	NA	400m.fbmy8028_rel_withdbg.cy9c_gcp_c2s60
1717167	0	3	0.2	635.0	186.6	0.000	0.000	0.000	0.111	6244	58.3	0.004	10	27.0	27.6	26.7	0.048	NA	NA	400m.fbmy8028_rel.cy9c_gcp_c2s60
1428928	0	3	0.2	536.2	146.1	0.000	0.000	0.000	0.105	5526	57.7	0.004	12	27.0	27.5	26.3	0.005	NA	NA	400m.fbmy8028_rel_o2.cy9c_gcp_c2s60
1532950	0	3	0.2	562.8	159.0	0.000	0.000	0.000	0.106	5721	53.0	0.004	10	27.0	27.5	26.2	0.007	NA	NA	400m.fbmy8028_rel_native.cy9c_gcp_c2s60
1504135	0	3	0.2	561.9	156.8	0.000	0.000	0.000	0.107	5610	57.5	0.004	11	26.9	27.5	26.7	0.003	NA	NA	400m.fbmy8028_rel_o2_lto.cy9c_gcp_c2s60
1762555	0	3	0.3	653.3	190.3	0.000	0.000	0.000	0.111	6544	57.7	0.004	10	27.0	27.6	26.5	0.005	NA	NA	400m.fbmy8028_rel_lto.cy9c_gcp_c2s60
1688186	0	3	0.2	628.7	175.6	0.000	0.000	0.000	0.107	6271	55.9	0.004	10	26.9	27.5	26.2	0.004	NA	NA	400m.fbmy8028_rel_native_lto.cy9c_gcp_c2s60
l.i1
l.i1: continue load after secondary indexes created. Graphs for performance per 1-second interval are here.
Average throughput:
Insert response time histogram: each cell has the percentage of responses that take <= the time in the header and max is the max response time in seconds. For the max column values in the top 25% of the range have a red background and in the bottom 25% of the range have a green background. The red background is not used when the min value is within 80% of the max value.
| dbms | 256us | 1ms | 4ms | 16ms | 64ms | 256ms | 1s | 4s | 16s | gt | max |
|---|---|---|---|---|---|---|---|---|---|---|---|
| fbmy8028_rel_withdbg.cy9c_gcp_c2s60 | 0.010 | 10.604 | 88.961 | 0.292 | 0.096 | 0.037 | 0.499 | ||||
| fbmy8028_rel.cy9c_gcp_c2s60 | 0.008 | 10.408 | 88.896 | 0.540 | 0.144 | 0.003 | 0.413 | ||||
| fbmy8028_rel_o2.cy9c_gcp_c2s60 | 0.009 | 10.334 | 89.594 | 0.039 | 0.021 | 0.002 | 0.379 | ||||
| fbmy8028_rel_native.cy9c_gcp_c2s60 | 0.010 | 10.169 | 89.296 | 0.499 | 0.024 | 0.002 | 0.539 | ||||
| fbmy8028_rel_o2_lto.cy9c_gcp_c2s60 | 0.024 | 10.634 | 88.348 | 0.837 | 0.141 | 0.016 | 0.473 | ||||
| fbmy8028_rel_lto.cy9c_gcp_c2s60 | 0.050 | 12.097 | 87.318 | 0.384 | 0.139 | 0.012 | 0.423 | ||||
| fbmy8028_rel_native_lto.cy9c_gcp_c2s60 | 0.052 | 12.570 | 87.109 | 0.245 | 0.022 | 0.002 | 0.397 |
Performance metrics for the DBMS listed above. Some are normalized by throughput, others are not. Legend for results is here.
ips	qps	rps	rmbps	wps	wmbps	rpq	rkbpq	wpi	wkbpi	csps	cpups	cspq	cpupq	dbgb1	dbgb2	rss	maxop	p50	p99	tag
167154	0	14	3.7	546.8	132.8	0.000	0.023	0.003	0.814	186314	36.3	1.115	65	59.6	61.3	43.5	0.499	8843	150	400m.fbmy8028_rel_withdbg.cy9c_gcp_c2s60
168776	0	14	3.7	535.8	132.2	0.000	0.023	0.003	0.802	202492	37.6	1.200	67	58.9	60.6	43.5	0.413	8940	350	400m.fbmy8028_rel.cy9c_gcp_c2s60
174140	0	14	4.0	596.6	142.5	0.000	0.024	0.003	0.838	158770	36.8	0.912	63	62.9	64.6	44.1	0.379	8743	6842	400m.fbmy8028_rel_o2.cy9c_gcp_c2s60
169924	0	14	3.8	556.5	137.6	0.000	0.023	0.003	0.829	179776	36.6	1.058	65	74.6	76.3	43.8	0.539	8741	2298	400m.fbmy8028_rel_native.cy9c_gcp_c2s60
162536	0	13	3.7	522.2	124.7	0.000	0.023	0.003	0.786	198491	36.0	1.221	66	62.3	64.0	43.7	0.473	8740	200	400m.fbmy8028_rel_o2_lto.cy9c_gcp_c2s60
171013	0	14	3.8	561.2	134.6	0.000	0.023	0.003	0.806	205961	36.9	1.204	65	63.6	65.3	43.8	0.423	8990	300	400m.fbmy8028_rel_lto.cy9c_gcp_c2s60
180424	0	15	4.0	612.2	149.7	0.000	0.023	0.003	0.849	171260	37.4	0.949	62	63.2	64.9	43.7	0.397	9140	3996	400m.fbmy8028_rel_native_lto.cy9c_gcp_c2s60
q100.1
q100.1: range queries with 100 insert/s per client. Graphs for performance per 1-second interval are here.
Average throughput:
Query response time histogram: each cell has the percentage of responses that take <= the time in the header and max is the max response time in seconds. For max values in the top 25% of the range have a red background and in the bottom 25% of the range have a green background. The red background is not used when the min value is within 80% of the max value.
| dbms | 256us | 1ms | 4ms | 16ms | 64ms | 256ms | 1s | 4s | 16s | gt | max |
|---|---|---|---|---|---|---|---|---|---|---|---|
| fbmy8028_rel_withdbg.cy9c_gcp_c2s60 | 66.658 | 33.332 | 0.007 | 0.001 | 0.001 | 0.038 | |||||
| fbmy8028_rel.cy9c_gcp_c2s60 | 79.901 | 20.091 | 0.006 | 0.001 | 0.001 | 0.056 | |||||
| fbmy8028_rel_o2.cy9c_gcp_c2s60 | 66.226 | 33.764 | 0.007 | 0.001 | 0.001 | 0.043 | |||||
| fbmy8028_rel_native.cy9c_gcp_c2s60 | 79.634 | 20.359 | 0.005 | 0.001 | 0.001 | 0.050 | |||||
| fbmy8028_rel_o2_lto.cy9c_gcp_c2s60 | 80.297 | 19.696 | 0.005 | 0.001 | 0.001 | nonzero | 0.281 | ||||
| fbmy8028_rel_lto.cy9c_gcp_c2s60 | 80.764 | 19.228 | 0.005 | 0.001 | 0.001 | 0.048 | |||||
| fbmy8028_rel_native_lto.cy9c_gcp_c2s60 | 79.589 | 20.404 | 0.006 | 0.001 | 0.001 | 0.047 |
Insert response time histogram: each cell has the percentage of responses that take <= the time in the header and max is the max response time in seconds. For max values in the top 25% of the range have a red background and in the bottom 25% of the range have a green background. The red background is not used when the min value is within 80% of the max value.
| dbms | 256us | 1ms | 4ms | 16ms | 64ms | 256ms | 1s | 4s | 16s | gt | max |
|---|---|---|---|---|---|---|---|---|---|---|---|
| fbmy8028_rel_withdbg.cy9c_gcp_c2s60 | 0.040 | 99.539 | 0.397 | 0.024 | 0.036 | ||||||
| fbmy8028_rel.cy9c_gcp_c2s60 | 0.169 | 99.472 | 0.344 | 0.014 | 0.028 | ||||||
| fbmy8028_rel_o2.cy9c_gcp_c2s60 | 0.029 | 99.468 | 0.456 | 0.047 | 0.047 | ||||||
| fbmy8028_rel_native.cy9c_gcp_c2s60 | 0.068 | 99.469 | 0.440 | 0.022 | 0.045 | ||||||
| fbmy8028_rel_o2_lto.cy9c_gcp_c2s60 | 0.110 | 99.408 | 0.469 | 0.013 | 0.025 | ||||||
| fbmy8028_rel_lto.cy9c_gcp_c2s60 | 0.935 | 98.722 | 0.267 | 0.076 | 0.044 | ||||||
| fbmy8028_rel_native_lto.cy9c_gcp_c2s60 | 0.581 | 98.965 | 0.418 | 0.036 | 0.025 |
Performance metrics for the DBMS listed above. Some are normalized by throughput, others are not. Legend for results is here.
ips	qps	rps	rmbps	wps	wmbps	rpq	rkbpq	wpi	wkbpi	csps	cpups	cspq	cpupq	dbgb1	dbgb2	rss	maxop	p50	p99	tag
1977	77048	0	0.0	36.5	8.5	0.000	0.000	0.018	4.411	299301	66.5	3.885	259	56.1	58.3	92.7	0.038	3852	2957	400m.fbmy8028_rel_withdbg.cy9c_gcp_c2s60
1976	83164	0	0.0	29.7	6.6	0.000	0.000	0.015	3.415	325374	66.4	3.912	240	56.1	58.3	90.2	0.056	4187	3180	400m.fbmy8028_rel.cy9c_gcp_c2s60
1976	77010	0	0.0	43.9	11.1	0.000	0.000	0.022	5.751	295767	66.7	3.841	260	56.1	58.3	96.0	0.043	3901	3180	400m.fbmy8028_rel_o2.cy9c_gcp_c2s60
1976	82911	0	0.0	43.2	9.8	0.000	0.000	0.022	5.100	323723	66.6	3.904	241	56.1	58.3	90.2	0.050	4187	3085	400m.fbmy8028_rel_native.cy9c_gcp_c2s60
1976	83547	0	0.0	32.8	8.2	0.000	0.000	0.017	4.255	328210	66.4	3.928	238	56.1	58.3	89.2	0.281	4187	3133	400m.fbmy8028_rel_o2_lto.cy9c_gcp_c2s60
1976	83632	0	0.0	33.1	7.9	0.000	0.000	0.017	4.104	327352	66.4	3.914	238	56.1	58.3	90.0	0.048	4267	2877	400m.fbmy8028_rel_lto.cy9c_gcp_c2s60
1976	82640	0	0.0	35.8	7.9	0.000	0.000	0.018	4.109	323796	66.3	3.918	241	56.1	58.3	90.7	0.047	4173	2766	400m.fbmy8028_rel_native_lto.cy9c_gcp_c2s60
q500.1
q500.1: range queries with 500 insert/s per client. Graphs for performance per 1-second interval are here.
Average throughput:

Query response time histogram: each cell has the percentage of responses that take <= the time in the header and max is the max response time in seconds. For max values in the top 25% of the range have a red background and in the bottom 25% of the range have a green background. The red background is not used when the min value is within 80% of the max value.
| dbms | 256us | 1ms | 4ms | 16ms | 64ms | 256ms | 1s | 4s | 16s | gt | max |
|---|---|---|---|---|---|---|---|---|---|---|---|
| fbmy8028_rel_withdbg.cy9c_gcp_c2s60 | 63.077 | 36.893 | 0.029 | 0.001 | nonzero | nonzero | 0.134 | ||||
| fbmy8028_rel.cy9c_gcp_c2s60 | 78.095 | 21.881 | 0.023 | 0.001 | nonzero | 0.019 | |||||
| fbmy8028_rel_o2.cy9c_gcp_c2s60 | 62.039 | 37.933 | 0.028 | 0.001 | nonzero | 0.026 | |||||
| fbmy8028_rel_native.cy9c_gcp_c2s60 | 78.127 | 21.848 | 0.025 | 0.001 | nonzero | 0.020 | |||||
| fbmy8028_rel_o2_lto.cy9c_gcp_c2s60 | 78.396 | 21.578 | 0.025 | 0.001 | nonzero | 0.046 | |||||
| fbmy8028_rel_lto.cy9c_gcp_c2s60 | 78.741 | 21.236 | 0.023 | 0.001 | nonzero | 0.023 | |||||
| fbmy8028_rel_native_lto.cy9c_gcp_c2s60 | 77.417 | 22.559 | 0.023 | 0.001 | nonzero | 0.027 |
Insert response time histogram: each cell has the percentage of responses that take <= the time in the header and max is the max response time in seconds. For max values in the top 25% of the range have a red background and in the bottom 25% of the range have a green background. The red background is not used when the min value is within 80% of the max value.
| dbms | 256us | 1ms | 4ms | 16ms | 64ms | 256ms | 1s | 4s | 16s | gt | max |
|---|---|---|---|---|---|---|---|---|---|---|---|
| fbmy8028_rel_withdbg.cy9c_gcp_c2s60 | 0.006 | 37.434 | 62.430 | 0.126 | 0.005 | 0.151 | |||||
| fbmy8028_rel.cy9c_gcp_c2s60 | 0.086 | 45.383 | 54.433 | 0.097 | 0.027 | ||||||
| fbmy8028_rel_o2.cy9c_gcp_c2s60 | 0.078 | 43.156 | 56.654 | 0.113 | 0.030 | ||||||
| fbmy8028_rel_native.cy9c_gcp_c2s60 | 0.028 | 35.439 | 64.440 | 0.094 | 0.028 | ||||||
| fbmy8028_rel_o2_lto.cy9c_gcp_c2s60 | 0.052 | 36.145 | 63.682 | 0.117 | 0.004 | 0.133 | |||||
| fbmy8028_rel_lto.cy9c_gcp_c2s60 | 0.255 | 49.960 | 49.724 | 0.062 | 0.027 | ||||||
| fbmy8028_rel_native_lto.cy9c_gcp_c2s60 | 0.101 | 47.727 | 52.070 | 0.101 | 0.031 |
Performance metrics for the DBMS listed above. Some are normalized by throughput, others are not. Legend for results is here.
ips	qps	rps	rmbps	wps	wmbps	rpq	rkbpq	wpi	wkbpi	csps	cpups	cspq	cpupq	dbgb1	dbgb2	rss	maxop	p50	p99	tag
9879	76096	0	0.0	44.4	12.5	0.000	0.000	0.004	1.298	295075	67.1	3.878	265	57.4	57.9	111.0	0.134	3820	3532	400m.fbmy8028_rel_withdbg.cy9c_gcp_c2s60
9879	82280	0	0.0	47.0	14.6	0.000	0.000	0.005	1.516	320154	67.3	3.891	245	57.4	57.9	109.9	0.019	4107	3726	400m.fbmy8028_rel.cy9c_gcp_c2s60
9879	75774	0	0.0	46.2	13.5	0.000	0.000	0.005	1.399	293234	67.2	3.870	266	57.4	57.9	115.2	0.026	3805	3502	400m.fbmy8028_rel_o2.cy9c_gcp_c2s60
9879	82265	0	0.0	46.0	13.2	0.000	0.000	0.005	1.371	319830	67.2	3.888	245	57.4	57.9	109.1	0.020	4141	3788	400m.fbmy8028_rel_native.cy9c_gcp_c2s60
9879	82600	0	0.0	46.4	13.1	0.000	0.000	0.005	1.353	322228	67.3	3.901	244	57.4	57.9	110.1	0.046	4141	3772	400m.fbmy8028_rel_o2_lto.cy9c_gcp_c2s60
9879	82851	0	0.0	45.3	12.8	0.000	0.000	0.005	1.325	321460	67.3	3.880	244	57.4	57.9	110.9	0.023	4219	3837	400m.fbmy8028_rel_lto.cy9c_gcp_c2s60
9879	82027	0	0.0	43.8	12.2	0.000	0.000	0.004	1.260	318814	67.1	3.887	245	57.3	57.8	111.9	0.027	4092	3740	400m.fbmy8028_rel_native_lto.cy9c_gcp_c2s60
q1000.1
q1000.1: range queries with 1000 insert/s per client. Graphs for performance per 1-second interval are here.
Average throughput:
Query response time histogram: each cell has the percentage of responses that take <= the time in the header and max is the max response time in seconds. For max values in the top 25% of the range have a red background and in the bottom 25% of the range have a green background. The red background is not used when the min value is within 80% of the max value.
| dbms | 256us | 1ms | 4ms | 16ms | 64ms | 256ms | 1s | 4s | 16s | gt | max |
|---|---|---|---|---|---|---|---|---|---|---|---|
| fbmy8028_rel_withdbg.cy9c_gcp_c2s60 | 54.569 | 45.383 | 0.048 | 0.001 | nonzero | 0.034 | |||||
| fbmy8028_rel.cy9c_gcp_c2s60 | 69.053 | 30.904 | 0.041 | 0.001 | nonzero | 0.031 | |||||
| fbmy8028_rel_o2.cy9c_gcp_c2s60 | 54.284 | 45.668 | 0.047 | 0.001 | nonzero | 0.034 | |||||
| fbmy8028_rel_native.cy9c_gcp_c2s60 | 69.178 | 30.782 | 0.040 | 0.001 | nonzero | 0.027 | |||||
| fbmy8028_rel_o2_lto.cy9c_gcp_c2s60 | 70.049 | 29.910 | 0.040 | 0.001 | nonzero | 0.026 | |||||
| fbmy8028_rel_lto.cy9c_gcp_c2s60 | 70.914 | 29.046 | 0.039 | 0.001 | nonzero | 0.045 | |||||
| fbmy8028_rel_native_lto.cy9c_gcp_c2s60 | 70.071 | 29.888 | 0.039 | 0.001 | nonzero | 0.037 |
Insert response time histogram: each cell has the percentage of responses that take <= the time in the header and max is the max response time in seconds. For max values in the top 25% of the range have a red background and in the bottom 25% of the range have a green background. The red background is not used when the min value is within 80% of the max value.
| dbms | 256us | 1ms | 4ms | 16ms | 64ms | 256ms | 1s | 4s | 16s | gt | max |
|---|---|---|---|---|---|---|---|---|---|---|---|
| fbmy8028_rel_withdbg.cy9c_gcp_c2s60 | 0.010 | 34.264 | 65.468 | 0.258 | 0.032 | ||||||
| fbmy8028_rel.cy9c_gcp_c2s60 | 0.017 | 34.193 | 65.528 | 0.263 | 0.036 | ||||||
| fbmy8028_rel_o2.cy9c_gcp_c2s60 | 0.008 | 35.562 | 64.176 | 0.253 | 0.040 | ||||||
| fbmy8028_rel_native.cy9c_gcp_c2s60 | 0.019 | 34.308 | 65.424 | 0.249 | 0.034 | ||||||
| fbmy8028_rel_o2_lto.cy9c_gcp_c2s60 | 0.042 | 36.724 | 63.027 | 0.208 | 0.036 | ||||||
| fbmy8028_rel_lto.cy9c_gcp_c2s60 | 0.102 | 36.435 | 63.272 | 0.191 | 0.044 | ||||||
| fbmy8028_rel_native_lto.cy9c_gcp_c2s60 | 0.044 | 37.714 | 62.055 | 0.185 | 0.002 | 0.089 |
Performance metrics for the DBMS listed above. Some are normalized by throughput, others are not. Legend for results is here.
ips	qps	rps	rmbps	wps	wmbps	rpq	rkbpq	wpi	wkbpi	csps	cpups	cspq	cpupq	dbgb1	dbgb2	rss	maxop	p50	p99	tag
19769	73869	0	0.0	88.4	29.9	0.000	0.000	0.004	1.546	282507	69.0	3.824	280	60.0	61.0	151.1	0.034	3740	3420	400m.fbmy8028_rel_withdbg.cy9c_gcp_c2s60
19769	79192	0	0.0	89.3	29.1	0.000	0.000	0.005	1.506	304099	69.1	3.840	262	60.1	61.2	150.4	0.031	3983	3613	400m.fbmy8028_rel.cy9c_gcp_c2s60
19769	73711	0	0.0	87.3	29.9	0.000	0.000	0.004	1.549	282049	69.0	3.826	281	60.0	61.1	156.6	0.034	3677	3402	400m.fbmy8028_rel_o2.cy9c_gcp_c2s60
19769	79189	0	0.0	82.9	28.4	0.000	0.000	0.004	1.469	304584	69.1	3.846	262	60.0	61.1	150.6	0.027	3980	3628	400m.fbmy8028_rel_native.cy9c_gcp_c2s60
19769	79602	0	0.0	86.8	29.8	0.000	0.000	0.004	1.545	307845	69.0	3.867	260	60.0	61.0	150.9	0.026	4012	3644	400m.fbmy8028_rel_o2_lto.cy9c_gcp_c2s60
19769	79913	0	0.0	83.6	28.3	0.000	0.000	0.004	1.466	308060	69.0	3.855	259	60.1	61.1	153.2	0.045	4028	3660	400m.fbmy8028_rel_lto.cy9c_gcp_c2s60
19769	79462	0	0.0	81.0	26.4	0.000	0.000	0.004	1.366	306328	68.8	3.855	260	59.9	61.0	151.9	0.037	3995	3612	400m.fbmy8028_rel_native_lto.cy9c_gcp_c2s60
l.i0
l.i0: load without secondary indexes
Performance metrics for all DBMS, not just the ones listed above. Some are normalized by throughput, others are not. Legend for results is here.
ips	qps	rps	rmbps	wps	wmbps	rpq	rkbpq	wpi	wkbpi	csps	cpups	cspq	cpupq	dbgb1	dbgb2	rss	maxop	p50	p99	tag
615385	0	0	0.0	594.3	139.8	0.000	0.000	0.001	0.233	480559	63.6	0.781	31	12.8	13.3	3.8	0.340	31665	18180	400m.fbmy8028_rel_withdbg.cy9c_gcp_c2s60
589970	0	0	0.0	628.7	147.9	0.000	0.000	0.001	0.257	496913	64.7	0.842	33	12.9	13.5	4.0	0.532	29967	14691	400m.fbmy8028_rel.cy9c_gcp_c2s60
602410	0	0	0.0	638.9	149.4	0.000	0.000	0.001	0.254	498691	64.8	0.828	32	12.7	13.3	3.9	0.282	30567	19878	400m.fbmy8028_rel_o2.cy9c_gcp_c2s60
619195	0	0	0.0	625.4	144.4	0.000	0.000	0.001	0.239	491979	63.6	0.795	31	12.8	13.3	3.8	0.380	31077	19978	400m.fbmy8028_rel_native.cy9c_gcp_c2s60
608828	0	0	0.0	630.5	146.1	0.000	0.000	0.001	0.246	480143	64.0	0.789	32	12.6	13.2	3.9	0.346	31366	19479	400m.fbmy8028_rel_o2_lto.cy9c_gcp_c2s60
613497	0	0	0.0	640.8	149.0	0.000	0.000	0.001	0.249	507022	63.8	0.826	31	12.8	13.3	3.9	0.285	29977	18783	400m.fbmy8028_rel_lto.cy9c_gcp_c2s60
632911	0	0	0.0	634.5	147.7	0.000	0.000	0.001	0.239	458866	63.3	0.725	30	12.6	13.2	3.8	0.376	32565	15983	400m.fbmy8028_rel_native_lto.cy9c_gcp_c2s60
l.x
l.x: create secondary indexes
Performance metrics for all DBMS, not just the ones listed above. Some are normalized by throughput, others are not. Legend for results is here.
ips	qps	rps	rmbps	wps	wmbps	rpq	rkbpq	wpi	wkbpi	csps	cpups	cspq	cpupq	dbgb1	dbgb2	rss	maxop	p50	p99	tag
1398951	0	2	0.2	515.4	151.2	0.000	0.000	0.000	0.111	5278	56.1	0.004	12	27.0	27.5	26.1	0.003	NA	NA	400m.fbmy8028_rel_withdbg.cy9c_gcp_c2s60
1717167	0	3	0.2	635.0	186.6	0.000	0.000	0.000	0.111	6244	58.3	0.004	10	27.0	27.6	26.7	0.048	NA	NA	400m.fbmy8028_rel.cy9c_gcp_c2s60
1428928	0	3	0.2	536.2	146.1	0.000	0.000	0.000	0.105	5526	57.7	0.004	12	27.0	27.5	26.3	0.005	NA	NA	400m.fbmy8028_rel_o2.cy9c_gcp_c2s60
1532950	0	3	0.2	562.8	159.0	0.000	0.000	0.000	0.106	5721	53.0	0.004	10	27.0	27.5	26.2	0.007	NA	NA	400m.fbmy8028_rel_native.cy9c_gcp_c2s60
1504135	0	3	0.2	561.9	156.8	0.000	0.000	0.000	0.107	5610	57.5	0.004	11	26.9	27.5	26.7	0.003	NA	NA	400m.fbmy8028_rel_o2_lto.cy9c_gcp_c2s60
1762555	0	3	0.3	653.3	190.3	0.000	0.000	0.000	0.111	6544	57.7	0.004	10	27.0	27.6	26.5	0.005	NA	NA	400m.fbmy8028_rel_lto.cy9c_gcp_c2s60
1688186	0	3	0.2	628.7	175.6	0.000	0.000	0.000	0.107	6271	55.9	0.004	10	26.9	27.5	26.2	0.004	NA	NA	400m.fbmy8028_rel_native_lto.cy9c_gcp_c2s60
l.i1
l.i1: continue load after secondary indexes created
Performance metrics for all DBMS, not just the ones listed above. Some are normalized by throughput, others are not. Legend for results is here.
ips	qps	rps	rmbps	wps	wmbps	rpq	rkbpq	wpi	wkbpi	csps	cpups	cspq	cpupq	dbgb1	dbgb2	rss	maxop	p50	p99	tag
167154	0	14	3.7	546.8	132.8	0.000	0.023	0.003	0.814	186314	36.3	1.115	65	59.6	61.3	43.5	0.499	8843	150	400m.fbmy8028_rel_withdbg.cy9c_gcp_c2s60
168776	0	14	3.7	535.8	132.2	0.000	0.023	0.003	0.802	202492	37.6	1.200	67	58.9	60.6	43.5	0.413	8940	350	400m.fbmy8028_rel.cy9c_gcp_c2s60
174140	0	14	4.0	596.6	142.5	0.000	0.024	0.003	0.838	158770	36.8	0.912	63	62.9	64.6	44.1	0.379	8743	6842	400m.fbmy8028_rel_o2.cy9c_gcp_c2s60
169924	0	14	3.8	556.5	137.6	0.000	0.023	0.003	0.829	179776	36.6	1.058	65	74.6	76.3	43.8	0.539	8741	2298	400m.fbmy8028_rel_native.cy9c_gcp_c2s60
162536	0	13	3.7	522.2	124.7	0.000	0.023	0.003	0.786	198491	36.0	1.221	66	62.3	64.0	43.7	0.473	8740	200	400m.fbmy8028_rel_o2_lto.cy9c_gcp_c2s60
171013	0	14	3.8	561.2	134.6	0.000	0.023	0.003	0.806	205961	36.9	1.204	65	63.6	65.3	43.8	0.423	8990	300	400m.fbmy8028_rel_lto.cy9c_gcp_c2s60
180424	0	15	4.0	612.2	149.7	0.000	0.023	0.003	0.849	171260	37.4	0.949	62	63.2	64.9	43.7	0.397	9140	3996	400m.fbmy8028_rel_native_lto.cy9c_gcp_c2s60
q100.1
q100.1: range queries with 100 insert/s per client
Performance metrics for all DBMS, not just the ones listed above. Some are normalized by throughput, others are not. Legend for results is here.
ips	qps	rps	rmbps	wps	wmbps	rpq	rkbpq	wpi	wkbpi	csps	cpups	cspq	cpupq	dbgb1	dbgb2	rss	maxop	p50	p99	tag
1977	77048	0	0.0	36.5	8.5	0.000	0.000	0.018	4.411	299301	66.5	3.885	259	56.1	58.3	92.7	0.038	3852	2957	400m.fbmy8028_rel_withdbg.cy9c_gcp_c2s60
1976	83164	0	0.0	29.7	6.6	0.000	0.000	0.015	3.415	325374	66.4	3.912	240	56.1	58.3	90.2	0.056	4187	3180	400m.fbmy8028_rel.cy9c_gcp_c2s60
1976	77010	0	0.0	43.9	11.1	0.000	0.000	0.022	5.751	295767	66.7	3.841	260	56.1	58.3	96.0	0.043	3901	3180	400m.fbmy8028_rel_o2.cy9c_gcp_c2s60
1976	82911	0	0.0	43.2	9.8	0.000	0.000	0.022	5.100	323723	66.6	3.904	241	56.1	58.3	90.2	0.050	4187	3085	400m.fbmy8028_rel_native.cy9c_gcp_c2s60
1976	83547	0	0.0	32.8	8.2	0.000	0.000	0.017	4.255	328210	66.4	3.928	238	56.1	58.3	89.2	0.281	4187	3133	400m.fbmy8028_rel_o2_lto.cy9c_gcp_c2s60
1976	83632	0	0.0	33.1	7.9	0.000	0.000	0.017	4.104	327352	66.4	3.914	238	56.1	58.3	90.0	0.048	4267	2877	400m.fbmy8028_rel_lto.cy9c_gcp_c2s60
1976	82640	0	0.0	35.8	7.9	0.000	0.000	0.018	4.109	323796	66.3	3.918	241	56.1	58.3	90.7	0.047	4173	2766	400m.fbmy8028_rel_native_lto.cy9c_gcp_c2s60
q500.1
q500.1: range queries with 500 insert/s per client
Performance metrics for all DBMS, not just the ones listed above. Some are normalized by throughput, others are not. Legend for results is here.
ips	qps	rps	rmbps	wps	wmbps	rpq	rkbpq	wpi	wkbpi	csps	cpups	cspq	cpupq	dbgb1	dbgb2	rss	maxop	p50	p99	tag
9879	76096	0	0.0	44.4	12.5	0.000	0.000	0.004	1.298	295075	67.1	3.878	265	57.4	57.9	111.0	0.134	3820	3532	400m.fbmy8028_rel_withdbg.cy9c_gcp_c2s60
9879	82280	0	0.0	47.0	14.6	0.000	0.000	0.005	1.516	320154	67.3	3.891	245	57.4	57.9	109.9	0.019	4107	3726	400m.fbmy8028_rel.cy9c_gcp_c2s60
9879	75774	0	0.0	46.2	13.5	0.000	0.000	0.005	1.399	293234	67.2	3.870	266	57.4	57.9	115.2	0.026	3805	3502	400m.fbmy8028_rel_o2.cy9c_gcp_c2s60
9879	82265	0	0.0	46.0	13.2	0.000	0.000	0.005	1.371	319830	67.2	3.888	245	57.4	57.9	109.1	0.020	4141	3788	400m.fbmy8028_rel_native.cy9c_gcp_c2s60
9879	82600	0	0.0	46.4	13.1	0.000	0.000	0.005	1.353	322228	67.3	3.901	244	57.4	57.9	110.1	0.046	4141	3772	400m.fbmy8028_rel_o2_lto.cy9c_gcp_c2s60
9879	82851	0	0.0	45.3	12.8	0.000	0.000	0.005	1.325	321460	67.3	3.880	244	57.4	57.9	110.9	0.023	4219	3837	400m.fbmy8028_rel_lto.cy9c_gcp_c2s60
9879	82027	0	0.0	43.8	12.2	0.000	0.000	0.004	1.260	318814	67.1	3.887	245	57.3	57.8	111.9	0.027	4092	3740	400m.fbmy8028_rel_native_lto.cy9c_gcp_c2s60
q1000.1
q1000.1: range queries with 1000 insert/s per client
Performance metrics for all DBMS, not just the ones listed above. Some are normalized by throughput, others are not. Legend for results is here.
ips	qps	rps	rmbps	wps	wmbps	rpq	rkbpq	wpi	wkbpi	csps	cpups	cspq	cpupq	dbgb1	dbgb2	rss	maxop	p50	p99	tag
19769	73869	0	0.0	88.4	29.9	0.000	0.000	0.004	1.546	282507	69.0	3.824	280	60.0	61.0	151.1	0.034	3740	3420	400m.fbmy8028_rel_withdbg.cy9c_gcp_c2s60
19769	79192	0	0.0	89.3	29.1	0.000	0.000	0.005	1.506	304099	69.1	3.840	262	60.1	61.2	150.4	0.031	3983	3613	400m.fbmy8028_rel.cy9c_gcp_c2s60
19769	73711	0	0.0	87.3	29.9	0.000	0.000	0.004	1.549	282049	69.0	3.826	281	60.0	61.1	156.6	0.034	3677	3402	400m.fbmy8028_rel_o2.cy9c_gcp_c2s60
19769	79189	0	0.0	82.9	28.4	0.000	0.000	0.004	1.469	304584	69.1	3.846	262	60.0	61.1	150.6	0.027	3980	3628	400m.fbmy8028_rel_native.cy9c_gcp_c2s60
19769	79602	0	0.0	86.8	29.8	0.000	0.000	0.004	1.545	307845	69.0	3.867	260	60.0	61.0	150.9	0.026	4012	3644	400m.fbmy8028_rel_o2_lto.cy9c_gcp_c2s60
19769	79913	0	0.0	83.6	28.3	0.000	0.000	0.004	1.466	308060	69.0	3.855	259	60.1	61.1	153.2	0.045	4028	3660	400m.fbmy8028_rel_lto.cy9c_gcp_c2s60
19769	79462	0	0.0	81.0	26.4	0.000	0.000	0.004	1.366	306328	68.8	3.855	260	59.9	61.0	151.9	0.037	3995	3612	400m.fbmy8028_rel_native_lto.cy9c_gcp_c2s60
l.i0
- l.i0: load without secondary indexes
- Legend for results is here.
- Each entry lists the percentage of responses that fit in that bucket (slower than max time for previous bucket, faster than min time for next bucket).
Insert response time histogram
256us	1ms	4ms	16ms	64ms	256ms	1s	4s	16s	gt	max	tag
0.000	0.325	93.782	5.819	0.032	0.038	0.003	0.000	0.000	0.000	0.340	fbmy8028_rel_withdbg.cy9c_gcp_c2s60
0.000	0.465	87.859	11.597	0.034	0.043	0.002	0.000	0.000	0.000	0.532	fbmy8028_rel.cy9c_gcp_c2s60
0.000	0.294	91.871	7.755	0.033	0.043	0.003	0.000	0.000	0.000	0.282	fbmy8028_rel_o2.cy9c_gcp_c2s60
0.000	0.513	92.009	7.407	0.026	0.042	0.002	0.000	0.000	0.000	0.380	fbmy8028_rel_native.cy9c_gcp_c2s60
0.000	0.394	91.155	8.378	0.030	0.042	0.002	0.000	0.000	0.000	0.346	fbmy8028_rel_o2_lto.cy9c_gcp_c2s60
0.000	1.199	90.901	7.817	0.038	0.044	0.001	0.000	0.000	0.000	0.285	fbmy8028_rel_lto.cy9c_gcp_c2s60
0.000	0.529	93.214	6.183	0.032	0.037	0.004	0.000	0.000	0.000	0.376	fbmy8028_rel_native_lto.cy9c_gcp_c2s60
l.x
- l.x: create secondary indexes
- Legend for results is here.
- Each entry lists the percentage of responses that fit in that bucket (slower than max time for previous bucket, faster than min time for next bucket).
TODO - determine whether there is data for create index response time
l.i1
- l.i1: continue load after secondary indexes created
- Legend for results is here.
- Each entry lists the percentage of responses that fit in that bucket (slower than max time for previous bucket, faster than min time for next bucket).
Insert response time histogram
256us	1ms	4ms	16ms	64ms	256ms	1s	4s	16s	gt	max	tag
0.000	0.010	10.604	88.961	0.292	0.096	0.037	0.000	0.000	0.000	0.499	fbmy8028_rel_withdbg.cy9c_gcp_c2s60
0.000	0.008	10.408	88.896	0.540	0.144	0.003	0.000	0.000	0.000	0.413	fbmy8028_rel.cy9c_gcp_c2s60
0.000	0.009	10.334	89.594	0.039	0.021	0.002	0.000	0.000	0.000	0.379	fbmy8028_rel_o2.cy9c_gcp_c2s60
0.000	0.010	10.169	89.296	0.499	0.024	0.002	0.000	0.000	0.000	0.539	fbmy8028_rel_native.cy9c_gcp_c2s60
0.000	0.024	10.634	88.348	0.837	0.141	0.016	0.000	0.000	0.000	0.473	fbmy8028_rel_o2_lto.cy9c_gcp_c2s60
0.000	0.050	12.097	87.318	0.384	0.139	0.012	0.000	0.000	0.000	0.423	fbmy8028_rel_lto.cy9c_gcp_c2s60
0.000	0.052	12.570	87.109	0.245	0.022	0.002	0.000	0.000	0.000	0.397	fbmy8028_rel_native_lto.cy9c_gcp_c2s60
q100.1
- q100.1: range queries with 100 insert/s per client
- Legend for results is here.
- Each entry lists the percentage of responses that fit in that bucket (slower than max time for previous bucket, faster than min time for next bucket).
Query response time histogram
256us	1ms	4ms	16ms	64ms	256ms	1s	4s	16s	gt	max	tag
66.658	33.332	0.007	0.001	0.001	0.000	0.000	0.000	0.000	0.000	0.038	fbmy8028_rel_withdbg.cy9c_gcp_c2s60
79.901	20.091	0.006	0.001	0.001	0.000	0.000	0.000	0.000	0.000	0.056	fbmy8028_rel.cy9c_gcp_c2s60
66.226	33.764	0.007	0.001	0.001	0.000	0.000	0.000	0.000	0.000	0.043	fbmy8028_rel_o2.cy9c_gcp_c2s60
79.634	20.359	0.005	0.001	0.001	0.000	0.000	0.000	0.000	0.000	0.050	fbmy8028_rel_native.cy9c_gcp_c2s60
80.297	19.696	0.005	0.001	0.001	0.000	nonzero	0.000	0.000	0.000	0.281	fbmy8028_rel_o2_lto.cy9c_gcp_c2s60
80.764	19.228	0.005	0.001	0.001	0.000	0.000	0.000	0.000	0.000	0.048	fbmy8028_rel_lto.cy9c_gcp_c2s60
79.589	20.404	0.006	0.001	0.001	0.000	0.000	0.000	0.000	0.000	0.047	fbmy8028_rel_native_lto.cy9c_gcp_c2s60
Insert response time histogram
256us	1ms	4ms	16ms	64ms	256ms	1s	4s	16s	gt	max	tag
0.000	0.040	99.539	0.397	0.024	0.000	0.000	0.000	0.000	0.000	0.036	fbmy8028_rel_withdbg.cy9c_gcp_c2s60
0.000	0.169	99.472	0.344	0.014	0.000	0.000	0.000	0.000	0.000	0.028	fbmy8028_rel.cy9c_gcp_c2s60
0.000	0.029	99.468	0.456	0.047	0.000	0.000	0.000	0.000	0.000	0.047	fbmy8028_rel_o2.cy9c_gcp_c2s60
0.000	0.068	99.469	0.440	0.022	0.000	0.000	0.000	0.000	0.000	0.045	fbmy8028_rel_native.cy9c_gcp_c2s60
0.000	0.110	99.408	0.469	0.013	0.000	0.000	0.000	0.000	0.000	0.025	fbmy8028_rel_o2_lto.cy9c_gcp_c2s60
0.000	0.935	98.722	0.267	0.076	0.000	0.000	0.000	0.000	0.000	0.044	fbmy8028_rel_lto.cy9c_gcp_c2s60
0.000	0.581	98.965	0.418	0.036	0.000	0.000	0.000	0.000	0.000	0.025	fbmy8028_rel_native_lto.cy9c_gcp_c2s60
q500.1
- q500.1: range queries with 500 insert/s per client
- Legend for results is here.
- Each entry lists the percentage of responses that fit in that bucket (slower than max time for previous bucket, faster than min time for next bucket).
Query response time histogram
256us	1ms	4ms	16ms	64ms	256ms	1s	4s	16s	gt	max	tag
63.077	36.893	0.029	0.001	nonzero	nonzero	0.000	0.000	0.000	0.000	0.134	fbmy8028_rel_withdbg.cy9c_gcp_c2s60
78.095	21.881	0.023	0.001	nonzero	0.000	0.000	0.000	0.000	0.000	0.019	fbmy8028_rel.cy9c_gcp_c2s60
62.039	37.933	0.028	0.001	nonzero	0.000	0.000	0.000	0.000	0.000	0.026	fbmy8028_rel_o2.cy9c_gcp_c2s60
78.127	21.848	0.025	0.001	nonzero	0.000	0.000	0.000	0.000	0.000	0.020	fbmy8028_rel_native.cy9c_gcp_c2s60
78.396	21.578	0.025	0.001	nonzero	0.000	0.000	0.000	0.000	0.000	0.046	fbmy8028_rel_o2_lto.cy9c_gcp_c2s60
78.741	21.236	0.023	0.001	nonzero	0.000	0.000	0.000	0.000	0.000	0.023	fbmy8028_rel_lto.cy9c_gcp_c2s60
77.417	22.559	0.023	0.001	nonzero	0.000	0.000	0.000	0.000	0.000	0.027	fbmy8028_rel_native_lto.cy9c_gcp_c2s60
Insert response time histogram
256us	1ms	4ms	16ms	64ms	256ms	1s	4s	16s	gt	max	tag
0.000	0.006	37.434	62.430	0.126	0.005	0.000	0.000	0.000	0.000	0.151	fbmy8028_rel_withdbg.cy9c_gcp_c2s60
0.000	0.086	45.383	54.433	0.097	0.000	0.000	0.000	0.000	0.000	0.027	fbmy8028_rel.cy9c_gcp_c2s60
0.000	0.078	43.156	56.654	0.113	0.000	0.000	0.000	0.000	0.000	0.030	fbmy8028_rel_o2.cy9c_gcp_c2s60
0.000	0.028	35.439	64.440	0.094	0.000	0.000	0.000	0.000	0.000	0.028	fbmy8028_rel_native.cy9c_gcp_c2s60
0.000	0.052	36.145	63.682	0.117	0.004	0.000	0.000	0.000	0.000	0.133	fbmy8028_rel_o2_lto.cy9c_gcp_c2s60
0.000	0.255	49.960	49.724	0.062	0.000	0.000	0.000	0.000	0.000	0.027	fbmy8028_rel_lto.cy9c_gcp_c2s60
0.000	0.101	47.727	52.070	0.101	0.000	0.000	0.000	0.000	0.000	0.031	fbmy8028_rel_native_lto.cy9c_gcp_c2s60
q1000.1
- q1000.1: range queries with 1000 insert/s per client
- Legend for results is here.
- Each entry lists the percentage of responses that fit in that bucket (slower than max time for previous bucket, faster than min time for next bucket).
Query response time histogram
256us	1ms	4ms	16ms	64ms	256ms	1s	4s	16s	gt	max	tag
54.569	45.383	0.048	0.001	nonzero	0.000	0.000	0.000	0.000	0.000	0.034	fbmy8028_rel_withdbg.cy9c_gcp_c2s60
69.053	30.904	0.041	0.001	nonzero	0.000	0.000	0.000	0.000	0.000	0.031	fbmy8028_rel.cy9c_gcp_c2s60
54.284	45.668	0.047	0.001	nonzero	0.000	0.000	0.000	0.000	0.000	0.034	fbmy8028_rel_o2.cy9c_gcp_c2s60
69.178	30.782	0.040	0.001	nonzero	0.000	0.000	0.000	0.000	0.000	0.027	fbmy8028_rel_native.cy9c_gcp_c2s60
70.049	29.910	0.040	0.001	nonzero	0.000	0.000	0.000	0.000	0.000	0.026	fbmy8028_rel_o2_lto.cy9c_gcp_c2s60
70.914	29.046	0.039	0.001	nonzero	0.000	0.000	0.000	0.000	0.000	0.045	fbmy8028_rel_lto.cy9c_gcp_c2s60
70.071	29.888	0.039	0.001	nonzero	0.000	0.000	0.000	0.000	0.000	0.037	fbmy8028_rel_native_lto.cy9c_gcp_c2s60
Insert response time histogram
256us	1ms	4ms	16ms	64ms	256ms	1s	4s	16s	gt	max	tag
0.000	0.010	34.264	65.468	0.258	0.000	0.000	0.000	0.000	0.000	0.032	fbmy8028_rel_withdbg.cy9c_gcp_c2s60
0.000	0.017	34.193	65.528	0.263	0.000	0.000	0.000	0.000	0.000	0.036	fbmy8028_rel.cy9c_gcp_c2s60
0.000	0.008	35.562	64.176	0.253	0.000	0.000	0.000	0.000	0.000	0.040	fbmy8028_rel_o2.cy9c_gcp_c2s60
0.000	0.019	34.308	65.424	0.249	0.000	0.000	0.000	0.000	0.000	0.034	fbmy8028_rel_native.cy9c_gcp_c2s60
0.000	0.042	36.724	63.027	0.208	0.000	0.000	0.000	0.000	0.000	0.036	fbmy8028_rel_o2_lto.cy9c_gcp_c2s60
0.000	0.102	36.435	63.272	0.191	0.000	0.000	0.000	0.000	0.000	0.044	fbmy8028_rel_lto.cy9c_gcp_c2s60
0.000	0.044	37.714	62.055	0.185	0.002	0.000	0.000	0.000	0.000	0.089	fbmy8028_rel_native_lto.cy9c_gcp_c2s60