Introduction
This is a report for the insert benchmark with 400M docs and 20 client(s). It is generated by scripts (bash, awk, sed) and Tufte might not be impressed. An overview of the insert benchmark is here and a short update is here. Below, by DBMS, I mean DBMS+version.config. An example is my8020.c10b40 where my means MySQL, 8020 is version 8.0.20 and c10b40 is the name for the configuration file.
The test server is c2-standard-60 from GCP with 30 cores, hyperthreading disabled, 240G RAM and 3T of NVMe storage. The benchmark was run with 20 clients and there were 1 or 2 connections per client (1 for queries, 1 for inserts). The benchmark loads 400M rows without secondary indexes, creates secondary indexes, loads another 400M rows then does 3 read+write tests for 1800 seconds each that do queries as fast as possible with 100, 500 and then 1000 writes/second/client concurrent with the queries. There was 1 table per client. The database is cached by the storage engine and the only IO is for writes. Clients and the DBMS share one server. The per-database configs are in the per-database subdirectories here.
The tested DBMS are:
- fbmy5635_rel.cy9c_gcp_c2s60 - MyRocks 5.6.35, the cy9c_gcp_c2s60 config and compiled with CMAKE_BUILD_TYPE=Release and -O3
- fbmy8028_rel_lto.cy9c_gcp_c2s60 - MyRocks 8.0.28, the cy9c_gcp_c2s60 config and compiled with CMAKE_BUILD_TYPE=Release and -O3 -flto
Contents
- Summary
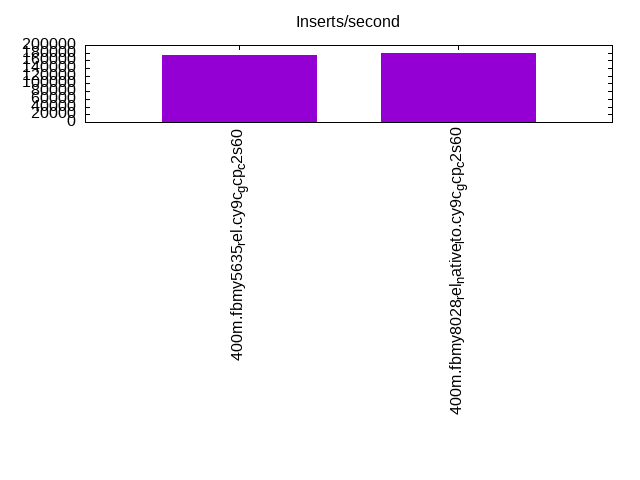
- l.i0: load without secondary indexes
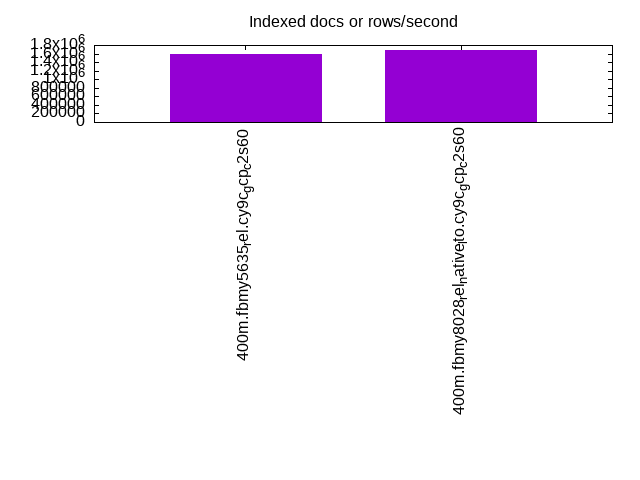
- l.x: create secondary indexes
- l.i1: continue load after secondary indexes created
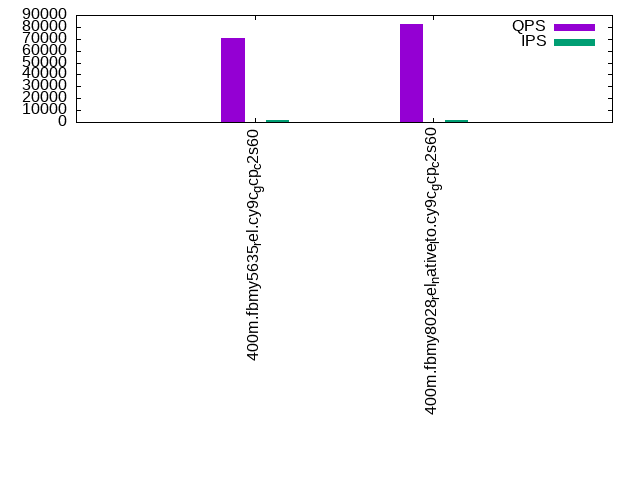
- q100.1: range queries with 100 insert/s per client
- q500.1: range queries with 500 insert/s per client
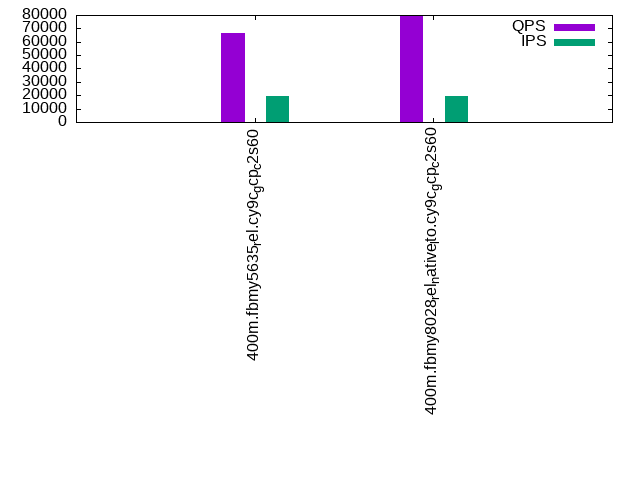
- q1000.1: range queries with 1000 insert/s per client
Summary
The numbers are inserts/s for l.i0 and l.i1, indexed docs (or rows) /s for l.x and queries/s for q*.2. The values are the average rate over the entire test for inserts (IPS) and queries (QPS). The range of values for IPS and QPS is split into 3 parts: bottom 25%, middle 50%, top 25%. Values in the bottom 25% have a red background, values in the top 25% have a green background and values in the middle have no color. A gray background is used for values that can be ignored because the DBMS did not sustain the target insert rate. Red backgrounds are not used when the minimum value is within 80% of the max value.
| dbms | l.i0 | l.x | l.i1 | q100.1 | q500.1 | q1000.1 |
|---|---|---|---|---|---|---|
| 400m.fbmy5635_rel.cy9c_gcp_c2s60 | 652528 | 1600400 | 174825 | 70710 | 69305 | 66862 |
| 400m.fbmy8028_rel_native_lto.cy9c_gcp_c2s60 | 632911 | 1688186 | 180424 | 82640 | 82027 | 79462 |
This table has relative throughput, throughput for the DBMS relative to the DBMS in the first line, using the absolute throughput from the previous table.
| dbms | l.i0 | l.x | l.i1 | q100.1 | q500.1 | q1000.1 |
|---|---|---|---|---|---|---|
| 400m.fbmy5635_rel.cy9c_gcp_c2s60 | 1.00 | 1.00 | 1.00 | 1.00 | 1.00 | 1.00 |
| 400m.fbmy8028_rel_native_lto.cy9c_gcp_c2s60 | 0.97 | 1.05 | 1.03 | 1.17 | 1.18 | 1.19 |
This lists the average rate of inserts/s for the tests that do inserts concurrent with queries. For such tests the query rate is listed in the table above. The read+write tests are setup so that the insert rate should match the target rate every second. Cells that are not at least 95% of the target have a red background to indicate a failure to satisfy the target.
| dbms | q100.1 | q500.1 | q1000.1 |
|---|---|---|---|
| fbmy5635_rel.cy9c_gcp_c2s60 | 1976 | 9885 | 19769 |
| fbmy8028_rel_native_lto.cy9c_gcp_c2s60 | 1976 | 9879 | 19769 |
| target | 2000 | 10000 | 20000 |
l.i0
l.i0: load without secondary indexes. Graphs for performance per 1-second interval are here.
Average throughput:

Insert response time histogram: each cell has the percentage of responses that take <= the time in the header and max is the max response time in seconds. For the max column values in the top 25% of the range have a red background and in the bottom 25% of the range have a green background. The red background is not used when the min value is within 80% of the max value.
| dbms | 256us | 1ms | 4ms | 16ms | 64ms | 256ms | 1s | 4s | 16s | gt | max |
|---|---|---|---|---|---|---|---|---|---|---|---|
| fbmy5635_rel.cy9c_gcp_c2s60 | 4.071 | 90.922 | 4.964 | 0.008 | 0.028 | 0.006 | 0.357 | ||||
| fbmy8028_rel_native_lto.cy9c_gcp_c2s60 | 0.529 | 93.214 | 6.183 | 0.032 | 0.037 | 0.004 | 0.376 |
Performance metrics for the DBMS listed above. Some are normalized by throughput, others are not. Legend for results is here.
ips	qps	rps	rmbps	wps	wmbps	rpq	rkbpq	wpi	wkbpi	csps	cpups	cspq	cpupq	dbgb1	dbgb2	rss	maxop	p50	p99	tag
652528	0	0	0.0	825.3	247.0	0.000	0.000	0.001	0.388	593150	63.4	0.909	29	13.1	13.5	NA	0.357	32975	18679	400m.fbmy5635_rel.cy9c_gcp_c2s60
632911	0	0	0.0	634.5	147.7	0.000	0.000	0.001	0.239	458866	63.3	0.725	30	12.6	13.2	3.8	0.376	32565	15983	400m.fbmy8028_rel_native_lto.cy9c_gcp_c2s60
l.x
l.x: create secondary indexes.
Average throughput:
Performance metrics for the DBMS listed above. Some are normalized by throughput, others are not. Legend for results is here.
ips	qps	rps	rmbps	wps	wmbps	rpq	rkbpq	wpi	wkbpi	csps	cpups	cspq	cpupq	dbgb1	dbgb2	rss	maxop	p50	p99	tag
1600400	0	3	0.2	809.9	233.0	0.000	0.000	0.001	0.149	5729	58.4	0.004	11	26.9	27.3	NA	0.003	NA	NA	400m.fbmy5635_rel.cy9c_gcp_c2s60
1688186	0	3	0.2	628.7	175.6	0.000	0.000	0.000	0.107	6271	55.9	0.004	10	26.9	27.5	26.2	0.004	NA	NA	400m.fbmy8028_rel_native_lto.cy9c_gcp_c2s60
l.i1
l.i1: continue load after secondary indexes created. Graphs for performance per 1-second interval are here.
Average throughput:
Insert response time histogram: each cell has the percentage of responses that take <= the time in the header and max is the max response time in seconds. For the max column values in the top 25% of the range have a red background and in the bottom 25% of the range have a green background. The red background is not used when the min value is within 80% of the max value.
| dbms | 256us | 1ms | 4ms | 16ms | 64ms | 256ms | 1s | 4s | 16s | gt | max |
|---|---|---|---|---|---|---|---|---|---|---|---|
| fbmy5635_rel.cy9c_gcp_c2s60 | 0.172 | 16.186 | 83.604 | 0.018 | 0.017 | 0.003 | 0.380 | ||||
| fbmy8028_rel_native_lto.cy9c_gcp_c2s60 | 0.052 | 12.570 | 87.109 | 0.245 | 0.022 | 0.002 | 0.397 |
Performance metrics for the DBMS listed above. Some are normalized by throughput, others are not. Legend for results is here.
ips	qps	rps	rmbps	wps	wmbps	rpq	rkbpq	wpi	wkbpi	csps	cpups	cspq	cpupq	dbgb1	dbgb2	rss	maxop	p50	p99	tag
174825	0	19	4.1	800.7	236.1	0.000	0.024	0.005	1.383	160082	33.7	0.916	58	56.5	58.0	NA	0.380	8793	6793	400m.fbmy5635_rel.cy9c_gcp_c2s60
180424	0	15	4.0	612.2	149.7	0.000	0.023	0.003	0.849	171260	37.4	0.949	62	63.2	64.9	43.7	0.397	9140	3996	400m.fbmy8028_rel_native_lto.cy9c_gcp_c2s60
q100.1
q100.1: range queries with 100 insert/s per client. Graphs for performance per 1-second interval are here.
Average throughput:
Query response time histogram: each cell has the percentage of responses that take <= the time in the header and max is the max response time in seconds. For max values in the top 25% of the range have a red background and in the bottom 25% of the range have a green background. The red background is not used when the min value is within 80% of the max value.
| dbms | 256us | 1ms | 4ms | 16ms | 64ms | 256ms | 1s | 4s | 16s | gt | max |
|---|---|---|---|---|---|---|---|---|---|---|---|
| fbmy5635_rel.cy9c_gcp_c2s60 | 34.608 | 65.388 | 0.003 | 0.001 | nonzero | 0.031 | |||||
| fbmy8028_rel_native_lto.cy9c_gcp_c2s60 | 79.589 | 20.404 | 0.006 | 0.001 | 0.001 | 0.047 |
Insert response time histogram: each cell has the percentage of responses that take <= the time in the header and max is the max response time in seconds. For max values in the top 25% of the range have a red background and in the bottom 25% of the range have a green background. The red background is not used when the min value is within 80% of the max value.
| dbms | 256us | 1ms | 4ms | 16ms | 64ms | 256ms | 1s | 4s | 16s | gt | max |
|---|---|---|---|---|---|---|---|---|---|---|---|
| fbmy5635_rel.cy9c_gcp_c2s60 | 0.546 | 98.186 | 1.268 | 0.009 | |||||||
| fbmy8028_rel_native_lto.cy9c_gcp_c2s60 | 0.581 | 98.965 | 0.418 | 0.036 | 0.025 |
Performance metrics for the DBMS listed above. Some are normalized by throughput, others are not. Legend for results is here.
ips	qps	rps	rmbps	wps	wmbps	rpq	rkbpq	wpi	wkbpi	csps	cpups	cspq	cpupq	dbgb1	dbgb2	rss	maxop	p50	p99	tag
1976	70710	0	0.0	18.8	5.1	0.000	0.000	0.010	2.617	295340	64.8	4.177	275	56.2	58.1	NA	0.031	3566	3069	400m.fbmy5635_rel.cy9c_gcp_c2s60
1976	82640	0	0.0	35.8	7.9	0.000	0.000	0.018	4.109	323796	66.3	3.918	241	56.1	58.3	90.7	0.047	4173	2766	400m.fbmy8028_rel_native_lto.cy9c_gcp_c2s60
q500.1
q500.1: range queries with 500 insert/s per client. Graphs for performance per 1-second interval are here.
Average throughput:

Query response time histogram: each cell has the percentage of responses that take <= the time in the header and max is the max response time in seconds. For max values in the top 25% of the range have a red background and in the bottom 25% of the range have a green background. The red background is not used when the min value is within 80% of the max value.
| dbms | 256us | 1ms | 4ms | 16ms | 64ms | 256ms | 1s | 4s | 16s | gt | max |
|---|---|---|---|---|---|---|---|---|---|---|---|
| fbmy5635_rel.cy9c_gcp_c2s60 | 27.753 | 72.213 | 0.033 | 0.001 | 0.001 | 0.041 | |||||
| fbmy8028_rel_native_lto.cy9c_gcp_c2s60 | 77.417 | 22.559 | 0.023 | 0.001 | nonzero | 0.027 |
Insert response time histogram: each cell has the percentage of responses that take <= the time in the header and max is the max response time in seconds. For max values in the top 25% of the range have a red background and in the bottom 25% of the range have a green background. The red background is not used when the min value is within 80% of the max value.
| dbms | 256us | 1ms | 4ms | 16ms | 64ms | 256ms | 1s | 4s | 16s | gt | max |
|---|---|---|---|---|---|---|---|---|---|---|---|
| fbmy5635_rel.cy9c_gcp_c2s60 | 0.057 | 15.678 | 83.859 | 0.402 | 0.004 | 0.128 | |||||
| fbmy8028_rel_native_lto.cy9c_gcp_c2s60 | 0.101 | 47.727 | 52.070 | 0.101 | 0.031 |
Performance metrics for the DBMS listed above. Some are normalized by throughput, others are not. Legend for results is here.
ips	qps	rps	rmbps	wps	wmbps	rpq	rkbpq	wpi	wkbpi	csps	cpups	cspq	cpupq	dbgb1	dbgb2	rss	maxop	p50	p99	tag
9885	69305	0	0.0	63.1	18.5	0.000	0.000	0.006	1.912	284508	66.0	4.105	286	57.4	57.6	NA	0.041	3516	3212	400m.fbmy5635_rel.cy9c_gcp_c2s60
9879	82027	0	0.0	43.8	12.2	0.000	0.000	0.004	1.260	318814	67.1	3.887	245	57.3	57.8	111.9	0.027	4092	3740	400m.fbmy8028_rel_native_lto.cy9c_gcp_c2s60
q1000.1
q1000.1: range queries with 1000 insert/s per client. Graphs for performance per 1-second interval are here.
Average throughput:
Query response time histogram: each cell has the percentage of responses that take <= the time in the header and max is the max response time in seconds. For max values in the top 25% of the range have a red background and in the bottom 25% of the range have a green background. The red background is not used when the min value is within 80% of the max value.
| dbms | 256us | 1ms | 4ms | 16ms | 64ms | 256ms | 1s | 4s | 16s | gt | max |
|---|---|---|---|---|---|---|---|---|---|---|---|
| fbmy5635_rel.cy9c_gcp_c2s60 | 18.876 | 81.068 | 0.056 | 0.001 | nonzero | 0.038 | |||||
| fbmy8028_rel_native_lto.cy9c_gcp_c2s60 | 70.071 | 29.888 | 0.039 | 0.001 | nonzero | 0.037 |
Insert response time histogram: each cell has the percentage of responses that take <= the time in the header and max is the max response time in seconds. For max values in the top 25% of the range have a red background and in the bottom 25% of the range have a green background. The red background is not used when the min value is within 80% of the max value.
| dbms | 256us | 1ms | 4ms | 16ms | 64ms | 256ms | 1s | 4s | 16s | gt | max |
|---|---|---|---|---|---|---|---|---|---|---|---|
| fbmy5635_rel.cy9c_gcp_c2s60 | 0.077 | 25.608 | 73.993 | 0.321 | 0.034 | ||||||
| fbmy8028_rel_native_lto.cy9c_gcp_c2s60 | 0.044 | 37.714 | 62.055 | 0.185 | 0.002 | 0.089 |
Performance metrics for the DBMS listed above. Some are normalized by throughput, others are not. Legend for results is here.
ips	qps	rps	rmbps	wps	wmbps	rpq	rkbpq	wpi	wkbpi	csps	cpups	cspq	cpupq	dbgb1	dbgb2	rss	maxop	p50	p99	tag
19769	66862	0	0.0	116.1	34.1	0.000	0.000	0.006	1.765	269484	67.8	4.030	304	60.1	61.0	NA	0.038	3373	3053	400m.fbmy5635_rel.cy9c_gcp_c2s60
19769	79462	0	0.0	81.0	26.4	0.000	0.000	0.004	1.366	306328	68.8	3.855	260	59.9	61.0	151.9	0.037	3995	3612	400m.fbmy8028_rel_native_lto.cy9c_gcp_c2s60
l.i0
l.i0: load without secondary indexes
Performance metrics for all DBMS, not just the ones listed above. Some are normalized by throughput, others are not. Legend for results is here.
ips	qps	rps	rmbps	wps	wmbps	rpq	rkbpq	wpi	wkbpi	csps	cpups	cspq	cpupq	dbgb1	dbgb2	rss	maxop	p50	p99	tag
652528	0	0	0.0	825.3	247.0	0.000	0.000	0.001	0.388	593150	63.4	0.909	29	13.1	13.5	NA	0.357	32975	18679	400m.fbmy5635_rel.cy9c_gcp_c2s60
632911	0	0	0.0	634.5	147.7	0.000	0.000	0.001	0.239	458866	63.3	0.725	30	12.6	13.2	3.8	0.376	32565	15983	400m.fbmy8028_rel_native_lto.cy9c_gcp_c2s60
l.x
l.x: create secondary indexes
Performance metrics for all DBMS, not just the ones listed above. Some are normalized by throughput, others are not. Legend for results is here.
ips	qps	rps	rmbps	wps	wmbps	rpq	rkbpq	wpi	wkbpi	csps	cpups	cspq	cpupq	dbgb1	dbgb2	rss	maxop	p50	p99	tag
1600400	0	3	0.2	809.9	233.0	0.000	0.000	0.001	0.149	5729	58.4	0.004	11	26.9	27.3	NA	0.003	NA	NA	400m.fbmy5635_rel.cy9c_gcp_c2s60
1688186	0	3	0.2	628.7	175.6	0.000	0.000	0.000	0.107	6271	55.9	0.004	10	26.9	27.5	26.2	0.004	NA	NA	400m.fbmy8028_rel_native_lto.cy9c_gcp_c2s60
l.i1
l.i1: continue load after secondary indexes created
Performance metrics for all DBMS, not just the ones listed above. Some are normalized by throughput, others are not. Legend for results is here.
ips	qps	rps	rmbps	wps	wmbps	rpq	rkbpq	wpi	wkbpi	csps	cpups	cspq	cpupq	dbgb1	dbgb2	rss	maxop	p50	p99	tag
174825	0	19	4.1	800.7	236.1	0.000	0.024	0.005	1.383	160082	33.7	0.916	58	56.5	58.0	NA	0.380	8793	6793	400m.fbmy5635_rel.cy9c_gcp_c2s60
180424	0	15	4.0	612.2	149.7	0.000	0.023	0.003	0.849	171260	37.4	0.949	62	63.2	64.9	43.7	0.397	9140	3996	400m.fbmy8028_rel_native_lto.cy9c_gcp_c2s60
q100.1
q100.1: range queries with 100 insert/s per client
Performance metrics for all DBMS, not just the ones listed above. Some are normalized by throughput, others are not. Legend for results is here.
ips	qps	rps	rmbps	wps	wmbps	rpq	rkbpq	wpi	wkbpi	csps	cpups	cspq	cpupq	dbgb1	dbgb2	rss	maxop	p50	p99	tag
1976	70710	0	0.0	18.8	5.1	0.000	0.000	0.010	2.617	295340	64.8	4.177	275	56.2	58.1	NA	0.031	3566	3069	400m.fbmy5635_rel.cy9c_gcp_c2s60
1976	82640	0	0.0	35.8	7.9	0.000	0.000	0.018	4.109	323796	66.3	3.918	241	56.1	58.3	90.7	0.047	4173	2766	400m.fbmy8028_rel_native_lto.cy9c_gcp_c2s60
q500.1
q500.1: range queries with 500 insert/s per client
Performance metrics for all DBMS, not just the ones listed above. Some are normalized by throughput, others are not. Legend for results is here.
ips	qps	rps	rmbps	wps	wmbps	rpq	rkbpq	wpi	wkbpi	csps	cpups	cspq	cpupq	dbgb1	dbgb2	rss	maxop	p50	p99	tag
9885	69305	0	0.0	63.1	18.5	0.000	0.000	0.006	1.912	284508	66.0	4.105	286	57.4	57.6	NA	0.041	3516	3212	400m.fbmy5635_rel.cy9c_gcp_c2s60
9879	82027	0	0.0	43.8	12.2	0.000	0.000	0.004	1.260	318814	67.1	3.887	245	57.3	57.8	111.9	0.027	4092	3740	400m.fbmy8028_rel_native_lto.cy9c_gcp_c2s60
q1000.1
q1000.1: range queries with 1000 insert/s per client
Performance metrics for all DBMS, not just the ones listed above. Some are normalized by throughput, others are not. Legend for results is here.
ips	qps	rps	rmbps	wps	wmbps	rpq	rkbpq	wpi	wkbpi	csps	cpups	cspq	cpupq	dbgb1	dbgb2	rss	maxop	p50	p99	tag
19769	66862	0	0.0	116.1	34.1	0.000	0.000	0.006	1.765	269484	67.8	4.030	304	60.1	61.0	NA	0.038	3373	3053	400m.fbmy5635_rel.cy9c_gcp_c2s60
19769	79462	0	0.0	81.0	26.4	0.000	0.000	0.004	1.366	306328	68.8	3.855	260	59.9	61.0	151.9	0.037	3995	3612	400m.fbmy8028_rel_native_lto.cy9c_gcp_c2s60
l.i0
- l.i0: load without secondary indexes
- Legend for results is here.
- Each entry lists the percentage of responses that fit in that bucket (slower than max time for previous bucket, faster than min time for next bucket).
Insert response time histogram
256us	1ms	4ms	16ms	64ms	256ms	1s	4s	16s	gt	max	tag
0.000	4.071	90.922	4.964	0.008	0.028	0.006	0.000	0.000	0.000	0.357	fbmy5635_rel.cy9c_gcp_c2s60
0.000	0.529	93.214	6.183	0.032	0.037	0.004	0.000	0.000	0.000	0.376	fbmy8028_rel_native_lto.cy9c_gcp_c2s60
l.x
- l.x: create secondary indexes
- Legend for results is here.
- Each entry lists the percentage of responses that fit in that bucket (slower than max time for previous bucket, faster than min time for next bucket).
TODO - determine whether there is data for create index response time
l.i1
- l.i1: continue load after secondary indexes created
- Legend for results is here.
- Each entry lists the percentage of responses that fit in that bucket (slower than max time for previous bucket, faster than min time for next bucket).
Insert response time histogram
256us	1ms	4ms	16ms	64ms	256ms	1s	4s	16s	gt	max	tag
0.000	0.172	16.186	83.604	0.018	0.017	0.003	0.000	0.000	0.000	0.380	fbmy5635_rel.cy9c_gcp_c2s60
0.000	0.052	12.570	87.109	0.245	0.022	0.002	0.000	0.000	0.000	0.397	fbmy8028_rel_native_lto.cy9c_gcp_c2s60
q100.1
- q100.1: range queries with 100 insert/s per client
- Legend for results is here.
- Each entry lists the percentage of responses that fit in that bucket (slower than max time for previous bucket, faster than min time for next bucket).
Query response time histogram
256us	1ms	4ms	16ms	64ms	256ms	1s	4s	16s	gt	max	tag
34.608	65.388	0.003	0.001	nonzero	0.000	0.000	0.000	0.000	0.000	0.031	fbmy5635_rel.cy9c_gcp_c2s60
79.589	20.404	0.006	0.001	0.001	0.000	0.000	0.000	0.000	0.000	0.047	fbmy8028_rel_native_lto.cy9c_gcp_c2s60
Insert response time histogram
256us	1ms	4ms	16ms	64ms	256ms	1s	4s	16s	gt	max	tag
0.000	0.546	98.186	1.268	0.000	0.000	0.000	0.000	0.000	0.000	0.009	fbmy5635_rel.cy9c_gcp_c2s60
0.000	0.581	98.965	0.418	0.036	0.000	0.000	0.000	0.000	0.000	0.025	fbmy8028_rel_native_lto.cy9c_gcp_c2s60
q500.1
- q500.1: range queries with 500 insert/s per client
- Legend for results is here.
- Each entry lists the percentage of responses that fit in that bucket (slower than max time for previous bucket, faster than min time for next bucket).
Query response time histogram
256us	1ms	4ms	16ms	64ms	256ms	1s	4s	16s	gt	max	tag
27.753	72.213	0.033	0.001	0.001	0.000	0.000	0.000	0.000	0.000	0.041	fbmy5635_rel.cy9c_gcp_c2s60
77.417	22.559	0.023	0.001	nonzero	0.000	0.000	0.000	0.000	0.000	0.027	fbmy8028_rel_native_lto.cy9c_gcp_c2s60
Insert response time histogram
256us	1ms	4ms	16ms	64ms	256ms	1s	4s	16s	gt	max	tag
0.000	0.057	15.678	83.859	0.402	0.004	0.000	0.000	0.000	0.000	0.128	fbmy5635_rel.cy9c_gcp_c2s60
0.000	0.101	47.727	52.070	0.101	0.000	0.000	0.000	0.000	0.000	0.031	fbmy8028_rel_native_lto.cy9c_gcp_c2s60
q1000.1
- q1000.1: range queries with 1000 insert/s per client
- Legend for results is here.
- Each entry lists the percentage of responses that fit in that bucket (slower than max time for previous bucket, faster than min time for next bucket).
Query response time histogram
256us	1ms	4ms	16ms	64ms	256ms	1s	4s	16s	gt	max	tag
18.876	81.068	0.056	0.001	nonzero	0.000	0.000	0.000	0.000	0.000	0.038	fbmy5635_rel.cy9c_gcp_c2s60
70.071	29.888	0.039	0.001	nonzero	0.000	0.000	0.000	0.000	0.000	0.037	fbmy8028_rel_native_lto.cy9c_gcp_c2s60
Insert response time histogram
256us	1ms	4ms	16ms	64ms	256ms	1s	4s	16s	gt	max	tag
0.000	0.077	25.608	73.993	0.321	0.000	0.000	0.000	0.000	0.000	0.034	fbmy5635_rel.cy9c_gcp_c2s60
0.000	0.044	37.714	62.055	0.185	0.002	0.000	0.000	0.000	0.000	0.089	fbmy8028_rel_native_lto.cy9c_gcp_c2s60