Introduction
This is a report for the insert benchmark with 400M docs and 20 client(s). It is generated by scripts (bash, awk, sed) and Tufte might not be impressed. An overview of the insert benchmark is here and a short update is here. Below, by DBMS, I mean DBMS+version.config. An example is my8020.c10b40 where my means MySQL, 8020 is version 8.0.20 and c10b40 is the name for the configuration file.
The test server is c2-standard-60 from GCP with 30 cores, hyperthreading disabled, 240G RAM and 3T of NVMe storage. The benchmark was run with 20 clients and there were 1 or 2 connections per client (1 for queries, 1 for inserts). The benchmark loads 400M rows without secondary indexes, creates secondary indexes, loads another 400M rows then does 3 read+write tests for 1800 seconds each that do queries as fast as possible with 100, 500 and then 1000 writes/second/client concurrent with the queries. There was one table per client. The database is cached by the OS page cache but not the storage engine. Clients and the DBMS share one server. The per-database configs are in the per-database subdirectories here.
The tested DBMS are:
- fbmy5635_rel_withdbg.cy9c4g_gcp_c2s60 - MyRocks 5.6.35, the cy9c4g_gcp_c2s60 config and compiled with CMAKE_BUILD_TYPE=RelWithDebInfo and -O2
- fbmy5635_rel_o2.cy9c4g_gcp_c2s60 - MyRocks 5.6.35, the cy9c4g_gcp_c2s60 config and compiled with CMAKE_BUILD_TYPE=Release and -O2
- fbmy5635_rel.cy9c4g_gcp_c2s60 - MyRocks 5.6.35, the cy9c4g_gcp_c2s60 config and compiled with CMAKE_BUILD_TYPE=Release and -O3
Contents
- Summary
- l.i0: load without secondary indexes
- l.x: create secondary indexes
- l.i1: continue load after secondary indexes created
- q100.1: range queries with 100 insert/s per client
- q500.1: range queries with 500 insert/s per client
- q1000.1: range queries with 1000 insert/s per client
Summary
The numbers are inserts/s for l.i0 and l.i1, indexed docs (or rows) /s for l.x and queries/s for q*.2. The values are the average rate over the entire test for inserts (IPS) and queries (QPS). The range of values for IPS and QPS is split into 3 parts: bottom 25%, middle 50%, top 25%. Values in the bottom 25% have a red background, values in the top 25% have a green background and values in the middle have no color. A gray background is used for values that can be ignored because the DBMS did not sustain the target insert rate. Red backgrounds are not used when the minimum value is within 80% of the max value.
| dbms | l.i0 | l.x | l.i1 | q100.1 | q500.1 | q1000.1 |
|---|---|---|---|---|---|---|
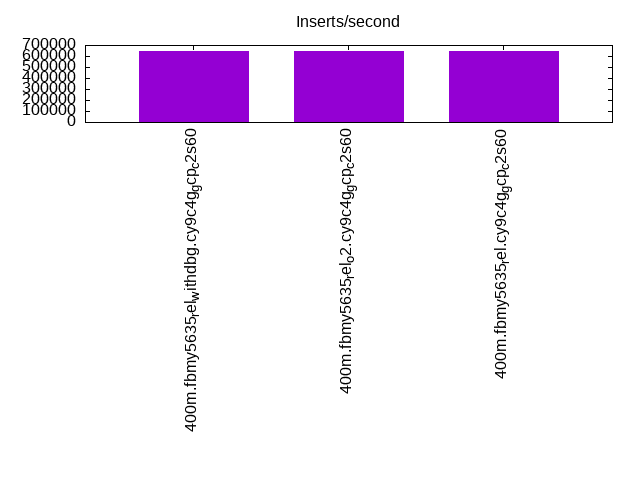
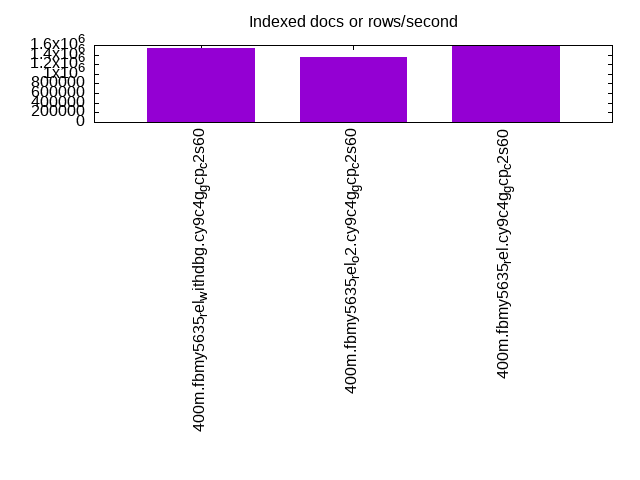
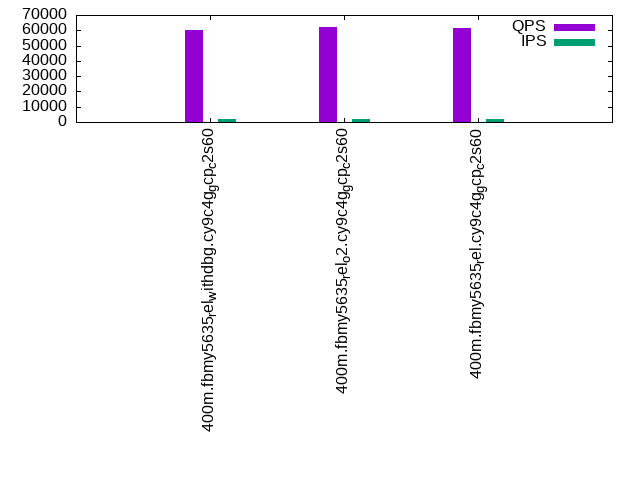
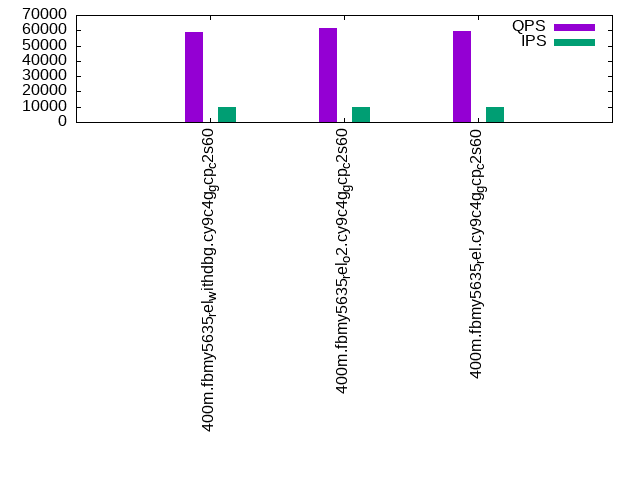
| 400m.fbmy5635_rel_withdbg.cy9c4g_gcp_c2s60 | 645161 | 1538846 | 164204 | 60276 | 59060 | 57087 |
| 400m.fbmy5635_rel_o2.cy9c4g_gcp_c2s60 | 642054 | 1356271 | 173762 | 62440 | 61244 | 59471 |
| 400m.fbmy5635_rel.cy9c4g_gcp_c2s60 | 644122 | 1581423 | 174749 | 61244 | 59785 | 57898 |
This table has relative throughput, throughput for the DBMS relative to the DBMS in the first line, using the absolute throughput from the previous table.
| dbms | l.i0 | l.x | l.i1 | q100.1 | q500.1 | q1000.1 |
|---|---|---|---|---|---|---|
| 400m.fbmy5635_rel_withdbg.cy9c4g_gcp_c2s60 | 1.00 | 1.00 | 1.00 | 1.00 | 1.00 | 1.00 |
| 400m.fbmy5635_rel_o2.cy9c4g_gcp_c2s60 | 1.00 | 0.88 | 1.06 | 1.04 | 1.04 | 1.04 |
| 400m.fbmy5635_rel.cy9c4g_gcp_c2s60 | 1.00 | 1.03 | 1.06 | 1.02 | 1.01 | 1.01 |
This lists the average rate of inserts/s for the tests that do inserts concurrent with queries. For such tests the query rate is listed in the table above. The read+write tests are setup so that the insert rate should match the target rate every second. Cells that are not at least 95% of the target have a red background to indicate a failure to satisfy the target.
| dbms | q100.1 | q500.1 | q1000.1 |
|---|---|---|---|
| fbmy5635_rel_withdbg.cy9c4g_gcp_c2s60 | 1977 | 9885 | 19769 |
| fbmy5635_rel_o2.cy9c4g_gcp_c2s60 | 1976 | 9885 | 19769 |
| fbmy5635_rel.cy9c4g_gcp_c2s60 | 1976 | 9885 | 19769 |
| target | 2000 | 10000 | 20000 |
l.i0
l.i0: load without secondary indexes. Graphs for performance per 1-second interval are here.
Average throughput:
Insert response time histogram: each cell has the percentage of responses that take <= the time in the header and max is the max response time in seconds. For the max column values in the top 25% of the range have a red background and in the bottom 25% of the range have a green background. The red background is not used when the min value is within 80% of the max value.
| dbms | 256us | 1ms | 4ms | 16ms | 64ms | 256ms | 1s | 4s | 16s | gt | max |
|---|---|---|---|---|---|---|---|---|---|---|---|
| fbmy5635_rel_withdbg.cy9c4g_gcp_c2s60 | 3.667 | 91.905 | 4.385 | 0.008 | 0.029 | 0.006 | 0.358 | ||||
| fbmy5635_rel_o2.cy9c4g_gcp_c2s60 | 3.242 | 90.562 | 6.156 | 0.005 | 0.030 | 0.004 | 0.375 | ||||
| fbmy5635_rel.cy9c4g_gcp_c2s60 | 4.947 | 87.884 | 7.129 | 0.005 | 0.031 | 0.004 | 0.333 |
Performance metrics for the DBMS listed above. Some are normalized by throughput, others are not. Legend for results is here.
ips	qps	rps	rmbps	wps	wmbps	rpq	rkbpq	wpi	wkbpi	csps	cpups	cspq	cpupq	dbgb1	dbgb2	rss	maxop	p50	p99	tag
645161	0	0	0.0	844.3	253.9	0.000	0.000	0.001	0.403	566628	63.3	0.878	29	13.4	13.8	NA	0.358	32764	21077	400m.fbmy5635_rel_withdbg.cy9c4g_gcp_c2s60
642054	0	0	0.0	801.6	240.1	0.000	0.000	0.001	0.383	602598	63.5	0.939	30	12.6	13.0	NA	0.375	32479	18280	400m.fbmy5635_rel_o2.cy9c4g_gcp_c2s60
644122	0	0	0.0	812.5	243.7	0.000	0.000	0.001	0.387	587391	63.4	0.912	30	12.8	13.2	NA	0.333	32964	17381	400m.fbmy5635_rel.cy9c4g_gcp_c2s60
l.x
l.x: create secondary indexes.
Average throughput:
Performance metrics for the DBMS listed above. Some are normalized by throughput, others are not. Legend for results is here.
ips	qps	rps	rmbps	wps	wmbps	rpq	rkbpq	wpi	wkbpi	csps	cpups	cspq	cpupq	dbgb1	dbgb2	rss	maxop	p50	p99	tag
1538846	0	3	0.2	790.5	229.1	0.000	0.000	0.001	0.152	5323	59.3	0.003	12	26.9	27.3	NA	0.006	NA	NA	400m.fbmy5635_rel_withdbg.cy9c4g_gcp_c2s60
1356271	0	2	0.2	677.0	195.1	0.000	0.000	0.000	0.147	4809	59.6	0.004	13	27.0	27.4	NA	0.003	NA	NA	400m.fbmy5635_rel_o2.cy9c4g_gcp_c2s60
1581423	0	3	0.2	799.8	231.1	0.000	0.000	0.001	0.150	5534	58.8	0.003	11	26.9	27.3	NA	0.002	NA	NA	400m.fbmy5635_rel.cy9c4g_gcp_c2s60
l.i1
l.i1: continue load after secondary indexes created. Graphs for performance per 1-second interval are here.
Average throughput:

Insert response time histogram: each cell has the percentage of responses that take <= the time in the header and max is the max response time in seconds. For the max column values in the top 25% of the range have a red background and in the bottom 25% of the range have a green background. The red background is not used when the min value is within 80% of the max value.
| dbms | 256us | 1ms | 4ms | 16ms | 64ms | 256ms | 1s | 4s | 16s | gt | max |
|---|---|---|---|---|---|---|---|---|---|---|---|
| fbmy5635_rel_withdbg.cy9c4g_gcp_c2s60 | 0.133 | 15.956 | 83.650 | 0.124 | 0.088 | 0.048 | 0.600 | ||||
| fbmy5635_rel_o2.cy9c4g_gcp_c2s60 | 0.125 | 15.573 | 84.265 | 0.017 | 0.016 | 0.003 | 0.355 | ||||
| fbmy5635_rel.cy9c4g_gcp_c2s60 | 0.127 | 15.710 | 84.128 | 0.016 | 0.016 | 0.003 | 0.431 |
Performance metrics for the DBMS listed above. Some are normalized by throughput, others are not. Legend for results is here.
ips	qps	rps	rmbps	wps	wmbps	rpq	rkbpq	wpi	wkbpi	csps	cpups	cspq	cpupq	dbgb1	dbgb2	rss	maxop	p50	p99	tag
164204	0	18	3.8	707.3	211.1	0.000	0.024	0.004	1.317	159869	32.5	0.974	59	58.1	59.6	NA	0.600	8690	150	400m.fbmy5635_rel_withdbg.cy9c4g_gcp_c2s60
173762	0	19	4.2	783.3	234.1	0.000	0.024	0.005	1.379	149960	33.3	0.863	57	59.6	61.1	NA	0.355	8890	6895	400m.fbmy5635_rel_o2.cy9c4g_gcp_c2s60
174749	0	19	4.1	792.3	234.9	0.000	0.024	0.005	1.377	151925	33.1	0.869	57	59.3	60.7	NA	0.431	8794	6693	400m.fbmy5635_rel.cy9c4g_gcp_c2s60
q100.1
q100.1: range queries with 100 insert/s per client. Graphs for performance per 1-second interval are here.
Average throughput:
Query response time histogram: each cell has the percentage of responses that take <= the time in the header and max is the max response time in seconds. For max values in the top 25% of the range have a red background and in the bottom 25% of the range have a green background. The red background is not used when the min value is within 80% of the max value.
| dbms | 256us | 1ms | 4ms | 16ms | 64ms | 256ms | 1s | 4s | 16s | gt | max |
|---|---|---|---|---|---|---|---|---|---|---|---|
| fbmy5635_rel_withdbg.cy9c4g_gcp_c2s60 | 3.560 | 96.431 | 0.008 | nonzero | nonzero | 0.031 | |||||
| fbmy5635_rel_o2.cy9c4g_gcp_c2s60 | 4.858 | 95.135 | 0.007 | nonzero | nonzero | 0.024 | |||||
| fbmy5635_rel.cy9c4g_gcp_c2s60 | 5.224 | 94.769 | 0.007 | nonzero | nonzero | 0.046 |
Insert response time histogram: each cell has the percentage of responses that take <= the time in the header and max is the max response time in seconds. For max values in the top 25% of the range have a red background and in the bottom 25% of the range have a green background. The red background is not used when the min value is within 80% of the max value.
| dbms | 256us | 1ms | 4ms | 16ms | 64ms | 256ms | 1s | 4s | 16s | gt | max |
|---|---|---|---|---|---|---|---|---|---|---|---|
| fbmy5635_rel_withdbg.cy9c4g_gcp_c2s60 | 0.150 | 95.029 | 4.794 | 0.026 | 0.023 | ||||||
| fbmy5635_rel_o2.cy9c4g_gcp_c2s60 | 0.651 | 98.582 | 0.767 | 0.014 | |||||||
| fbmy5635_rel.cy9c4g_gcp_c2s60 | 0.525 | 97.300 | 2.154 | 0.021 | 0.024 |
Performance metrics for the DBMS listed above. Some are normalized by throughput, others are not. Legend for results is here.
ips	qps	rps	rmbps	wps	wmbps	rpq	rkbpq	wpi	wkbpi	csps	cpups	cspq	cpupq	dbgb1	dbgb2	rss	maxop	p50	p99	tag
1977	60276	0	0.0	26.6	7.6	0.000	0.000	0.013	3.927	248672	64.5	4.126	321	56.2	58.1	NA	0.031	3050	2829	400m.fbmy5635_rel_withdbg.cy9c4g_gcp_c2s60
1976	62440	0	0.0	28.6	8.2	0.000	0.000	0.014	4.253	253015	65.0	4.052	312	56.3	58.2	NA	0.024	3132	2893	400m.fbmy5635_rel_o2.cy9c4g_gcp_c2s60
1976	61244	0	0.0	25.5	7.2	0.000	0.000	0.013	3.742	251904	64.5	4.113	316	56.1	58.1	NA	0.046	3070	2830	400m.fbmy5635_rel.cy9c4g_gcp_c2s60
q500.1
q500.1: range queries with 500 insert/s per client. Graphs for performance per 1-second interval are here.
Average throughput:
Query response time histogram: each cell has the percentage of responses that take <= the time in the header and max is the max response time in seconds. For max values in the top 25% of the range have a red background and in the bottom 25% of the range have a green background. The red background is not used when the min value is within 80% of the max value.
| dbms | 256us | 1ms | 4ms | 16ms | 64ms | 256ms | 1s | 4s | 16s | gt | max |
|---|---|---|---|---|---|---|---|---|---|---|---|
| fbmy5635_rel_withdbg.cy9c4g_gcp_c2s60 | 2.829 | 97.128 | 0.042 | 0.001 | nonzero | 0.058 | |||||
| fbmy5635_rel_o2.cy9c4g_gcp_c2s60 | 3.697 | 96.261 | 0.042 | 0.001 | nonzero | nonzero | 0.070 | ||||
| fbmy5635_rel.cy9c4g_gcp_c2s60 | 3.640 | 96.320 | 0.040 | 0.001 | nonzero | 0.055 |
Insert response time histogram: each cell has the percentage of responses that take <= the time in the header and max is the max response time in seconds. For max values in the top 25% of the range have a red background and in the bottom 25% of the range have a green background. The red background is not used when the min value is within 80% of the max value.
| dbms | 256us | 1ms | 4ms | 16ms | 64ms | 256ms | 1s | 4s | 16s | gt | max |
|---|---|---|---|---|---|---|---|---|---|---|---|
| fbmy5635_rel_withdbg.cy9c4g_gcp_c2s60 | 0.022 | 14.995 | 82.780 | 2.203 | 0.059 | ||||||
| fbmy5635_rel_o2.cy9c4g_gcp_c2s60 | 0.038 | 14.635 | 84.215 | 1.112 | 0.040 | ||||||
| fbmy5635_rel.cy9c4g_gcp_c2s60 | 0.113 | 18.284 | 80.382 | 1.221 | 0.046 |
Performance metrics for the DBMS listed above. Some are normalized by throughput, others are not. Legend for results is here.
ips	qps	rps	rmbps	wps	wmbps	rpq	rkbpq	wpi	wkbpi	csps	cpups	cspq	cpupq	dbgb1	dbgb2	rss	maxop	p50	p99	tag
9885	59060	0	0.0	60.5	17.7	0.000	0.000	0.006	1.831	237334	65.7	4.019	334	57.4	57.7	NA	0.058	2974	2749	400m.fbmy5635_rel_withdbg.cy9c4g_gcp_c2s60
9885	61244	0	0.0	60.5	17.7	0.000	0.000	0.006	1.829	242230	66.3	3.955	325	57.4	57.7	NA	0.070	3053	2829	400m.fbmy5635_rel_o2.cy9c4g_gcp_c2s60
9885	59785	0	0.0	61.0	17.8	0.000	0.000	0.006	1.843	240743	65.7	4.027	330	57.4	57.7	NA	0.055	3021	2781	400m.fbmy5635_rel.cy9c4g_gcp_c2s60
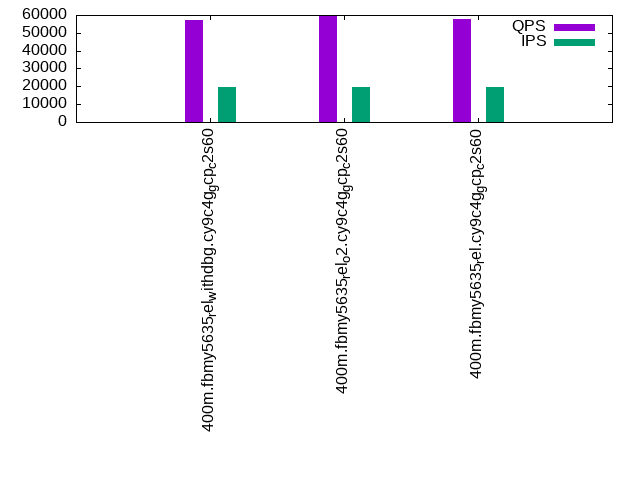
q1000.1
q1000.1: range queries with 1000 insert/s per client. Graphs for performance per 1-second interval are here.
Average throughput:
Query response time histogram: each cell has the percentage of responses that take <= the time in the header and max is the max response time in seconds. For max values in the top 25% of the range have a red background and in the bottom 25% of the range have a green background. The red background is not used when the min value is within 80% of the max value.
| dbms | 256us | 1ms | 4ms | 16ms | 64ms | 256ms | 1s | 4s | 16s | gt | max |
|---|---|---|---|---|---|---|---|---|---|---|---|
| fbmy5635_rel_withdbg.cy9c4g_gcp_c2s60 | 1.730 | 98.196 | 0.073 | 0.001 | nonzero | 0.061 | |||||
| fbmy5635_rel_o2.cy9c4g_gcp_c2s60 | 2.236 | 97.692 | 0.071 | 0.001 | nonzero | 0.062 | |||||
| fbmy5635_rel.cy9c4g_gcp_c2s60 | 2.364 | 97.564 | 0.071 | 0.001 | nonzero | 0.055 |
Insert response time histogram: each cell has the percentage of responses that take <= the time in the header and max is the max response time in seconds. For max values in the top 25% of the range have a red background and in the bottom 25% of the range have a green background. The red background is not used when the min value is within 80% of the max value.
| dbms | 256us | 1ms | 4ms | 16ms | 64ms | 256ms | 1s | 4s | 16s | gt | max |
|---|---|---|---|---|---|---|---|---|---|---|---|
| fbmy5635_rel_withdbg.cy9c4g_gcp_c2s60 | 0.058 | 22.898 | 76.098 | 0.945 | 0.045 | ||||||
| fbmy5635_rel_o2.cy9c4g_gcp_c2s60 | 0.074 | 23.685 | 75.458 | 0.783 | 0.040 | ||||||
| fbmy5635_rel.cy9c4g_gcp_c2s60 | 0.104 | 23.457 | 75.627 | 0.812 | 0.044 |
Performance metrics for the DBMS listed above. Some are normalized by throughput, others are not. Legend for results is here.
ips	qps	rps	rmbps	wps	wmbps	rpq	rkbpq	wpi	wkbpi	csps	cpups	cspq	cpupq	dbgb1	dbgb2	rss	maxop	p50	p99	tag
19769	57087	0	0.0	117.8	35.2	0.000	0.000	0.006	1.823	223526	67.7	3.916	356	60.2	61.0	NA	0.061	2877	2669	400m.fbmy5635_rel_withdbg.cy9c4g_gcp_c2s60
19769	59471	0	0.0	114.5	34.1	0.000	0.000	0.006	1.768	228605	68.2	3.844	344	60.0	60.9	NA	0.062	3005	2781	400m.fbmy5635_rel_o2.cy9c4g_gcp_c2s60
19769	57898	0	0.0	119.0	35.7	0.000	0.000	0.006	1.850	226975	67.7	3.920	351	60.2	61.0	NA	0.055	2926	2701	400m.fbmy5635_rel.cy9c4g_gcp_c2s60
l.i0
l.i0: load without secondary indexes
Performance metrics for all DBMS, not just the ones listed above. Some are normalized by throughput, others are not. Legend for results is here.
ips	qps	rps	rmbps	wps	wmbps	rpq	rkbpq	wpi	wkbpi	csps	cpups	cspq	cpupq	dbgb1	dbgb2	rss	maxop	p50	p99	tag
645161	0	0	0.0	844.3	253.9	0.000	0.000	0.001	0.403	566628	63.3	0.878	29	13.4	13.8	NA	0.358	32764	21077	400m.fbmy5635_rel_withdbg.cy9c4g_gcp_c2s60
642054	0	0	0.0	801.6	240.1	0.000	0.000	0.001	0.383	602598	63.5	0.939	30	12.6	13.0	NA	0.375	32479	18280	400m.fbmy5635_rel_o2.cy9c4g_gcp_c2s60
644122	0	0	0.0	812.5	243.7	0.000	0.000	0.001	0.387	587391	63.4	0.912	30	12.8	13.2	NA	0.333	32964	17381	400m.fbmy5635_rel.cy9c4g_gcp_c2s60
l.x
l.x: create secondary indexes
Performance metrics for all DBMS, not just the ones listed above. Some are normalized by throughput, others are not. Legend for results is here.
ips	qps	rps	rmbps	wps	wmbps	rpq	rkbpq	wpi	wkbpi	csps	cpups	cspq	cpupq	dbgb1	dbgb2	rss	maxop	p50	p99	tag
1538846	0	3	0.2	790.5	229.1	0.000	0.000	0.001	0.152	5323	59.3	0.003	12	26.9	27.3	NA	0.006	NA	NA	400m.fbmy5635_rel_withdbg.cy9c4g_gcp_c2s60
1356271	0	2	0.2	677.0	195.1	0.000	0.000	0.000	0.147	4809	59.6	0.004	13	27.0	27.4	NA	0.003	NA	NA	400m.fbmy5635_rel_o2.cy9c4g_gcp_c2s60
1581423	0	3	0.2	799.8	231.1	0.000	0.000	0.001	0.150	5534	58.8	0.003	11	26.9	27.3	NA	0.002	NA	NA	400m.fbmy5635_rel.cy9c4g_gcp_c2s60
l.i1
l.i1: continue load after secondary indexes created
Performance metrics for all DBMS, not just the ones listed above. Some are normalized by throughput, others are not. Legend for results is here.
ips	qps	rps	rmbps	wps	wmbps	rpq	rkbpq	wpi	wkbpi	csps	cpups	cspq	cpupq	dbgb1	dbgb2	rss	maxop	p50	p99	tag
164204	0	18	3.8	707.3	211.1	0.000	0.024	0.004	1.317	159869	32.5	0.974	59	58.1	59.6	NA	0.600	8690	150	400m.fbmy5635_rel_withdbg.cy9c4g_gcp_c2s60
173762	0	19	4.2	783.3	234.1	0.000	0.024	0.005	1.379	149960	33.3	0.863	57	59.6	61.1	NA	0.355	8890	6895	400m.fbmy5635_rel_o2.cy9c4g_gcp_c2s60
174749	0	19	4.1	792.3	234.9	0.000	0.024	0.005	1.377	151925	33.1	0.869	57	59.3	60.7	NA	0.431	8794	6693	400m.fbmy5635_rel.cy9c4g_gcp_c2s60
q100.1
q100.1: range queries with 100 insert/s per client
Performance metrics for all DBMS, not just the ones listed above. Some are normalized by throughput, others are not. Legend for results is here.
ips	qps	rps	rmbps	wps	wmbps	rpq	rkbpq	wpi	wkbpi	csps	cpups	cspq	cpupq	dbgb1	dbgb2	rss	maxop	p50	p99	tag
1977	60276	0	0.0	26.6	7.6	0.000	0.000	0.013	3.927	248672	64.5	4.126	321	56.2	58.1	NA	0.031	3050	2829	400m.fbmy5635_rel_withdbg.cy9c4g_gcp_c2s60
1976	62440	0	0.0	28.6	8.2	0.000	0.000	0.014	4.253	253015	65.0	4.052	312	56.3	58.2	NA	0.024	3132	2893	400m.fbmy5635_rel_o2.cy9c4g_gcp_c2s60
1976	61244	0	0.0	25.5	7.2	0.000	0.000	0.013	3.742	251904	64.5	4.113	316	56.1	58.1	NA	0.046	3070	2830	400m.fbmy5635_rel.cy9c4g_gcp_c2s60
q500.1
q500.1: range queries with 500 insert/s per client
Performance metrics for all DBMS, not just the ones listed above. Some are normalized by throughput, others are not. Legend for results is here.
ips	qps	rps	rmbps	wps	wmbps	rpq	rkbpq	wpi	wkbpi	csps	cpups	cspq	cpupq	dbgb1	dbgb2	rss	maxop	p50	p99	tag
9885	59060	0	0.0	60.5	17.7	0.000	0.000	0.006	1.831	237334	65.7	4.019	334	57.4	57.7	NA	0.058	2974	2749	400m.fbmy5635_rel_withdbg.cy9c4g_gcp_c2s60
9885	61244	0	0.0	60.5	17.7	0.000	0.000	0.006	1.829	242230	66.3	3.955	325	57.4	57.7	NA	0.070	3053	2829	400m.fbmy5635_rel_o2.cy9c4g_gcp_c2s60
9885	59785	0	0.0	61.0	17.8	0.000	0.000	0.006	1.843	240743	65.7	4.027	330	57.4	57.7	NA	0.055	3021	2781	400m.fbmy5635_rel.cy9c4g_gcp_c2s60
q1000.1
q1000.1: range queries with 1000 insert/s per client
Performance metrics for all DBMS, not just the ones listed above. Some are normalized by throughput, others are not. Legend for results is here.
ips	qps	rps	rmbps	wps	wmbps	rpq	rkbpq	wpi	wkbpi	csps	cpups	cspq	cpupq	dbgb1	dbgb2	rss	maxop	p50	p99	tag
19769	57087	0	0.0	117.8	35.2	0.000	0.000	0.006	1.823	223526	67.7	3.916	356	60.2	61.0	NA	0.061	2877	2669	400m.fbmy5635_rel_withdbg.cy9c4g_gcp_c2s60
19769	59471	0	0.0	114.5	34.1	0.000	0.000	0.006	1.768	228605	68.2	3.844	344	60.0	60.9	NA	0.062	3005	2781	400m.fbmy5635_rel_o2.cy9c4g_gcp_c2s60
19769	57898	0	0.0	119.0	35.7	0.000	0.000	0.006	1.850	226975	67.7	3.920	351	60.2	61.0	NA	0.055	2926	2701	400m.fbmy5635_rel.cy9c4g_gcp_c2s60
l.i0
- l.i0: load without secondary indexes
- Legend for results is here.
- Each entry lists the percentage of responses that fit in that bucket (slower than max time for previous bucket, faster than min time for next bucket).
Insert response time histogram
256us	1ms	4ms	16ms	64ms	256ms	1s	4s	16s	gt	max	tag
0.000	3.667	91.905	4.385	0.008	0.029	0.006	0.000	0.000	0.000	0.358	fbmy5635_rel_withdbg.cy9c4g_gcp_c2s60
0.000	3.242	90.562	6.156	0.005	0.030	0.004	0.000	0.000	0.000	0.375	fbmy5635_rel_o2.cy9c4g_gcp_c2s60
0.000	4.947	87.884	7.129	0.005	0.031	0.004	0.000	0.000	0.000	0.333	fbmy5635_rel.cy9c4g_gcp_c2s60
l.x
- l.x: create secondary indexes
- Legend for results is here.
- Each entry lists the percentage of responses that fit in that bucket (slower than max time for previous bucket, faster than min time for next bucket).
TODO - determine whether there is data for create index response time
l.i1
- l.i1: continue load after secondary indexes created
- Legend for results is here.
- Each entry lists the percentage of responses that fit in that bucket (slower than max time for previous bucket, faster than min time for next bucket).
Insert response time histogram
256us	1ms	4ms	16ms	64ms	256ms	1s	4s	16s	gt	max	tag
0.000	0.133	15.956	83.650	0.124	0.088	0.048	0.000	0.000	0.000	0.600	fbmy5635_rel_withdbg.cy9c4g_gcp_c2s60
0.000	0.125	15.573	84.265	0.017	0.016	0.003	0.000	0.000	0.000	0.355	fbmy5635_rel_o2.cy9c4g_gcp_c2s60
0.000	0.127	15.710	84.128	0.016	0.016	0.003	0.000	0.000	0.000	0.431	fbmy5635_rel.cy9c4g_gcp_c2s60
q100.1
- q100.1: range queries with 100 insert/s per client
- Legend for results is here.
- Each entry lists the percentage of responses that fit in that bucket (slower than max time for previous bucket, faster than min time for next bucket).
Query response time histogram
256us	1ms	4ms	16ms	64ms	256ms	1s	4s	16s	gt	max	tag
3.560	96.431	0.008	nonzero	nonzero	0.000	0.000	0.000	0.000	0.000	0.031	fbmy5635_rel_withdbg.cy9c4g_gcp_c2s60
4.858	95.135	0.007	nonzero	nonzero	0.000	0.000	0.000	0.000	0.000	0.024	fbmy5635_rel_o2.cy9c4g_gcp_c2s60
5.224	94.769	0.007	nonzero	nonzero	0.000	0.000	0.000	0.000	0.000	0.046	fbmy5635_rel.cy9c4g_gcp_c2s60
Insert response time histogram
256us	1ms	4ms	16ms	64ms	256ms	1s	4s	16s	gt	max	tag
0.000	0.150	95.029	4.794	0.026	0.000	0.000	0.000	0.000	0.000	0.023	fbmy5635_rel_withdbg.cy9c4g_gcp_c2s60
0.000	0.651	98.582	0.767	0.000	0.000	0.000	0.000	0.000	0.000	0.014	fbmy5635_rel_o2.cy9c4g_gcp_c2s60
0.000	0.525	97.300	2.154	0.021	0.000	0.000	0.000	0.000	0.000	0.024	fbmy5635_rel.cy9c4g_gcp_c2s60
q500.1
- q500.1: range queries with 500 insert/s per client
- Legend for results is here.
- Each entry lists the percentage of responses that fit in that bucket (slower than max time for previous bucket, faster than min time for next bucket).
Query response time histogram
256us	1ms	4ms	16ms	64ms	256ms	1s	4s	16s	gt	max	tag
2.829	97.128	0.042	0.001	nonzero	0.000	0.000	0.000	0.000	0.000	0.058	fbmy5635_rel_withdbg.cy9c4g_gcp_c2s60
3.697	96.261	0.042	0.001	nonzero	nonzero	0.000	0.000	0.000	0.000	0.070	fbmy5635_rel_o2.cy9c4g_gcp_c2s60
3.640	96.320	0.040	0.001	nonzero	0.000	0.000	0.000	0.000	0.000	0.055	fbmy5635_rel.cy9c4g_gcp_c2s60
Insert response time histogram
256us	1ms	4ms	16ms	64ms	256ms	1s	4s	16s	gt	max	tag
0.000	0.022	14.995	82.780	2.203	0.000	0.000	0.000	0.000	0.000	0.059	fbmy5635_rel_withdbg.cy9c4g_gcp_c2s60
0.000	0.038	14.635	84.215	1.112	0.000	0.000	0.000	0.000	0.000	0.040	fbmy5635_rel_o2.cy9c4g_gcp_c2s60
0.000	0.113	18.284	80.382	1.221	0.000	0.000	0.000	0.000	0.000	0.046	fbmy5635_rel.cy9c4g_gcp_c2s60
q1000.1
- q1000.1: range queries with 1000 insert/s per client
- Legend for results is here.
- Each entry lists the percentage of responses that fit in that bucket (slower than max time for previous bucket, faster than min time for next bucket).
Query response time histogram
256us	1ms	4ms	16ms	64ms	256ms	1s	4s	16s	gt	max	tag
1.730	98.196	0.073	0.001	nonzero	0.000	0.000	0.000	0.000	0.000	0.061	fbmy5635_rel_withdbg.cy9c4g_gcp_c2s60
2.236	97.692	0.071	0.001	nonzero	0.000	0.000	0.000	0.000	0.000	0.062	fbmy5635_rel_o2.cy9c4g_gcp_c2s60
2.364	97.564	0.071	0.001	nonzero	0.000	0.000	0.000	0.000	0.000	0.055	fbmy5635_rel.cy9c4g_gcp_c2s60
Insert response time histogram
256us	1ms	4ms	16ms	64ms	256ms	1s	4s	16s	gt	max	tag
0.000	0.058	22.898	76.098	0.945	0.000	0.000	0.000	0.000	0.000	0.045	fbmy5635_rel_withdbg.cy9c4g_gcp_c2s60
0.000	0.074	23.685	75.458	0.783	0.000	0.000	0.000	0.000	0.000	0.040	fbmy5635_rel_o2.cy9c4g_gcp_c2s60
0.000	0.104	23.457	75.627	0.812	0.000	0.000	0.000	0.000	0.000	0.044	fbmy5635_rel.cy9c4g_gcp_c2s60