Introduction
This is a report for the insert benchmark with 20M docs and 4 client(s). It is generated by scripts (bash, awk, sed) and Tufte might not be impressed. An overview of the insert benchmark is here and a short update is here. Below, by DBMS, I mean DBMS+version.config. An example is my8020.c10b40 where my means MySQL, 8020 is version 8.0.20 and c10b40 is the name for the configuration file.
The test server has 8 AMD cores, 16G RAM and an NVMe SSD. It is described here as the Beelink. The benchmark was run with 4 clients and there were 1 or 2 connections per client (1 for queries, 1 for inserts). The benchmark loads 20M rows without secondary indexes, creates secondary indexes, loads another 20M rows then does 3 read+write tests for one hour each that do queries as fast as possible with 100, 500 and then 1000 writes/second/client concurrent with the queries. All clients share one table. The database is cached by the storage engine and the only IO is for writes. Clients and the DBMS share one server. The per-database configs are in the per-database subdirectories here.
The tested DBMS are:
- fbmy8028_rel_withdbg.cay9c - MyRocks 8.0.28, the cay9c config and compiled with CMAKE_BUILD_TYPE=RelWithDebInfo and -O2
- fbmy8028_rel.cay9c - MyRocks 8.0.28, the cay9c config and compiled with CMAKE_BUILD_TYPE=Release and -O3
- fbmy8028_rel_o2.cay9c - MyRocks 8.0.28, the cay9c config and compiled with CMAKE_BUILD_TYPE=Release and -O2
- fbmy8028_rel_native.cay9c - MyRocks 8.0.28, the cay9c config and compiled with CMAKE_BUILD_TYPE=Release and -O3 -march=native -mtune=native
- fbmy8028_rel_o2_lto.cay9c - MyRocks 8.0.28, the cay9c config and compiled with CMAKE_BUILD_TYPE=Release and -O2 -flto
- fbmy8028_rel_lto.cay9c - MyRocks 8.0.28, the cay9c config and compiled with CMAKE_BUILD_TYPE=Release and -O3 -flto
- fbmy8028_rel_native_lto.cay9c - MyRocks 8.0.28, the cay9c config and compiled with CMAKE_BUILD_TYPE=Release and -O3 -flto -march=native -mtune=native
Contents
- Summary
- l.i0: load without secondary indexes
- l.x: create secondary indexes
- l.i1: continue load after secondary indexes created
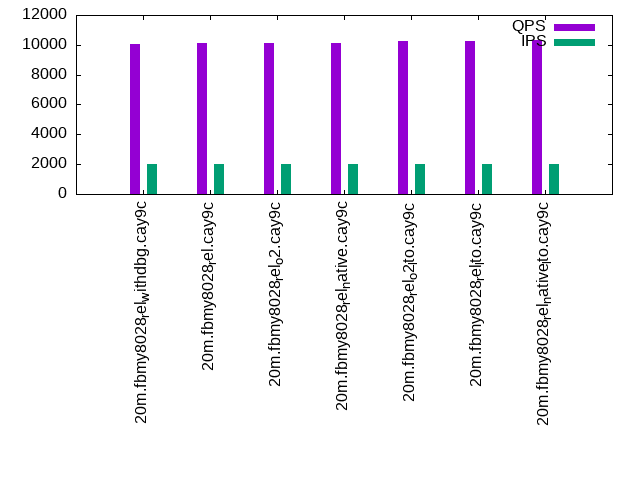
- q100.1: range queries with 100 insert/s per client
- q500.1: range queries with 500 insert/s per client
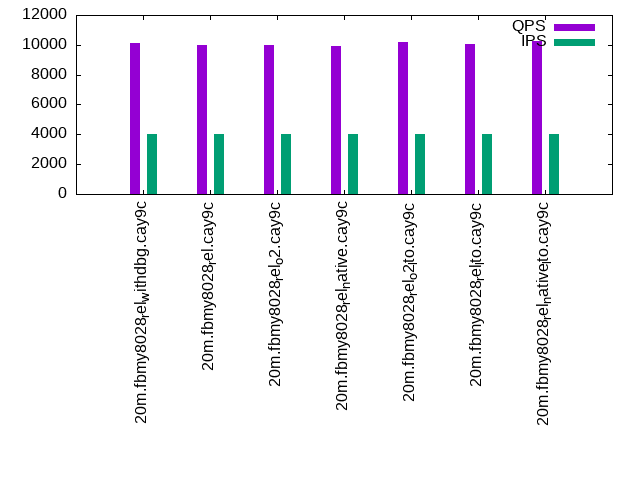
- q1000.1: range queries with 1000 insert/s per client
Summary
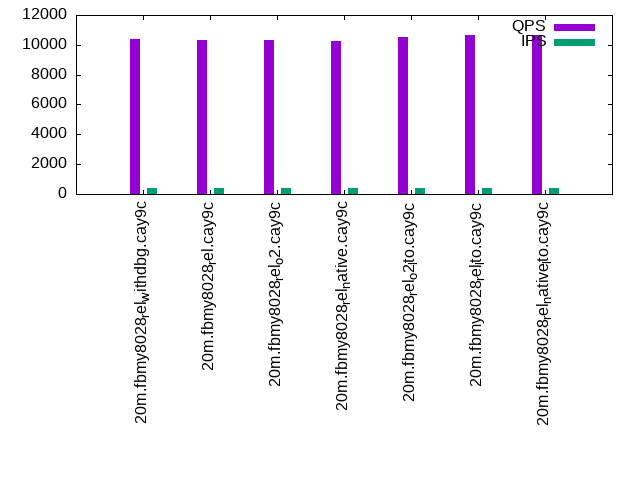
The numbers are inserts/s for l.i0 and l.i1, indexed docs (or rows) /s for l.x and queries/s for q*.2. The values are the average rate over the entire test for inserts (IPS) and queries (QPS). The range of values for IPS and QPS is split into 3 parts: bottom 25%, middle 50%, top 25%. Values in the bottom 25% have a red background, values in the top 25% have a green background and values in the middle have no color. A gray background is used for values that can be ignored because the DBMS did not sustain the target insert rate. Red backgrounds are not used when the minimum value is within 80% of the max value.
| dbms | l.i0 | l.x | l.i1 | q100.1 | q500.1 | q1000.1 |
|---|---|---|---|---|---|---|
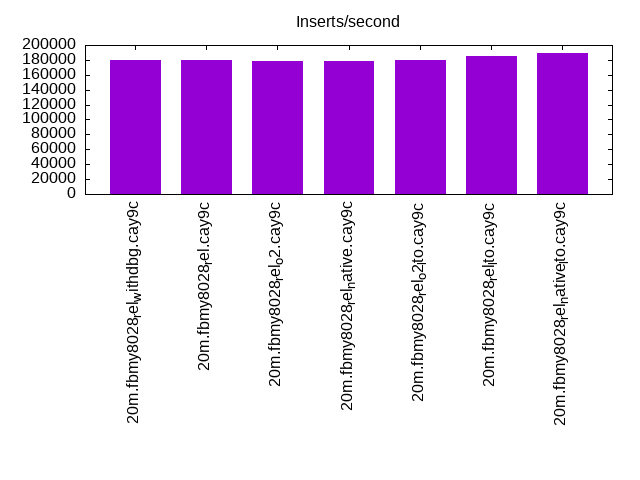
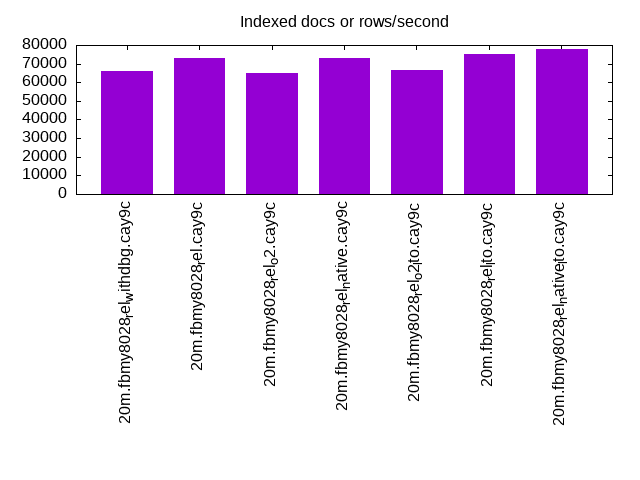
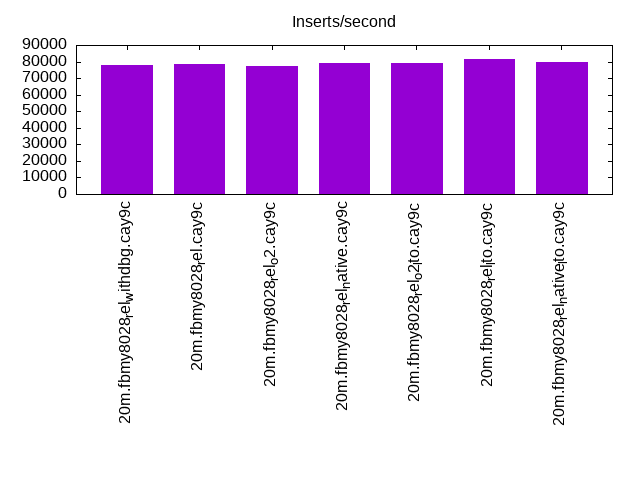
| 20m.fbmy8028_rel_withdbg.cay9c | 180180 | 66118 | 78125 | 10373 | 10076 | 10131 |
| 20m.fbmy8028_rel.cay9c | 180180 | 73091 | 78431 | 10323 | 10155 | 9994 |
| 20m.fbmy8028_rel_o2.cay9c | 178571 | 65048 | 77519 | 10334 | 10101 | 10002 |
| 20m.fbmy8028_rel_native.cay9c | 178571 | 72826 | 79051 | 10255 | 10097 | 9908 |
| 20m.fbmy8028_rel_o2_lto.cay9c | 180180 | 66337 | 79051 | 10551 | 10286 | 10160 |
| 20m.fbmy8028_rel_lto.cay9c | 185185 | 75281 | 81301 | 10659 | 10279 | 10088 |
| 20m.fbmy8028_rel_native_lto.cay9c | 188679 | 77606 | 80000 | 10654 | 10307 | 10240 |
This table has relative throughput, throughput for the DBMS relative to the DBMS in the first line, using the absolute throughput from the previous table.
| dbms | l.i0 | l.x | l.i1 | q100.1 | q500.1 | q1000.1 |
|---|---|---|---|---|---|---|
| 20m.fbmy8028_rel_withdbg.cay9c | 1.00 | 1.00 | 1.00 | 1.00 | 1.00 | 1.00 |
| 20m.fbmy8028_rel.cay9c | 1.00 | 1.11 | 1.00 | 1.00 | 1.01 | 0.99 |
| 20m.fbmy8028_rel_o2.cay9c | 0.99 | 0.98 | 0.99 | 1.00 | 1.00 | 0.99 |
| 20m.fbmy8028_rel_native.cay9c | 0.99 | 1.10 | 1.01 | 0.99 | 1.00 | 0.98 |
| 20m.fbmy8028_rel_o2_lto.cay9c | 1.00 | 1.00 | 1.01 | 1.02 | 1.02 | 1.00 |
| 20m.fbmy8028_rel_lto.cay9c | 1.03 | 1.14 | 1.04 | 1.03 | 1.02 | 1.00 |
| 20m.fbmy8028_rel_native_lto.cay9c | 1.05 | 1.17 | 1.02 | 1.03 | 1.02 | 1.01 |
This lists the average rate of inserts/s for the tests that do inserts concurrent with queries. For such tests the query rate is listed in the table above. The read+write tests are setup so that the insert rate should match the target rate every second. Cells that are not at least 95% of the target have a red background to indicate a failure to satisfy the target.
| dbms | q100.1 | q500.1 | q1000.1 |
|---|---|---|---|
| fbmy8028_rel_withdbg.cay9c | 399 | 1994 | 3989 |
| fbmy8028_rel.cay9c | 399 | 1994 | 3989 |
| fbmy8028_rel_o2.cay9c | 399 | 1994 | 3989 |
| fbmy8028_rel_native.cay9c | 399 | 1993 | 3989 |
| fbmy8028_rel_o2_lto.cay9c | 399 | 1994 | 3989 |
| fbmy8028_rel_lto.cay9c | 399 | 1993 | 3989 |
| fbmy8028_rel_native_lto.cay9c | 399 | 1994 | 3989 |
| target | 400 | 2000 | 4000 |
l.i0
l.i0: load without secondary indexes. Graphs for performance per 1-second interval are here.
Average throughput:
Insert response time histogram: each cell has the percentage of responses that take <= the time in the header and max is the max response time in seconds. For the max column values in the top 25% of the range have a red background and in the bottom 25% of the range have a green background. The red background is not used when the min value is within 80% of the max value.
| dbms | 256us | 1ms | 4ms | 16ms | 64ms | 256ms | 1s | 4s | 16s | gt | max |
|---|---|---|---|---|---|---|---|---|---|---|---|
| fbmy8028_rel_withdbg.cay9c | 99.352 | 0.437 | 0.198 | 0.013 | 0.120 | ||||||
| fbmy8028_rel.cay9c | 99.354 | 0.427 | 0.205 | 0.013 | 0.118 | ||||||
| fbmy8028_rel_o2.cay9c | 99.356 | 0.419 | 0.211 | 0.013 | 0.116 | ||||||
| fbmy8028_rel_native.cay9c | 99.364 | 0.407 | 0.215 | 0.013 | 0.129 | ||||||
| fbmy8028_rel_o2_lto.cay9c | 99.343 | 0.448 | 0.195 | 0.013 | 0.126 | ||||||
| fbmy8028_rel_lto.cay9c | 99.364 | 0.398 | 0.224 | 0.013 | 0.118 | ||||||
| fbmy8028_rel_native_lto.cay9c | 99.369 | 0.450 | 0.168 | 0.013 | 0.119 |
Performance metrics for the DBMS listed above. Some are normalized by throughput, others are not. Legend for results is here.
ips	qps	rps	rmbps	wps	wmbps	rpq	rkbpq	wpi	wkbpi	csps	cpups	cspq	cpupq	dbgb1	dbgb2	rss	maxop	p50	p99	tag
180180	0	0	0.0	98.5	37.4	0.000	0.000	0.001	0.213	17766	68.2	0.099	30	0.7	1.9	0.7	0.120	50945	43852	20m.fbmy8028_rel_withdbg.cay9c
180180	0	0	0.0	97.6	37.0	0.000	0.000	0.001	0.210	17620	67.7	0.098	30	0.7	1.9	0.7	0.118	50945	42353	20m.fbmy8028_rel.cay9c
178571	0	0	0.0	101.1	38.7	0.000	0.000	0.001	0.222	17695	68.5	0.099	31	0.7	1.9	0.7	0.116	50845	39956	20m.fbmy8028_rel_o2.cay9c
178571	0	0	0.0	96.5	36.6	0.000	0.000	0.001	0.210	17616	67.9	0.099	30	0.7	2.0	0.7	0.129	50545	33963	20m.fbmy8028_rel_native.cay9c
180180	0	0	0.0	99.9	37.7	0.000	0.000	0.001	0.214	17631	68.0	0.098	30	0.7	1.9	0.7	0.126	51344	20578	20m.fbmy8028_rel_o2_lto.cay9c
185185	0	0	0.0	104.5	40.1	0.000	0.000	0.001	0.222	18133	68.5	0.098	30	0.7	1.9	0.7	0.118	52843	6893	20m.fbmy8028_rel_lto.cay9c
188679	0	0	0.0	102.8	39.1	0.000	0.000	0.001	0.212	18364	68.2	0.097	29	0.7	2.0	0.7	0.119	53542	4595	20m.fbmy8028_rel_native_lto.cay9c
l.x
l.x: create secondary indexes.
Average throughput:
Performance metrics for the DBMS listed above. Some are normalized by throughput, others are not. Legend for results is here.
ips	qps	rps	rmbps	wps	wmbps	rpq	rkbpq	wpi	wkbpi	csps	cpups	cspq	cpupq	dbgb1	dbgb2	rss	maxop	p50	p99	tag
66118	0	0	0.0	26.0	10.0	0.000	0.000	0.000	0.155	357	12.8	0.005	15	1.4	2.7	1.9	0.009	NA	NA	20m.fbmy8028_rel_withdbg.cay9c
73091	0	0	0.0	29.0	11.3	0.000	0.000	0.000	0.158	408	12.8	0.006	14	1.4	2.6	1.9	0.014	NA	NA	20m.fbmy8028_rel.cay9c
65048	0	0	0.0	25.3	9.8	0.000	0.000	0.000	0.155	358	12.8	0.006	16	1.4	2.6	2.0	0.009	NA	NA	20m.fbmy8028_rel_o2.cay9c
72826	0	0	0.0	28.4	11.1	0.000	0.000	0.000	0.156	411	12.8	0.006	14	1.4	2.6	2.0	0.014	NA	NA	20m.fbmy8028_rel_native.cay9c
66337	0	0	0.0	25.7	10.0	0.000	0.000	0.000	0.154	366	12.8	0.006	15	1.4	2.6	1.9	0.009	NA	NA	20m.fbmy8028_rel_o2_lto.cay9c
75281	0	0	0.0	29.4	11.4	0.000	0.000	0.000	0.156	381	12.8	0.005	14	1.4	2.7	2.0	0.009	NA	NA	20m.fbmy8028_rel_lto.cay9c
77606	0	0	0.0	29.9	11.7	0.000	0.000	0.000	0.154	367	12.8	0.005	13	1.4	2.6	1.9	0.008	NA	NA	20m.fbmy8028_rel_native_lto.cay9c
l.i1
l.i1: continue load after secondary indexes created. Graphs for performance per 1-second interval are here.
Average throughput:
Insert response time histogram: each cell has the percentage of responses that take <= the time in the header and max is the max response time in seconds. For the max column values in the top 25% of the range have a red background and in the bottom 25% of the range have a green background. The red background is not used when the min value is within 80% of the max value.
| dbms | 256us | 1ms | 4ms | 16ms | 64ms | 256ms | 1s | 4s | 16s | gt | max |
|---|---|---|---|---|---|---|---|---|---|---|---|
| fbmy8028_rel_withdbg.cay9c | 99.019 | 0.864 | 0.110 | 0.006 | 0.128 | ||||||
| fbmy8028_rel.cay9c | 98.977 | 0.890 | 0.130 | 0.003 | 0.102 | ||||||
| fbmy8028_rel_o2.cay9c | 99.034 | 0.836 | 0.125 | 0.005 | 0.123 | ||||||
| fbmy8028_rel_native.cay9c | 99.059 | 0.819 | 0.118 | 0.004 | 0.120 | ||||||
| fbmy8028_rel_o2_lto.cay9c | 99.128 | 0.735 | 0.132 | 0.005 | 0.137 | ||||||
| fbmy8028_rel_lto.cay9c | 99.137 | 0.739 | 0.119 | 0.006 | 0.122 | ||||||
| fbmy8028_rel_native_lto.cay9c | 99.085 | 0.798 | 0.111 | 0.006 | 0.135 |
Performance metrics for the DBMS listed above. Some are normalized by throughput, others are not. Legend for results is here.
ips	qps	rps	rmbps	wps	wmbps	rpq	rkbpq	wpi	wkbpi	csps	cpups	cspq	cpupq	dbgb1	dbgb2	rss	maxop	p50	p99	tag
78125	0	12	1.5	145.4	58.3	0.000	0.020	0.002	0.764	17436	71.8	0.223	74	3.3	5.2	2.6	0.128	20028	15833	20m.fbmy8028_rel_withdbg.cay9c
78431	0	0	0.0	149.9	60.2	0.000	0.000	0.002	0.786	17394	71.6	0.222	73	5.2	7.1	2.5	0.102	20035	16082	20m.fbmy8028_rel.cay9c
77519	0	3	0.4	147.2	58.7	0.000	0.005	0.002	0.775	17385	72.3	0.224	75	5.2	7.1	2.5	0.123	19878	15833	20m.fbmy8028_rel_o2.cay9c
79051	0	9	1.2	146.1	58.3	0.000	0.015	0.002	0.755	17663	71.7	0.223	73	4.0	5.9	2.5	0.120	20178	15883	20m.fbmy8028_rel_native.cay9c
79051	0	3	0.4	150.5	60.0	0.000	0.005	0.002	0.777	17569	72.5	0.222	73	4.9	6.8	2.5	0.137	20139	15283	20m.fbmy8028_rel_o2_lto.cay9c
81301	0	11	1.4	153.5	61.4	0.000	0.017	0.002	0.774	18149	71.4	0.223	70	4.0	5.9	2.5	0.122	20777	15583	20m.fbmy8028_rel_lto.cay9c
80000	0	12	1.6	150.7	60.4	0.000	0.020	0.002	0.773	17882	70.8	0.224	71	3.5	5.4	2.6	0.135	20427	14840	20m.fbmy8028_rel_native_lto.cay9c
q100.1
q100.1: range queries with 100 insert/s per client. Graphs for performance per 1-second interval are here.
Average throughput:
Query response time histogram: each cell has the percentage of responses that take <= the time in the header and max is the max response time in seconds. For max values in the top 25% of the range have a red background and in the bottom 25% of the range have a green background. The red background is not used when the min value is within 80% of the max value.
| dbms | 256us | 1ms | 4ms | 16ms | 64ms | 256ms | 1s | 4s | 16s | gt | max |
|---|---|---|---|---|---|---|---|---|---|---|---|
| fbmy8028_rel_withdbg.cay9c | 7.466 | 92.520 | 0.014 | 0.001 | 0.013 | ||||||
| fbmy8028_rel.cay9c | 5.803 | 94.178 | 0.018 | 0.001 | 0.013 | ||||||
| fbmy8028_rel_o2.cay9c | 5.719 | 94.265 | 0.015 | 0.001 | 0.014 | ||||||
| fbmy8028_rel_native.cay9c | 4.681 | 95.302 | 0.016 | 0.001 | 0.011 | ||||||
| fbmy8028_rel_o2_lto.cay9c | 9.397 | 90.589 | 0.013 | 0.001 | nonzero | 0.018 | |||||
| fbmy8028_rel_lto.cay9c | 10.593 | 89.391 | 0.016 | 0.001 | 0.012 | ||||||
| fbmy8028_rel_native_lto.cay9c | 11.576 | 88.409 | 0.015 | nonzero | 0.009 |
Insert response time histogram: each cell has the percentage of responses that take <= the time in the header and max is the max response time in seconds. For max values in the top 25% of the range have a red background and in the bottom 25% of the range have a green background. The red background is not used when the min value is within 80% of the max value.
| dbms | 256us | 1ms | 4ms | 16ms | 64ms | 256ms | 1s | 4s | 16s | gt | max |
|---|---|---|---|---|---|---|---|---|---|---|---|
| fbmy8028_rel_withdbg.cay9c | 99.493 | 0.465 | 0.042 | 0.017 | |||||||
| fbmy8028_rel.cay9c | 99.639 | 0.312 | 0.049 | 0.023 | |||||||
| fbmy8028_rel_o2.cay9c | 99.625 | 0.347 | 0.028 | 0.018 | |||||||
| fbmy8028_rel_native.cay9c | 99.410 | 0.542 | 0.049 | 0.021 | |||||||
| fbmy8028_rel_o2_lto.cay9c | 99.444 | 0.507 | 0.049 | 0.017 | |||||||
| fbmy8028_rel_lto.cay9c | 99.292 | 0.667 | 0.042 | 0.017 | |||||||
| fbmy8028_rel_native_lto.cay9c | 99.535 | 0.424 | 0.042 | 0.022 |
Performance metrics for the DBMS listed above. Some are normalized by throughput, others are not. Legend for results is here.
ips	qps	rps	rmbps	wps	wmbps	rpq	rkbpq	wpi	wkbpi	csps	cpups	cspq	cpupq	dbgb1	dbgb2	rss	maxop	p50	p99	tag
399	10373	4	0.2	6.5	1.5	0.000	0.019	0.016	3.880	39319	51.1	3.791	394	2.8	4.9	5.7	0.013	2637	2110	20m.fbmy8028_rel_withdbg.cay9c
399	10323	42	0.4	7.3	1.9	0.004	0.040	0.018	4.806	39248	51.2	3.802	397	2.8	4.8	6.5	0.013	2589	2030	20m.fbmy8028_rel.cay9c
399	10334	33	0.4	7.1	1.8	0.003	0.035	0.018	4.670	39228	51.3	3.796	397	2.8	4.8	6.7	0.014	2621	2078	20m.fbmy8028_rel_o2.cay9c
399	10255	16	0.2	6.9	1.7	0.002	0.024	0.017	4.271	38973	51.1	3.801	399	2.8	4.8	6.4	0.011	2558	2046	20m.fbmy8028_rel_native.cay9c
399	10551	34	0.4	7.4	1.9	0.003	0.034	0.019	4.938	39949	51.3	3.786	389	2.8	4.9	6.7	0.018	2654	2110	20m.fbmy8028_rel_o2_lto.cay9c
399	10659	16	0.2	6.7	1.6	0.001	0.021	0.017	4.128	40463	51.1	3.796	384	2.8	4.8	6.4	0.012	2669	2046	20m.fbmy8028_rel_lto.cay9c
399	10654	8	0.2	6.5	1.5	0.001	0.018	0.016	3.812	40398	51.1	3.792	384	2.8	4.9	5.8	0.009	2653	2142	20m.fbmy8028_rel_native_lto.cay9c
q500.1
q500.1: range queries with 500 insert/s per client. Graphs for performance per 1-second interval are here.
Average throughput:
Query response time histogram: each cell has the percentage of responses that take <= the time in the header and max is the max response time in seconds. For max values in the top 25% of the range have a red background and in the bottom 25% of the range have a green background. The red background is not used when the min value is within 80% of the max value.
| dbms | 256us | 1ms | 4ms | 16ms | 64ms | 256ms | 1s | 4s | 16s | gt | max |
|---|---|---|---|---|---|---|---|---|---|---|---|
| fbmy8028_rel_withdbg.cay9c | 3.029 | 96.875 | 0.090 | 0.006 | nonzero | 0.016 | |||||
| fbmy8028_rel.cay9c | 2.553 | 97.365 | 0.079 | 0.004 | nonzero | 0.019 | |||||
| fbmy8028_rel_o2.cay9c | 1.615 | 98.292 | 0.088 | 0.005 | nonzero | 0.018 | |||||
| fbmy8028_rel_native.cay9c | 2.000 | 97.910 | 0.086 | 0.004 | nonzero | 0.020 | |||||
| fbmy8028_rel_o2_lto.cay9c | 4.266 | 95.667 | 0.063 | 0.004 | nonzero | 0.020 | |||||
| fbmy8028_rel_lto.cay9c | 4.968 | 94.953 | 0.076 | 0.004 | nonzero | 0.020 | |||||
| fbmy8028_rel_native_lto.cay9c | 6.084 | 93.834 | 0.078 | 0.005 | nonzero | 0.016 |
Insert response time histogram: each cell has the percentage of responses that take <= the time in the header and max is the max response time in seconds. For max values in the top 25% of the range have a red background and in the bottom 25% of the range have a green background. The red background is not used when the min value is within 80% of the max value.
| dbms | 256us | 1ms | 4ms | 16ms | 64ms | 256ms | 1s | 4s | 16s | gt | max |
|---|---|---|---|---|---|---|---|---|---|---|---|
| fbmy8028_rel_withdbg.cay9c | 92.436 | 7.429 | 0.133 | 0.001 | 0.065 | ||||||
| fbmy8028_rel.cay9c | 97.408 | 2.514 | 0.078 | 0.063 | |||||||
| fbmy8028_rel_o2.cay9c | 92.654 | 7.183 | 0.161 | 0.001 | 0.069 | ||||||
| fbmy8028_rel_native.cay9c | 93.132 | 6.743 | 0.125 | 0.060 | |||||||
| fbmy8028_rel_o2_lto.cay9c | 96.250 | 3.636 | 0.112 | 0.001 | 0.084 | ||||||
| fbmy8028_rel_lto.cay9c | 98.219 | 1.706 | 0.075 | 0.061 | |||||||
| fbmy8028_rel_native_lto.cay9c | 95.583 | 4.318 | 0.099 | 0.063 |
Performance metrics for the DBMS listed above. Some are normalized by throughput, others are not. Legend for results is here.
ips	qps	rps	rmbps	wps	wmbps	rpq	rkbpq	wpi	wkbpi	csps	cpups	cspq	cpupq	dbgb1	dbgb2	rss	maxop	p50	p99	tag
1994	10076	0	0.0	6.9	1.7	0.000	0.000	0.003	0.858	38202	51.6	3.791	410	3.2	3.6	7.4	0.016	2510	2030	20m.fbmy8028_rel_withdbg.cay9c
1994	10155	0	0.0	7.3	1.9	0.000	0.000	0.004	0.959	38531	51.6	3.794	407	3.2	3.6	8.2	0.019	2557	2094	20m.fbmy8028_rel.cay9c
1994	10101	0	0.0	6.9	1.7	0.000	0.000	0.003	0.862	38280	51.6	3.790	409	3.2	3.6	8.5	0.018	2541	2046	20m.fbmy8028_rel_o2.cay9c
1993	10097	0	0.0	7.1	1.8	0.000	0.000	0.004	0.908	38268	51.6	3.790	409	3.2	3.6	8.0	0.020	2542	2031	20m.fbmy8028_rel_native.cay9c
1994	10286	0	0.0	7.0	1.8	0.000	0.000	0.004	0.907	38897	51.6	3.781	401	3.2	3.6	8.5	0.020	2573	2094	20m.fbmy8028_rel_o2_lto.cay9c
1993	10279	0	0.0	7.4	1.9	0.000	0.000	0.004	0.970	39043	51.5	3.798	401	3.1	3.6	8.1	0.020	2558	2094	20m.fbmy8028_rel_lto.cay9c
1994	10307	0	0.0	6.9	1.7	0.000	0.000	0.003	0.864	39095	51.5	3.793	400	3.2	3.6	7.6	0.016	2590	2126	20m.fbmy8028_rel_native_lto.cay9c
q1000.1
q1000.1: range queries with 1000 insert/s per client. Graphs for performance per 1-second interval are here.
Average throughput:
Query response time histogram: each cell has the percentage of responses that take <= the time in the header and max is the max response time in seconds. For max values in the top 25% of the range have a red background and in the bottom 25% of the range have a green background. The red background is not used when the min value is within 80% of the max value.
| dbms | 256us | 1ms | 4ms | 16ms | 64ms | 256ms | 1s | 4s | 16s | gt | max |
|---|---|---|---|---|---|---|---|---|---|---|---|
| fbmy8028_rel_withdbg.cay9c | 1.647 | 98.121 | 0.221 | 0.011 | nonzero | 0.049 | |||||
| fbmy8028_rel.cay9c | 1.550 | 98.216 | 0.224 | 0.010 | nonzero | 0.029 | |||||
| fbmy8028_rel_o2.cay9c | 1.278 | 98.512 | 0.199 | 0.010 | nonzero | 0.020 | |||||
| fbmy8028_rel_native.cay9c | 1.014 | 98.771 | 0.206 | 0.009 | nonzero | 0.024 | |||||
| fbmy8028_rel_o2_lto.cay9c | 2.454 | 97.333 | 0.204 | 0.009 | nonzero | 0.024 | |||||
| fbmy8028_rel_lto.cay9c | 3.443 | 96.316 | 0.230 | 0.012 | nonzero | 0.030 | |||||
| fbmy8028_rel_native_lto.cay9c | 4.209 | 95.621 | 0.160 | 0.009 | nonzero | 0.029 |
Insert response time histogram: each cell has the percentage of responses that take <= the time in the header and max is the max response time in seconds. For max values in the top 25% of the range have a red background and in the bottom 25% of the range have a green background. The red background is not used when the min value is within 80% of the max value.
| dbms | 256us | 1ms | 4ms | 16ms | 64ms | 256ms | 1s | 4s | 16s | gt | max |
|---|---|---|---|---|---|---|---|---|---|---|---|
| fbmy8028_rel_withdbg.cay9c | 86.264 | 13.591 | 0.144 | 0.001 | 0.070 | ||||||
| fbmy8028_rel.cay9c | 87.533 | 12.308 | 0.159 | 0.001 | 0.068 | ||||||
| fbmy8028_rel_o2.cay9c | 92.285 | 7.593 | 0.122 | 0.001 | 0.064 | ||||||
| fbmy8028_rel_native.cay9c | 92.111 | 7.767 | 0.122 | 0.001 | 0.066 | ||||||
| fbmy8028_rel_o2_lto.cay9c | 86.456 | 13.365 | 0.176 | 0.002 | 0.097 | ||||||
| fbmy8028_rel_lto.cay9c | 84.105 | 15.694 | 0.199 | 0.001 | 0.075 | ||||||
| fbmy8028_rel_native_lto.cay9c | 96.306 | 3.590 | 0.103 | 0.001 | 0.068 |
Performance metrics for the DBMS listed above. Some are normalized by throughput, others are not. Legend for results is here.
ips	qps	rps	rmbps	wps	wmbps	rpq	rkbpq	wpi	wkbpi	csps	cpups	cspq	cpupq	dbgb1	dbgb2	rss	maxop	p50	p99	tag
3989	10131	18	0.6	16.0	4.9	0.002	0.062	0.004	1.270	38095	53.8	3.760	425	3.6	5.0	10.9	0.049	2541	2062	20m.fbmy8028_rel_withdbg.cay9c
3989	9994	6	0.3	15.2	4.7	0.001	0.033	0.004	1.199	37634	53.6	3.766	429	3.7	5.0	10.9	0.029	2525	2094	20m.fbmy8028_rel.cay9c
3989	10002	6	0.5	15.2	4.7	0.001	0.047	0.004	1.196	37553	53.8	3.755	430	3.7	5.1	10.7	0.020	2509	2030	20m.fbmy8028_rel_o2.cay9c
3989	9908	7	0.3	15.1	4.6	0.001	0.030	0.004	1.174	37334	53.6	3.768	433	3.7	5.1	10.8	0.024	2493	2030	20m.fbmy8028_rel_native.cay9c
3989	10160	14	0.5	15.9	4.9	0.001	0.055	0.004	1.254	38017	53.8	3.742	424	3.7	5.1	10.8	0.024	2573	2079	20m.fbmy8028_rel_o2_lto.cay9c
3989	10088	10	0.4	14.3	4.3	0.001	0.042	0.004	1.099	38038	53.2	3.771	422	3.9	5.3	10.8	0.030	2478	2046	20m.fbmy8028_rel_lto.cay9c
3989	10240	7	0.5	15.1	4.6	0.001	0.046	0.004	1.192	38425	53.6	3.753	419	3.7	5.1	11.0	0.029	2557	2110	20m.fbmy8028_rel_native_lto.cay9c
l.i0
l.i0: load without secondary indexes
Performance metrics for all DBMS, not just the ones listed above. Some are normalized by throughput, others are not. Legend for results is here.
ips	qps	rps	rmbps	wps	wmbps	rpq	rkbpq	wpi	wkbpi	csps	cpups	cspq	cpupq	dbgb1	dbgb2	rss	maxop	p50	p99	tag
180180	0	0	0.0	98.5	37.4	0.000	0.000	0.001	0.213	17766	68.2	0.099	30	0.7	1.9	0.7	0.120	50945	43852	20m.fbmy8028_rel_withdbg.cay9c
180180	0	0	0.0	97.6	37.0	0.000	0.000	0.001	0.210	17620	67.7	0.098	30	0.7	1.9	0.7	0.118	50945	42353	20m.fbmy8028_rel.cay9c
178571	0	0	0.0	101.1	38.7	0.000	0.000	0.001	0.222	17695	68.5	0.099	31	0.7	1.9	0.7	0.116	50845	39956	20m.fbmy8028_rel_o2.cay9c
178571	0	0	0.0	96.5	36.6	0.000	0.000	0.001	0.210	17616	67.9	0.099	30	0.7	2.0	0.7	0.129	50545	33963	20m.fbmy8028_rel_native.cay9c
180180	0	0	0.0	99.9	37.7	0.000	0.000	0.001	0.214	17631	68.0	0.098	30	0.7	1.9	0.7	0.126	51344	20578	20m.fbmy8028_rel_o2_lto.cay9c
185185	0	0	0.0	104.5	40.1	0.000	0.000	0.001	0.222	18133	68.5	0.098	30	0.7	1.9	0.7	0.118	52843	6893	20m.fbmy8028_rel_lto.cay9c
188679	0	0	0.0	102.8	39.1	0.000	0.000	0.001	0.212	18364	68.2	0.097	29	0.7	2.0	0.7	0.119	53542	4595	20m.fbmy8028_rel_native_lto.cay9c
l.x
l.x: create secondary indexes
Performance metrics for all DBMS, not just the ones listed above. Some are normalized by throughput, others are not. Legend for results is here.
ips	qps	rps	rmbps	wps	wmbps	rpq	rkbpq	wpi	wkbpi	csps	cpups	cspq	cpupq	dbgb1	dbgb2	rss	maxop	p50	p99	tag
66118	0	0	0.0	26.0	10.0	0.000	0.000	0.000	0.155	357	12.8	0.005	15	1.4	2.7	1.9	0.009	NA	NA	20m.fbmy8028_rel_withdbg.cay9c
73091	0	0	0.0	29.0	11.3	0.000	0.000	0.000	0.158	408	12.8	0.006	14	1.4	2.6	1.9	0.014	NA	NA	20m.fbmy8028_rel.cay9c
65048	0	0	0.0	25.3	9.8	0.000	0.000	0.000	0.155	358	12.8	0.006	16	1.4	2.6	2.0	0.009	NA	NA	20m.fbmy8028_rel_o2.cay9c
72826	0	0	0.0	28.4	11.1	0.000	0.000	0.000	0.156	411	12.8	0.006	14	1.4	2.6	2.0	0.014	NA	NA	20m.fbmy8028_rel_native.cay9c
66337	0	0	0.0	25.7	10.0	0.000	0.000	0.000	0.154	366	12.8	0.006	15	1.4	2.6	1.9	0.009	NA	NA	20m.fbmy8028_rel_o2_lto.cay9c
75281	0	0	0.0	29.4	11.4	0.000	0.000	0.000	0.156	381	12.8	0.005	14	1.4	2.7	2.0	0.009	NA	NA	20m.fbmy8028_rel_lto.cay9c
77606	0	0	0.0	29.9	11.7	0.000	0.000	0.000	0.154	367	12.8	0.005	13	1.4	2.6	1.9	0.008	NA	NA	20m.fbmy8028_rel_native_lto.cay9c
l.i1
l.i1: continue load after secondary indexes created
Performance metrics for all DBMS, not just the ones listed above. Some are normalized by throughput, others are not. Legend for results is here.
ips	qps	rps	rmbps	wps	wmbps	rpq	rkbpq	wpi	wkbpi	csps	cpups	cspq	cpupq	dbgb1	dbgb2	rss	maxop	p50	p99	tag
78125	0	12	1.5	145.4	58.3	0.000	0.020	0.002	0.764	17436	71.8	0.223	74	3.3	5.2	2.6	0.128	20028	15833	20m.fbmy8028_rel_withdbg.cay9c
78431	0	0	0.0	149.9	60.2	0.000	0.000	0.002	0.786	17394	71.6	0.222	73	5.2	7.1	2.5	0.102	20035	16082	20m.fbmy8028_rel.cay9c
77519	0	3	0.4	147.2	58.7	0.000	0.005	0.002	0.775	17385	72.3	0.224	75	5.2	7.1	2.5	0.123	19878	15833	20m.fbmy8028_rel_o2.cay9c
79051	0	9	1.2	146.1	58.3	0.000	0.015	0.002	0.755	17663	71.7	0.223	73	4.0	5.9	2.5	0.120	20178	15883	20m.fbmy8028_rel_native.cay9c
79051	0	3	0.4	150.5	60.0	0.000	0.005	0.002	0.777	17569	72.5	0.222	73	4.9	6.8	2.5	0.137	20139	15283	20m.fbmy8028_rel_o2_lto.cay9c
81301	0	11	1.4	153.5	61.4	0.000	0.017	0.002	0.774	18149	71.4	0.223	70	4.0	5.9	2.5	0.122	20777	15583	20m.fbmy8028_rel_lto.cay9c
80000	0	12	1.6	150.7	60.4	0.000	0.020	0.002	0.773	17882	70.8	0.224	71	3.5	5.4	2.6	0.135	20427	14840	20m.fbmy8028_rel_native_lto.cay9c
q100.1
q100.1: range queries with 100 insert/s per client
Performance metrics for all DBMS, not just the ones listed above. Some are normalized by throughput, others are not. Legend for results is here.
ips	qps	rps	rmbps	wps	wmbps	rpq	rkbpq	wpi	wkbpi	csps	cpups	cspq	cpupq	dbgb1	dbgb2	rss	maxop	p50	p99	tag
399	10373	4	0.2	6.5	1.5	0.000	0.019	0.016	3.880	39319	51.1	3.791	394	2.8	4.9	5.7	0.013	2637	2110	20m.fbmy8028_rel_withdbg.cay9c
399	10323	42	0.4	7.3	1.9	0.004	0.040	0.018	4.806	39248	51.2	3.802	397	2.8	4.8	6.5	0.013	2589	2030	20m.fbmy8028_rel.cay9c
399	10334	33	0.4	7.1	1.8	0.003	0.035	0.018	4.670	39228	51.3	3.796	397	2.8	4.8	6.7	0.014	2621	2078	20m.fbmy8028_rel_o2.cay9c
399	10255	16	0.2	6.9	1.7	0.002	0.024	0.017	4.271	38973	51.1	3.801	399	2.8	4.8	6.4	0.011	2558	2046	20m.fbmy8028_rel_native.cay9c
399	10551	34	0.4	7.4	1.9	0.003	0.034	0.019	4.938	39949	51.3	3.786	389	2.8	4.9	6.7	0.018	2654	2110	20m.fbmy8028_rel_o2_lto.cay9c
399	10659	16	0.2	6.7	1.6	0.001	0.021	0.017	4.128	40463	51.1	3.796	384	2.8	4.8	6.4	0.012	2669	2046	20m.fbmy8028_rel_lto.cay9c
399	10654	8	0.2	6.5	1.5	0.001	0.018	0.016	3.812	40398	51.1	3.792	384	2.8	4.9	5.8	0.009	2653	2142	20m.fbmy8028_rel_native_lto.cay9c
q500.1
q500.1: range queries with 500 insert/s per client
Performance metrics for all DBMS, not just the ones listed above. Some are normalized by throughput, others are not. Legend for results is here.
ips	qps	rps	rmbps	wps	wmbps	rpq	rkbpq	wpi	wkbpi	csps	cpups	cspq	cpupq	dbgb1	dbgb2	rss	maxop	p50	p99	tag
1994	10076	0	0.0	6.9	1.7	0.000	0.000	0.003	0.858	38202	51.6	3.791	410	3.2	3.6	7.4	0.016	2510	2030	20m.fbmy8028_rel_withdbg.cay9c
1994	10155	0	0.0	7.3	1.9	0.000	0.000	0.004	0.959	38531	51.6	3.794	407	3.2	3.6	8.2	0.019	2557	2094	20m.fbmy8028_rel.cay9c
1994	10101	0	0.0	6.9	1.7	0.000	0.000	0.003	0.862	38280	51.6	3.790	409	3.2	3.6	8.5	0.018	2541	2046	20m.fbmy8028_rel_o2.cay9c
1993	10097	0	0.0	7.1	1.8	0.000	0.000	0.004	0.908	38268	51.6	3.790	409	3.2	3.6	8.0	0.020	2542	2031	20m.fbmy8028_rel_native.cay9c
1994	10286	0	0.0	7.0	1.8	0.000	0.000	0.004	0.907	38897	51.6	3.781	401	3.2	3.6	8.5	0.020	2573	2094	20m.fbmy8028_rel_o2_lto.cay9c
1993	10279	0	0.0	7.4	1.9	0.000	0.000	0.004	0.970	39043	51.5	3.798	401	3.1	3.6	8.1	0.020	2558	2094	20m.fbmy8028_rel_lto.cay9c
1994	10307	0	0.0	6.9	1.7	0.000	0.000	0.003	0.864	39095	51.5	3.793	400	3.2	3.6	7.6	0.016	2590	2126	20m.fbmy8028_rel_native_lto.cay9c
q1000.1
q1000.1: range queries with 1000 insert/s per client
Performance metrics for all DBMS, not just the ones listed above. Some are normalized by throughput, others are not. Legend for results is here.
ips	qps	rps	rmbps	wps	wmbps	rpq	rkbpq	wpi	wkbpi	csps	cpups	cspq	cpupq	dbgb1	dbgb2	rss	maxop	p50	p99	tag
3989	10131	18	0.6	16.0	4.9	0.002	0.062	0.004	1.270	38095	53.8	3.760	425	3.6	5.0	10.9	0.049	2541	2062	20m.fbmy8028_rel_withdbg.cay9c
3989	9994	6	0.3	15.2	4.7	0.001	0.033	0.004	1.199	37634	53.6	3.766	429	3.7	5.0	10.9	0.029	2525	2094	20m.fbmy8028_rel.cay9c
3989	10002	6	0.5	15.2	4.7	0.001	0.047	0.004	1.196	37553	53.8	3.755	430	3.7	5.1	10.7	0.020	2509	2030	20m.fbmy8028_rel_o2.cay9c
3989	9908	7	0.3	15.1	4.6	0.001	0.030	0.004	1.174	37334	53.6	3.768	433	3.7	5.1	10.8	0.024	2493	2030	20m.fbmy8028_rel_native.cay9c
3989	10160	14	0.5	15.9	4.9	0.001	0.055	0.004	1.254	38017	53.8	3.742	424	3.7	5.1	10.8	0.024	2573	2079	20m.fbmy8028_rel_o2_lto.cay9c
3989	10088	10	0.4	14.3	4.3	0.001	0.042	0.004	1.099	38038	53.2	3.771	422	3.9	5.3	10.8	0.030	2478	2046	20m.fbmy8028_rel_lto.cay9c
3989	10240	7	0.5	15.1	4.6	0.001	0.046	0.004	1.192	38425	53.6	3.753	419	3.7	5.1	11.0	0.029	2557	2110	20m.fbmy8028_rel_native_lto.cay9c
l.i0
- l.i0: load without secondary indexes
- Legend for results is here.
- Each entry lists the percentage of responses that fit in that bucket (slower than max time for previous bucket, faster than min time for next bucket).
Insert response time histogram
256us	1ms	4ms	16ms	64ms	256ms	1s	4s	16s	gt	max	tag
0.000	0.000	99.352	0.437	0.198	0.013	0.000	0.000	0.000	0.000	0.120	fbmy8028_rel_withdbg.cay9c
0.000	0.000	99.354	0.427	0.205	0.013	0.000	0.000	0.000	0.000	0.118	fbmy8028_rel.cay9c
0.000	0.000	99.356	0.419	0.211	0.013	0.000	0.000	0.000	0.000	0.116	fbmy8028_rel_o2.cay9c
0.000	0.000	99.364	0.407	0.215	0.013	0.000	0.000	0.000	0.000	0.129	fbmy8028_rel_native.cay9c
0.000	0.000	99.343	0.448	0.195	0.013	0.000	0.000	0.000	0.000	0.126	fbmy8028_rel_o2_lto.cay9c
0.000	0.000	99.364	0.398	0.224	0.013	0.000	0.000	0.000	0.000	0.118	fbmy8028_rel_lto.cay9c
0.000	0.000	99.369	0.450	0.168	0.013	0.000	0.000	0.000	0.000	0.119	fbmy8028_rel_native_lto.cay9c
l.x
- l.x: create secondary indexes
- Legend for results is here.
- Each entry lists the percentage of responses that fit in that bucket (slower than max time for previous bucket, faster than min time for next bucket).
TODO - determine whether there is data for create index response time
l.i1
- l.i1: continue load after secondary indexes created
- Legend for results is here.
- Each entry lists the percentage of responses that fit in that bucket (slower than max time for previous bucket, faster than min time for next bucket).
Insert response time histogram
256us	1ms	4ms	16ms	64ms	256ms	1s	4s	16s	gt	max	tag
0.000	0.000	99.019	0.864	0.110	0.006	0.000	0.000	0.000	0.000	0.128	fbmy8028_rel_withdbg.cay9c
0.000	0.000	98.977	0.890	0.130	0.003	0.000	0.000	0.000	0.000	0.102	fbmy8028_rel.cay9c
0.000	0.000	99.034	0.836	0.125	0.005	0.000	0.000	0.000	0.000	0.123	fbmy8028_rel_o2.cay9c
0.000	0.000	99.059	0.819	0.118	0.004	0.000	0.000	0.000	0.000	0.120	fbmy8028_rel_native.cay9c
0.000	0.000	99.128	0.735	0.132	0.005	0.000	0.000	0.000	0.000	0.137	fbmy8028_rel_o2_lto.cay9c
0.000	0.000	99.137	0.739	0.119	0.006	0.000	0.000	0.000	0.000	0.122	fbmy8028_rel_lto.cay9c
0.000	0.000	99.085	0.798	0.111	0.006	0.000	0.000	0.000	0.000	0.135	fbmy8028_rel_native_lto.cay9c
q100.1
- q100.1: range queries with 100 insert/s per client
- Legend for results is here.
- Each entry lists the percentage of responses that fit in that bucket (slower than max time for previous bucket, faster than min time for next bucket).
Query response time histogram
256us	1ms	4ms	16ms	64ms	256ms	1s	4s	16s	gt	max	tag
7.466	92.520	0.014	0.001	0.000	0.000	0.000	0.000	0.000	0.000	0.013	fbmy8028_rel_withdbg.cay9c
5.803	94.178	0.018	0.001	0.000	0.000	0.000	0.000	0.000	0.000	0.013	fbmy8028_rel.cay9c
5.719	94.265	0.015	0.001	0.000	0.000	0.000	0.000	0.000	0.000	0.014	fbmy8028_rel_o2.cay9c
4.681	95.302	0.016	0.001	0.000	0.000	0.000	0.000	0.000	0.000	0.011	fbmy8028_rel_native.cay9c
9.397	90.589	0.013	0.001	nonzero	0.000	0.000	0.000	0.000	0.000	0.018	fbmy8028_rel_o2_lto.cay9c
10.593	89.391	0.016	0.001	0.000	0.000	0.000	0.000	0.000	0.000	0.012	fbmy8028_rel_lto.cay9c
11.576	88.409	0.015	nonzero	0.000	0.000	0.000	0.000	0.000	0.000	0.009	fbmy8028_rel_native_lto.cay9c
Insert response time histogram
256us	1ms	4ms	16ms	64ms	256ms	1s	4s	16s	gt	max	tag
0.000	0.000	99.493	0.465	0.042	0.000	0.000	0.000	0.000	0.000	0.017	fbmy8028_rel_withdbg.cay9c
0.000	0.000	99.639	0.312	0.049	0.000	0.000	0.000	0.000	0.000	0.023	fbmy8028_rel.cay9c
0.000	0.000	99.625	0.347	0.028	0.000	0.000	0.000	0.000	0.000	0.018	fbmy8028_rel_o2.cay9c
0.000	0.000	99.410	0.542	0.049	0.000	0.000	0.000	0.000	0.000	0.021	fbmy8028_rel_native.cay9c
0.000	0.000	99.444	0.507	0.049	0.000	0.000	0.000	0.000	0.000	0.017	fbmy8028_rel_o2_lto.cay9c
0.000	0.000	99.292	0.667	0.042	0.000	0.000	0.000	0.000	0.000	0.017	fbmy8028_rel_lto.cay9c
0.000	0.000	99.535	0.424	0.042	0.000	0.000	0.000	0.000	0.000	0.022	fbmy8028_rel_native_lto.cay9c
q500.1
- q500.1: range queries with 500 insert/s per client
- Legend for results is here.
- Each entry lists the percentage of responses that fit in that bucket (slower than max time for previous bucket, faster than min time for next bucket).
Query response time histogram
256us	1ms	4ms	16ms	64ms	256ms	1s	4s	16s	gt	max	tag
3.029	96.875	0.090	0.006	nonzero	0.000	0.000	0.000	0.000	0.000	0.016	fbmy8028_rel_withdbg.cay9c
2.553	97.365	0.079	0.004	nonzero	0.000	0.000	0.000	0.000	0.000	0.019	fbmy8028_rel.cay9c
1.615	98.292	0.088	0.005	nonzero	0.000	0.000	0.000	0.000	0.000	0.018	fbmy8028_rel_o2.cay9c
2.000	97.910	0.086	0.004	nonzero	0.000	0.000	0.000	0.000	0.000	0.020	fbmy8028_rel_native.cay9c
4.266	95.667	0.063	0.004	nonzero	0.000	0.000	0.000	0.000	0.000	0.020	fbmy8028_rel_o2_lto.cay9c
4.968	94.953	0.076	0.004	nonzero	0.000	0.000	0.000	0.000	0.000	0.020	fbmy8028_rel_lto.cay9c
6.084	93.834	0.078	0.005	nonzero	0.000	0.000	0.000	0.000	0.000	0.016	fbmy8028_rel_native_lto.cay9c
Insert response time histogram
256us	1ms	4ms	16ms	64ms	256ms	1s	4s	16s	gt	max	tag
0.000	0.000	92.436	7.429	0.133	0.001	0.000	0.000	0.000	0.000	0.065	fbmy8028_rel_withdbg.cay9c
0.000	0.000	97.408	2.514	0.078	0.000	0.000	0.000	0.000	0.000	0.063	fbmy8028_rel.cay9c
0.000	0.000	92.654	7.183	0.161	0.001	0.000	0.000	0.000	0.000	0.069	fbmy8028_rel_o2.cay9c
0.000	0.000	93.132	6.743	0.125	0.000	0.000	0.000	0.000	0.000	0.060	fbmy8028_rel_native.cay9c
0.000	0.000	96.250	3.636	0.112	0.001	0.000	0.000	0.000	0.000	0.084	fbmy8028_rel_o2_lto.cay9c
0.000	0.000	98.219	1.706	0.075	0.000	0.000	0.000	0.000	0.000	0.061	fbmy8028_rel_lto.cay9c
0.000	0.000	95.583	4.318	0.099	0.000	0.000	0.000	0.000	0.000	0.063	fbmy8028_rel_native_lto.cay9c
q1000.1
- q1000.1: range queries with 1000 insert/s per client
- Legend for results is here.
- Each entry lists the percentage of responses that fit in that bucket (slower than max time for previous bucket, faster than min time for next bucket).
Query response time histogram
256us	1ms	4ms	16ms	64ms	256ms	1s	4s	16s	gt	max	tag
1.647	98.121	0.221	0.011	nonzero	0.000	0.000	0.000	0.000	0.000	0.049	fbmy8028_rel_withdbg.cay9c
1.550	98.216	0.224	0.010	nonzero	0.000	0.000	0.000	0.000	0.000	0.029	fbmy8028_rel.cay9c
1.278	98.512	0.199	0.010	nonzero	0.000	0.000	0.000	0.000	0.000	0.020	fbmy8028_rel_o2.cay9c
1.014	98.771	0.206	0.009	nonzero	0.000	0.000	0.000	0.000	0.000	0.024	fbmy8028_rel_native.cay9c
2.454	97.333	0.204	0.009	nonzero	0.000	0.000	0.000	0.000	0.000	0.024	fbmy8028_rel_o2_lto.cay9c
3.443	96.316	0.230	0.012	nonzero	0.000	0.000	0.000	0.000	0.000	0.030	fbmy8028_rel_lto.cay9c
4.209	95.621	0.160	0.009	nonzero	0.000	0.000	0.000	0.000	0.000	0.029	fbmy8028_rel_native_lto.cay9c
Insert response time histogram
256us	1ms	4ms	16ms	64ms	256ms	1s	4s	16s	gt	max	tag
0.000	0.000	86.264	13.591	0.144	0.001	0.000	0.000	0.000	0.000	0.070	fbmy8028_rel_withdbg.cay9c
0.000	0.000	87.533	12.308	0.159	0.001	0.000	0.000	0.000	0.000	0.068	fbmy8028_rel.cay9c
0.000	0.000	92.285	7.593	0.122	0.001	0.000	0.000	0.000	0.000	0.064	fbmy8028_rel_o2.cay9c
0.000	0.000	92.111	7.767	0.122	0.001	0.000	0.000	0.000	0.000	0.066	fbmy8028_rel_native.cay9c
0.000	0.000	86.456	13.365	0.176	0.002	0.000	0.000	0.000	0.000	0.097	fbmy8028_rel_o2_lto.cay9c
0.000	0.000	84.105	15.694	0.199	0.001	0.000	0.000	0.000	0.000	0.075	fbmy8028_rel_lto.cay9c
0.000	0.000	96.306	3.590	0.103	0.001	0.000	0.000	0.000	0.000	0.068	fbmy8028_rel_native_lto.cay9c