Introduction
This is a report for the insert benchmark with 20M docs and 4 client(s). It is generated by scripts (bash, awk, sed) and Tufte might not be impressed. An overview of the insert benchmark is here and a short update is here. Below, by DBMS, I mean DBMS+version.config. An example is my8020.c10b40 where my means MySQL, 8020 is version 8.0.20 and c10b40 is the name for the configuration file.
The test server has 8 AMD cores, 16G RAM and an NVMe SSD. It is described here as the Beelink. The benchmark was run with 4 clients and there were 1 or 2 connections per client (1 for queries, 1 for inserts). The benchmark loads 20M rows without secondary indexes, creates secondary indexes, loads another 20M rows then does 3 read+write tests for one hour each that do queries as fast as possible with 100, 500 and then 1000 writes/second/client concurrent with the queries. All clients share one table. The database is cached by the OS page cache but not by the storage engine. Clients and the DBMS share one server. The per-database configs are in the per-database subdirectories here.
The tested DBMS are:
- fbmy8028_rel_withdbg.cay9c1g - MyRocks 8.0.28, the cay9c1g config and compiled with CMAKE_BUILD_TYPE=RelWithDebInfo and -O2
- fbmy8028_rel.cay9c1g - MyRocks 8.0.28, the cay9c1g config and compiled with CMAKE_BUILD_TYPE=Release and -O3
- fbmy8028_rel_o2.cay9c1g - MyRocks 8.0.28, the cay9c1g config and compiled with CMAKE_BUILD_TYPE=Release and -O2
- fbmy8028_rel_native.cay9c1g - MyRocks 8.0.28, the cay9c1g config and compiled with CMAKE_BUILD_TYPE=Release and -O3 -march=native -mtune=native
- fbmy8028_rel_o2_lto.cay9c1g - MyRocks 8.0.28, the cay9c1g config and compiled with CMAKE_BUILD_TYPE=Release and -O2 -flto
- fbmy8028_rel_lto.cay9c1g - MyRocks 8.0.28, the cay9c1g config and compiled with CMAKE_BUILD_TYPE=Release and -O3 -flto
- fbmy8028_rel_native_lto.cay9c1g - MyRocks 8.0.28, the cay9c1g config and compiled with CMAKE_BUILD_TYPE=Release and -O3 -flto -march=native -mtune=native
Contents
- Summary
- l.i0: load without secondary indexes
- l.x: create secondary indexes
- l.i1: continue load after secondary indexes created
- q100.1: range queries with 100 insert/s per client
- q500.1: range queries with 500 insert/s per client
- q1000.1: range queries with 1000 insert/s per client
Summary
The numbers are inserts/s for l.i0 and l.i1, indexed docs (or rows) /s for l.x and queries/s for q*.2. The values are the average rate over the entire test for inserts (IPS) and queries (QPS). The range of values for IPS and QPS is split into 3 parts: bottom 25%, middle 50%, top 25%. Values in the bottom 25% have a red background, values in the top 25% have a green background and values in the middle have no color. A gray background is used for values that can be ignored because the DBMS did not sustain the target insert rate. Red backgrounds are not used when the minimum value is within 80% of the max value.
| dbms | l.i0 | l.x | l.i1 | q100.1 | q500.1 | q1000.1 |
|---|---|---|---|---|---|---|
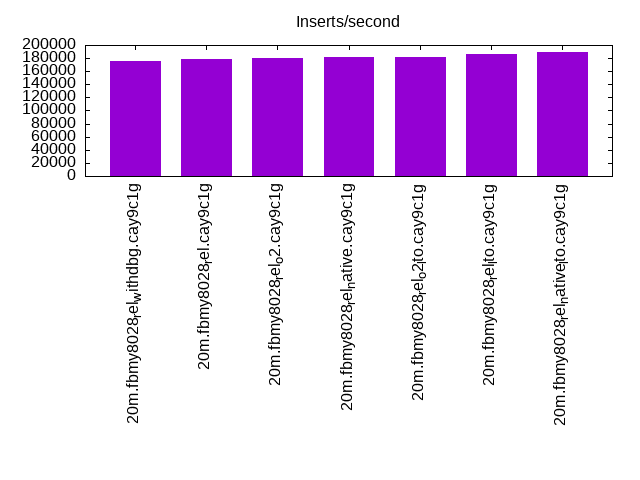
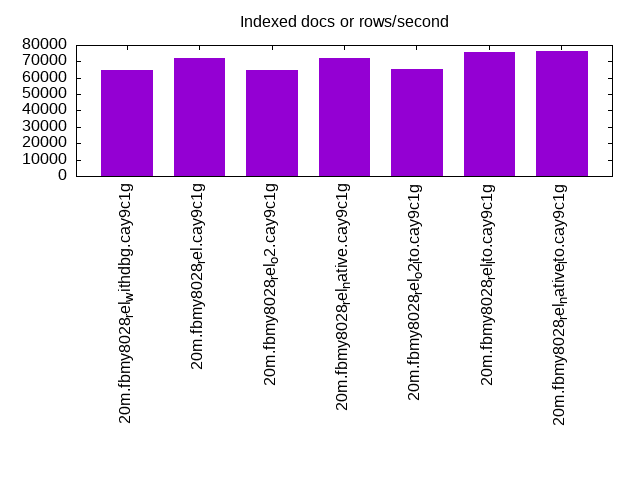
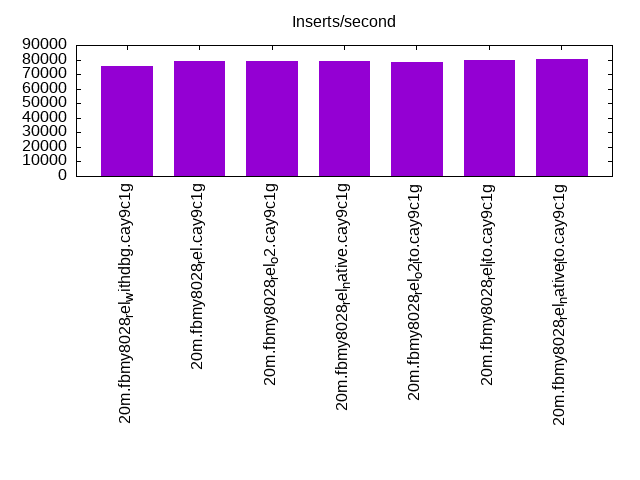
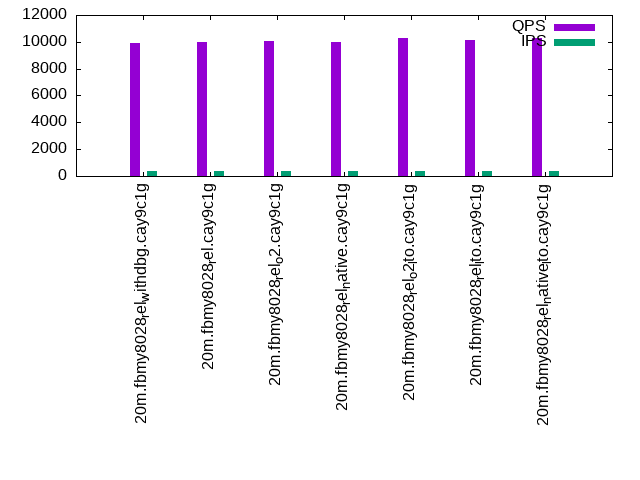
| 20m.fbmy8028_rel_withdbg.cay9c1g | 175438 | 64839 | 75472 | 9940 | 9626 | 9526 |
| 20m.fbmy8028_rel.cay9c1g | 178571 | 72043 | 78740 | 9973 | 9764 | 9623 |
| 20m.fbmy8028_rel_o2.cay9c1g | 180180 | 64839 | 79051 | 10043 | 9771 | 9544 |
| 20m.fbmy8028_rel_native.cay9c1g | 181818 | 71786 | 78740 | 9978 | 9631 | 9544 |
| 20m.fbmy8028_rel_o2_lto.cay9c1g | 181818 | 65472 | 78431 | 10321 | 9978 | 9740 |
| 20m.fbmy8028_rel_lto.cay9c1g | 186916 | 75849 | 79681 | 10104 | 9970 | 9906 |
| 20m.fbmy8028_rel_native_lto.cay9c1g | 188679 | 76136 | 80321 | 10251 | 9972 | 9915 |
This table has relative throughput, throughput for the DBMS relative to the DBMS in the first line, using the absolute throughput from the previous table.
| dbms | l.i0 | l.x | l.i1 | q100.1 | q500.1 | q1000.1 |
|---|---|---|---|---|---|---|
| 20m.fbmy8028_rel_withdbg.cay9c1g | 1.00 | 1.00 | 1.00 | 1.00 | 1.00 | 1.00 |
| 20m.fbmy8028_rel.cay9c1g | 1.02 | 1.11 | 1.04 | 1.00 | 1.01 | 1.01 |
| 20m.fbmy8028_rel_o2.cay9c1g | 1.03 | 1.00 | 1.05 | 1.01 | 1.02 | 1.00 |
| 20m.fbmy8028_rel_native.cay9c1g | 1.04 | 1.11 | 1.04 | 1.00 | 1.00 | 1.00 |
| 20m.fbmy8028_rel_o2_lto.cay9c1g | 1.04 | 1.01 | 1.04 | 1.04 | 1.04 | 1.02 |
| 20m.fbmy8028_rel_lto.cay9c1g | 1.07 | 1.17 | 1.06 | 1.02 | 1.04 | 1.04 |
| 20m.fbmy8028_rel_native_lto.cay9c1g | 1.08 | 1.17 | 1.06 | 1.03 | 1.04 | 1.04 |
This lists the average rate of inserts/s for the tests that do inserts concurrent with queries. For such tests the query rate is listed in the table above. The read+write tests are setup so that the insert rate should match the target rate every second. Cells that are not at least 95% of the target have a red background to indicate a failure to satisfy the target.
| dbms | q100.1 | q500.1 | q1000.1 |
|---|---|---|---|
| fbmy8028_rel_withdbg.cay9c1g | 399 | 1994 | 3989 |
| fbmy8028_rel.cay9c1g | 399 | 1993 | 3989 |
| fbmy8028_rel_o2.cay9c1g | 399 | 1994 | 3987 |
| fbmy8028_rel_native.cay9c1g | 399 | 1993 | 3989 |
| fbmy8028_rel_o2_lto.cay9c1g | 399 | 1994 | 3989 |
| fbmy8028_rel_lto.cay9c1g | 399 | 1994 | 3989 |
| fbmy8028_rel_native_lto.cay9c1g | 399 | 1994 | 3987 |
| target | 400 | 2000 | 4000 |
l.i0
l.i0: load without secondary indexes. Graphs for performance per 1-second interval are here.
Average throughput:
Insert response time histogram: each cell has the percentage of responses that take <= the time in the header and max is the max response time in seconds. For the max column values in the top 25% of the range have a red background and in the bottom 25% of the range have a green background. The red background is not used when the min value is within 80% of the max value.
| dbms | 256us | 1ms | 4ms | 16ms | 64ms | 256ms | 1s | 4s | 16s | gt | max |
|---|---|---|---|---|---|---|---|---|---|---|---|
| fbmy8028_rel_withdbg.cay9c1g | 99.354 | 0.402 | 0.230 | 0.013 | 0.125 | ||||||
| fbmy8028_rel.cay9c1g | 99.380 | 0.383 | 0.224 | 0.013 | 0.125 | ||||||
| fbmy8028_rel_o2.cay9c1g | 99.349 | 0.421 | 0.216 | 0.013 | 0.126 | ||||||
| fbmy8028_rel_native.cay9c1g | 99.359 | 0.439 | 0.189 | 0.013 | 0.115 | ||||||
| fbmy8028_rel_o2_lto.cay9c1g | 99.359 | 0.411 | 0.216 | 0.013 | 0.125 | ||||||
| fbmy8028_rel_lto.cay9c1g | 99.364 | 0.394 | 0.228 | 0.013 | 0.114 | ||||||
| fbmy8028_rel_native_lto.cay9c1g | 99.384 | 0.370 | 0.232 | 0.013 | 0.114 |
Performance metrics for the DBMS listed above. Some are normalized by throughput, others are not. Legend for results is here.
ips	qps	rps	rmbps	wps	wmbps	rpq	rkbpq	wpi	wkbpi	csps	cpups	cspq	cpupq	dbgb1	dbgb2	rss	maxop	p50	p99	tag
175438	0	0	0.0	102.1	37.6	0.000	0.000	0.001	0.219	17550	67.6	0.100	31	0.7	1.9	0.7	0.125	50346	6895	20m.fbmy8028_rel_withdbg.cay9c1g
178571	0	0	0.0	99.4	36.5	0.000	0.000	0.001	0.209	17669	67.4	0.099	30	0.7	1.9	0.7	0.125	50662	11887	20m.fbmy8028_rel.cay9c1g
180180	0	0	0.0	103.5	38.1	0.000	0.000	0.001	0.217	17677	67.8	0.098	30	0.7	1.9	0.7	0.126	51044	20478	20m.fbmy8028_rel_o2.cay9c1g
181818	0	0	0.0	103.0	38.2	0.000	0.000	0.001	0.215	17829	67.5	0.098	30	0.7	1.9	0.7	0.115	51543	39469	20m.fbmy8028_rel_native.cay9c1g
181818	0	0	0.0	103.5	38.0	0.000	0.000	0.001	0.214	17631	67.5	0.097	30	0.7	1.9	0.7	0.125	51444	8990	20m.fbmy8028_rel_o2_lto.cay9c1g
186916	0	0	0.0	105.8	39.1	0.000	0.000	0.001	0.214	18226	68.2	0.098	29	0.7	1.9	0.7	0.114	52941	42568	20m.fbmy8028_rel_lto.cay9c1g
188679	0	0	0.0	103.7	38.1	0.000	0.000	0.001	0.207	18379	68.2	0.097	29	0.7	2.0	0.7	0.114	53548	400	20m.fbmy8028_rel_native_lto.cay9c1g
l.x
l.x: create secondary indexes.
Average throughput:
Performance metrics for the DBMS listed above. Some are normalized by throughput, others are not. Legend for results is here.
ips	qps	rps	rmbps	wps	wmbps	rpq	rkbpq	wpi	wkbpi	csps	cpups	cspq	cpupq	dbgb1	dbgb2	rss	maxop	p50	p99	tag
64839	0	0	0.0	25.7	9.8	0.000	0.000	0.000	0.155	365	12.7	0.006	16	1.4	2.7	1.9	0.011	NA	NA	20m.fbmy8028_rel_withdbg.cay9c1g
72043	0	0	0.0	28.1	10.9	0.000	0.000	0.000	0.155	381	12.8	0.005	14	1.4	2.6	1.9	0.007	NA	NA	20m.fbmy8028_rel.cay9c1g
64839	0	0	0.0	25.6	9.8	0.000	0.000	0.000	0.155	342	12.8	0.005	16	1.4	2.6	1.9	0.007	NA	NA	20m.fbmy8028_rel_o2.cay9c1g
71786	0	0	0.0	27.9	10.8	0.000	0.000	0.000	0.155	364	12.7	0.005	14	1.4	2.7	1.9	0.008	NA	NA	20m.fbmy8028_rel_native.cay9c1g
65472	0	0	0.0	25.8	9.9	0.000	0.000	0.000	0.156	359	12.7	0.005	16	1.4	2.6	1.9	0.008	NA	NA	20m.fbmy8028_rel_o2_lto.cay9c1g
75849	0	0	0.0	29.8	11.5	0.000	0.000	0.000	0.156	407	12.7	0.005	13	1.4	2.7	1.9	0.009	NA	NA	20m.fbmy8028_rel_lto.cay9c1g
76136	0	0	0.0	29.6	11.5	0.000	0.000	0.000	0.155	373	12.7	0.005	13	1.4	2.6	1.9	0.008	NA	NA	20m.fbmy8028_rel_native_lto.cay9c1g
l.i1
l.i1: continue load after secondary indexes created. Graphs for performance per 1-second interval are here.
Average throughput:
Insert response time histogram: each cell has the percentage of responses that take <= the time in the header and max is the max response time in seconds. For the max column values in the top 25% of the range have a red background and in the bottom 25% of the range have a green background. The red background is not used when the min value is within 80% of the max value.
| dbms | 256us | 1ms | 4ms | 16ms | 64ms | 256ms | 1s | 4s | 16s | gt | max |
|---|---|---|---|---|---|---|---|---|---|---|---|
| fbmy8028_rel_withdbg.cay9c1g | 98.932 | 0.933 | 0.133 | 0.002 | 0.120 | ||||||
| fbmy8028_rel.cay9c1g | 99.127 | 0.739 | 0.130 | 0.004 | 0.121 | ||||||
| fbmy8028_rel_o2.cay9c1g | 99.035 | 0.839 | 0.120 | 0.006 | 0.130 | ||||||
| fbmy8028_rel_native.cay9c1g | 99.041 | 0.836 | 0.118 | 0.005 | 0.131 | ||||||
| fbmy8028_rel_o2_lto.cay9c1g | 99.074 | 0.795 | 0.125 | 0.006 | 0.152 | ||||||
| fbmy8028_rel_lto.cay9c1g | 99.130 | 0.748 | 0.116 | 0.006 | 0.117 | ||||||
| fbmy8028_rel_native_lto.cay9c1g | 99.120 | 0.757 | 0.117 | 0.006 | 0.133 |
Performance metrics for the DBMS listed above. Some are normalized by throughput, others are not. Legend for results is here.
ips	qps	rps	rmbps	wps	wmbps	rpq	rkbpq	wpi	wkbpi	csps	cpups	cspq	cpupq	dbgb1	dbgb2	rss	maxop	p50	p99	tag
75472	0	3	0.4	149.4	57.9	0.000	0.005	0.002	0.785	17092	71.9	0.226	76	3.9	5.8	1.7	0.120	19129	16133	20m.fbmy8028_rel_withdbg.cay9c1g
78740	0	0	0.0	154.7	59.8	0.000	0.000	0.002	0.778	17728	71.8	0.225	73	4.7	6.6	1.8	0.121	20128	16482	20m.fbmy8028_rel.cay9c1g
79051	0	6	0.8	150.0	58.7	0.000	0.010	0.002	0.760	17756	72.0	0.225	73	4.4	6.3	1.7	0.130	20228	16685	20m.fbmy8028_rel_o2.cay9c1g
78740	0	9	1.2	149.0	58.1	0.000	0.015	0.002	0.756	17626	71.3	0.224	72	4.0	5.9	1.7	0.131	20136	16468	20m.fbmy8028_rel_native.cay9c1g
78431	0	0	0.0	151.1	58.9	0.000	0.000	0.002	0.768	17623	72.2	0.225	74	5.3	7.2	1.8	0.152	20028	16232	20m.fbmy8028_rel_o2_lto.cay9c1g
79681	0	12	1.6	153.9	60.2	0.000	0.020	0.002	0.774	17849	71.3	0.224	72	3.5	5.4	1.8	0.117	20278	16432	20m.fbmy8028_rel_lto.cay9c1g
80321	0	6	0.8	155.7	60.5	0.000	0.010	0.002	0.772	18091	71.2	0.225	71	3.8	5.7	1.7	0.133	20436	15983	20m.fbmy8028_rel_native_lto.cay9c1g
q100.1
q100.1: range queries with 100 insert/s per client. Graphs for performance per 1-second interval are here.
Average throughput:
Query response time histogram: each cell has the percentage of responses that take <= the time in the header and max is the max response time in seconds. For max values in the top 25% of the range have a red background and in the bottom 25% of the range have a green background. The red background is not used when the min value is within 80% of the max value.
| dbms | 256us | 1ms | 4ms | 16ms | 64ms | 256ms | 1s | 4s | 16s | gt | max |
|---|---|---|---|---|---|---|---|---|---|---|---|
| fbmy8028_rel_withdbg.cay9c1g | 1.917 | 98.066 | 0.017 | 0.001 | 0.010 | ||||||
| fbmy8028_rel.cay9c1g | 3.169 | 96.816 | 0.014 | 0.001 | 0.009 | ||||||
| fbmy8028_rel_o2.cay9c1g | 3.026 | 96.959 | 0.013 | 0.001 | 0.013 | ||||||
| fbmy8028_rel_native.cay9c1g | 2.697 | 97.286 | 0.016 | 0.001 | 0.009 | ||||||
| fbmy8028_rel_o2_lto.cay9c1g | 6.654 | 93.332 | 0.013 | 0.001 | nonzero | 0.157 | |||||
| fbmy8028_rel_lto.cay9c1g | 4.915 | 95.071 | 0.014 | 0.001 | nonzero | 0.017 | |||||
| fbmy8028_rel_native_lto.cay9c1g | 6.958 | 93.028 | 0.013 | 0.001 | nonzero | 0.019 |
Insert response time histogram: each cell has the percentage of responses that take <= the time in the header and max is the max response time in seconds. For max values in the top 25% of the range have a red background and in the bottom 25% of the range have a green background. The red background is not used when the min value is within 80% of the max value.
| dbms | 256us | 1ms | 4ms | 16ms | 64ms | 256ms | 1s | 4s | 16s | gt | max |
|---|---|---|---|---|---|---|---|---|---|---|---|
| fbmy8028_rel_withdbg.cay9c1g | 99.208 | 0.729 | 0.062 | 0.019 | |||||||
| fbmy8028_rel.cay9c1g | 99.333 | 0.639 | 0.028 | 0.017 | |||||||
| fbmy8028_rel_o2.cay9c1g | 99.535 | 0.424 | 0.042 | 0.017 | |||||||
| fbmy8028_rel_native.cay9c1g | 99.458 | 0.500 | 0.042 | 0.017 | |||||||
| fbmy8028_rel_o2_lto.cay9c1g | 99.493 | 0.465 | 0.042 | 0.017 | |||||||
| fbmy8028_rel_lto.cay9c1g | 99.750 | 0.215 | 0.035 | 0.023 | |||||||
| fbmy8028_rel_native_lto.cay9c1g | 99.097 | 0.854 | 0.049 | 0.021 |
Performance metrics for the DBMS listed above. Some are normalized by throughput, others are not. Legend for results is here.
ips	qps	rps	rmbps	wps	wmbps	rpq	rkbpq	wpi	wkbpi	csps	cpups	cspq	cpupq	dbgb1	dbgb2	rss	maxop	p50	p99	tag
399	9940	34	0.4	7.7	1.9	0.003	0.036	0.019	4.803	37773	51.3	3.800	413	2.8	4.8	1.9	0.010	2509	1870	20m.fbmy8028_rel_withdbg.cay9c1g
399	9973	43	0.4	7.6	1.8	0.004	0.042	0.019	4.749	37828	51.2	3.793	411	2.8	4.8	1.8	0.009	2525	1950	20m.fbmy8028_rel.cay9c1g
399	10043	25	0.3	7.6	1.8	0.002	0.030	0.019	4.601	38090	51.2	3.793	408	2.8	4.8	1.8	0.013	2558	1999	20m.fbmy8028_rel_o2.cay9c1g
399	9978	16	0.2	7.3	1.7	0.002	0.025	0.018	4.313	37935	51.1	3.802	410	2.8	4.8	1.8	0.009	2525	1982	20m.fbmy8028_rel_native.cay9c1g
399	10321	43	0.4	8.0	2.0	0.004	0.040	0.020	5.193	39048	51.3	3.783	398	2.8	4.8	1.9	0.157	2557	2046	20m.fbmy8028_rel_o2_lto.cay9c1g
399	10104	8	0.2	6.6	1.4	0.001	0.019	0.017	3.639	38318	51.0	3.792	404	2.9	4.9	1.8	0.017	2525	2062	20m.fbmy8028_rel_lto.cay9c1g
399	10251	25	0.3	7.3	1.7	0.002	0.030	0.018	4.346	38914	51.2	3.796	400	2.8	4.9	1.8	0.019	2589	2030	20m.fbmy8028_rel_native_lto.cay9c1g
q500.1
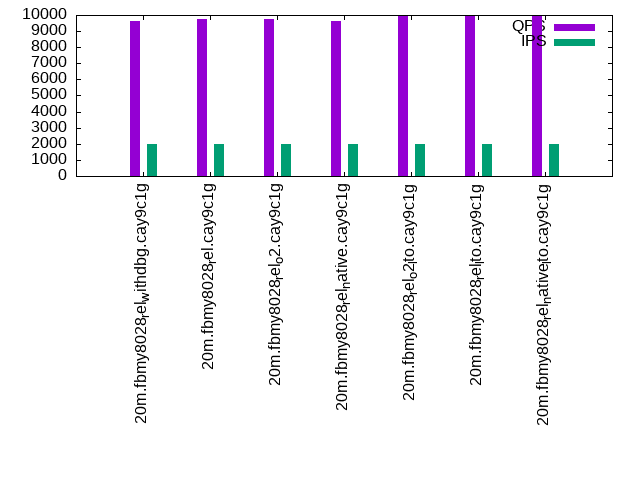
q500.1: range queries with 500 insert/s per client. Graphs for performance per 1-second interval are here.
Average throughput:
Query response time histogram: each cell has the percentage of responses that take <= the time in the header and max is the max response time in seconds. For max values in the top 25% of the range have a red background and in the bottom 25% of the range have a green background. The red background is not used when the min value is within 80% of the max value.
| dbms | 256us | 1ms | 4ms | 16ms | 64ms | 256ms | 1s | 4s | 16s | gt | max |
|---|---|---|---|---|---|---|---|---|---|---|---|
| fbmy8028_rel_withdbg.cay9c1g | 0.588 | 99.324 | 0.083 | 0.005 | nonzero | 0.018 | |||||
| fbmy8028_rel.cay9c1g | 1.057 | 98.862 | 0.077 | 0.004 | nonzero | 0.019 | |||||
| fbmy8028_rel_o2.cay9c1g | 0.704 | 99.224 | 0.068 | 0.003 | nonzero | 0.017 | |||||
| fbmy8028_rel_native.cay9c1g | 0.583 | 99.335 | 0.078 | 0.004 | nonzero | 0.016 | |||||
| fbmy8028_rel_o2_lto.cay9c1g | 2.199 | 97.722 | 0.075 | 0.004 | nonzero | 0.018 | |||||
| fbmy8028_rel_lto.cay9c1g | 2.889 | 97.027 | 0.079 | 0.005 | nonzero | 0.036 | |||||
| fbmy8028_rel_native_lto.cay9c1g | 3.574 | 96.350 | 0.071 | 0.005 | nonzero | 0.019 |
Insert response time histogram: each cell has the percentage of responses that take <= the time in the header and max is the max response time in seconds. For max values in the top 25% of the range have a red background and in the bottom 25% of the range have a green background. The red background is not used when the min value is within 80% of the max value.
| dbms | 256us | 1ms | 4ms | 16ms | 64ms | 256ms | 1s | 4s | 16s | gt | max |
|---|---|---|---|---|---|---|---|---|---|---|---|
| fbmy8028_rel_withdbg.cay9c1g | 95.029 | 4.872 | 0.097 | 0.001 | 0.068 | ||||||
| fbmy8028_rel.cay9c1g | 96.150 | 3.760 | 0.090 | 0.064 | |||||||
| fbmy8028_rel_o2.cay9c1g | 98.860 | 1.083 | 0.057 | 0.062 | |||||||
| fbmy8028_rel_native.cay9c1g | 95.571 | 4.333 | 0.096 | 0.063 | |||||||
| fbmy8028_rel_o2_lto.cay9c1g | 94.819 | 5.081 | 0.100 | 0.062 | |||||||
| fbmy8028_rel_lto.cay9c1g | 95.251 | 4.653 | 0.096 | 0.063 | |||||||
| fbmy8028_rel_native_lto.cay9c1g | 94.074 | 5.794 | 0.132 | 0.062 |
Performance metrics for the DBMS listed above. Some are normalized by throughput, others are not. Legend for results is here.
ips	qps	rps	rmbps	wps	wmbps	rpq	rkbpq	wpi	wkbpi	csps	cpups	cspq	cpupq	dbgb1	dbgb2	rss	maxop	p50	p99	tag
1994	9626	0	0.0	7.6	1.8	0.000	0.000	0.004	0.948	36467	51.7	3.788	430	3.2	3.6	1.9	0.018	2382	1950	20m.fbmy8028_rel_withdbg.cay9c1g
1993	9764	0	0.0	6.9	1.6	0.000	0.000	0.003	0.802	37055	51.4	3.795	421	3.2	3.6	1.8	0.019	2477	1998	20m.fbmy8028_rel.cay9c1g
1994	9771	0	0.0	7.2	1.6	0.000	0.000	0.004	0.846	37112	51.4	3.798	421	3.2	3.6	1.8	0.017	2413	1966	20m.fbmy8028_rel_o2.cay9c1g
1993	9631	0	0.0	6.8	1.5	0.000	0.000	0.003	0.776	36592	51.4	3.799	427	3.2	3.7	1.8	0.016	2461	1966	20m.fbmy8028_rel_native.cay9c1g
1994	9978	0	0.0	7.1	1.6	0.000	0.000	0.004	0.832	37797	51.4	3.788	412	3.2	3.6	1.8	0.018	2509	2046	20m.fbmy8028_rel_o2_lto.cay9c1g
1994	9970	0	0.0	7.8	2.0	0.000	0.000	0.004	1.026	37762	51.6	3.788	414	3.1	3.6	1.7	0.036	2525	2062	20m.fbmy8028_rel_lto.cay9c1g
1994	9972	0	0.0	7.3	1.7	0.000	0.000	0.004	0.870	37741	51.5	3.785	413	3.2	3.6	1.8	0.019	2557	2094	20m.fbmy8028_rel_native_lto.cay9c1g
q1000.1
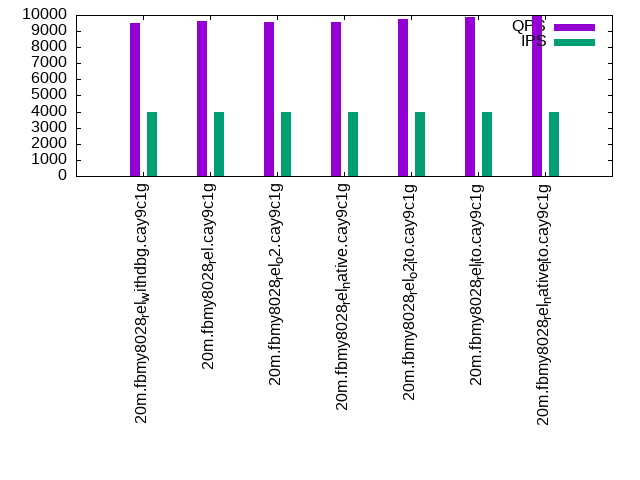
q1000.1: range queries with 1000 insert/s per client. Graphs for performance per 1-second interval are here.
Average throughput:
Query response time histogram: each cell has the percentage of responses that take <= the time in the header and max is the max response time in seconds. For max values in the top 25% of the range have a red background and in the bottom 25% of the range have a green background. The red background is not used when the min value is within 80% of the max value.
| dbms | 256us | 1ms | 4ms | 16ms | 64ms | 256ms | 1s | 4s | 16s | gt | max |
|---|---|---|---|---|---|---|---|---|---|---|---|
| fbmy8028_rel_withdbg.cay9c1g | 0.386 | 99.389 | 0.217 | 0.008 | nonzero | 0.020 | |||||
| fbmy8028_rel.cay9c1g | 0.626 | 99.151 | 0.215 | 0.008 | nonzero | 0.019 | |||||
| fbmy8028_rel_o2.cay9c1g | 0.451 | 99.316 | 0.225 | 0.009 | nonzero | 0.024 | |||||
| fbmy8028_rel_native.cay9c1g | 0.507 | 99.266 | 0.219 | 0.008 | nonzero | 0.026 | |||||
| fbmy8028_rel_o2_lto.cay9c1g | 1.008 | 98.763 | 0.219 | 0.009 | nonzero | 0.022 | |||||
| fbmy8028_rel_lto.cay9c1g | 1.885 | 97.913 | 0.195 | 0.007 | nonzero | 0.024 | |||||
| fbmy8028_rel_native_lto.cay9c1g | 2.372 | 97.424 | 0.197 | 0.008 | nonzero | 0.037 |
Insert response time histogram: each cell has the percentage of responses that take <= the time in the header and max is the max response time in seconds. For max values in the top 25% of the range have a red background and in the bottom 25% of the range have a green background. The red background is not used when the min value is within 80% of the max value.
| dbms | 256us | 1ms | 4ms | 16ms | 64ms | 256ms | 1s | 4s | 16s | gt | max |
|---|---|---|---|---|---|---|---|---|---|---|---|
| fbmy8028_rel_withdbg.cay9c1g | 91.243 | 8.634 | 0.122 | 0.001 | 0.066 | ||||||
| fbmy8028_rel.cay9c1g | 87.828 | 11.999 | 0.172 | 0.001 | 0.068 | ||||||
| fbmy8028_rel_o2.cay9c1g | 87.003 | 12.822 | 0.175 | 0.060 | |||||||
| fbmy8028_rel_native.cay9c1g | 90.968 | 8.899 | 0.132 | 0.001 | 0.068 | ||||||
| fbmy8028_rel_o2_lto.cay9c1g | 84.478 | 15.341 | 0.180 | 0.001 | 0.071 | ||||||
| fbmy8028_rel_lto.cay9c1g | 90.315 | 9.529 | 0.155 | 0.001 | 0.068 | ||||||
| fbmy8028_rel_native_lto.cay9c1g | 90.328 | 9.533 | 0.139 | 0.061 |
Performance metrics for the DBMS listed above. Some are normalized by throughput, others are not. Legend for results is here.
ips	qps	rps	rmbps	wps	wmbps	rpq	rkbpq	wpi	wkbpi	csps	cpups	cspq	cpupq	dbgb1	dbgb2	rss	maxop	p50	p99	tag
3989	9526	0	0.0	14.3	4.5	0.000	0.000	0.004	1.150	35769	53.7	3.755	451	3.7	5.1	1.9	0.020	2398	1999	20m.fbmy8028_rel_withdbg.cay9c1g
3989	9623	0	0.0	14.8	4.8	0.000	0.000	0.004	1.229	36130	53.6	3.755	446	3.7	5.1	1.8	0.019	2414	1999	20m.fbmy8028_rel.cay9c1g
3987	9544	0	0.0	14.8	4.7	0.000	0.000	0.004	1.213	35826	53.7	3.754	450	3.7	5.1	1.9	0.024	2413	1966	20m.fbmy8028_rel_o2.cay9c1g
3989	9544	0	0.0	15.2	4.8	0.000	0.000	0.004	1.244	35849	53.8	3.756	451	3.7	5.1	1.8	0.026	2413	1998	20m.fbmy8028_rel_native.cay9c1g
3989	9740	0	0.0	15.4	5.0	0.000	0.000	0.004	1.285	36448	54.0	3.742	444	3.6	5.0	1.8	0.022	2445	2014	20m.fbmy8028_rel_o2_lto.cay9c1g
3989	9906	0	0.0	13.8	4.3	0.000	0.000	0.003	1.111	37179	53.4	3.753	431	3.7	5.1	1.8	0.024	2509	2030	20m.fbmy8028_rel_lto.cay9c1g
3987	9915	0	0.0	14.7	4.8	0.000	0.000	0.004	1.234	37126	53.8	3.745	434	3.9	5.3	1.8	0.037	2493	2014	20m.fbmy8028_rel_native_lto.cay9c1g
l.i0
l.i0: load without secondary indexes
Performance metrics for all DBMS, not just the ones listed above. Some are normalized by throughput, others are not. Legend for results is here.
ips	qps	rps	rmbps	wps	wmbps	rpq	rkbpq	wpi	wkbpi	csps	cpups	cspq	cpupq	dbgb1	dbgb2	rss	maxop	p50	p99	tag
175438	0	0	0.0	102.1	37.6	0.000	0.000	0.001	0.219	17550	67.6	0.100	31	0.7	1.9	0.7	0.125	50346	6895	20m.fbmy8028_rel_withdbg.cay9c1g
178571	0	0	0.0	99.4	36.5	0.000	0.000	0.001	0.209	17669	67.4	0.099	30	0.7	1.9	0.7	0.125	50662	11887	20m.fbmy8028_rel.cay9c1g
180180	0	0	0.0	103.5	38.1	0.000	0.000	0.001	0.217	17677	67.8	0.098	30	0.7	1.9	0.7	0.126	51044	20478	20m.fbmy8028_rel_o2.cay9c1g
181818	0	0	0.0	103.0	38.2	0.000	0.000	0.001	0.215	17829	67.5	0.098	30	0.7	1.9	0.7	0.115	51543	39469	20m.fbmy8028_rel_native.cay9c1g
181818	0	0	0.0	103.5	38.0	0.000	0.000	0.001	0.214	17631	67.5	0.097	30	0.7	1.9	0.7	0.125	51444	8990	20m.fbmy8028_rel_o2_lto.cay9c1g
186916	0	0	0.0	105.8	39.1	0.000	0.000	0.001	0.214	18226	68.2	0.098	29	0.7	1.9	0.7	0.114	52941	42568	20m.fbmy8028_rel_lto.cay9c1g
188679	0	0	0.0	103.7	38.1	0.000	0.000	0.001	0.207	18379	68.2	0.097	29	0.7	2.0	0.7	0.114	53548	400	20m.fbmy8028_rel_native_lto.cay9c1g
l.x
l.x: create secondary indexes
Performance metrics for all DBMS, not just the ones listed above. Some are normalized by throughput, others are not. Legend for results is here.
ips	qps	rps	rmbps	wps	wmbps	rpq	rkbpq	wpi	wkbpi	csps	cpups	cspq	cpupq	dbgb1	dbgb2	rss	maxop	p50	p99	tag
64839	0	0	0.0	25.7	9.8	0.000	0.000	0.000	0.155	365	12.7	0.006	16	1.4	2.7	1.9	0.011	NA	NA	20m.fbmy8028_rel_withdbg.cay9c1g
72043	0	0	0.0	28.1	10.9	0.000	0.000	0.000	0.155	381	12.8	0.005	14	1.4	2.6	1.9	0.007	NA	NA	20m.fbmy8028_rel.cay9c1g
64839	0	0	0.0	25.6	9.8	0.000	0.000	0.000	0.155	342	12.8	0.005	16	1.4	2.6	1.9	0.007	NA	NA	20m.fbmy8028_rel_o2.cay9c1g
71786	0	0	0.0	27.9	10.8	0.000	0.000	0.000	0.155	364	12.7	0.005	14	1.4	2.7	1.9	0.008	NA	NA	20m.fbmy8028_rel_native.cay9c1g
65472	0	0	0.0	25.8	9.9	0.000	0.000	0.000	0.156	359	12.7	0.005	16	1.4	2.6	1.9	0.008	NA	NA	20m.fbmy8028_rel_o2_lto.cay9c1g
75849	0	0	0.0	29.8	11.5	0.000	0.000	0.000	0.156	407	12.7	0.005	13	1.4	2.7	1.9	0.009	NA	NA	20m.fbmy8028_rel_lto.cay9c1g
76136	0	0	0.0	29.6	11.5	0.000	0.000	0.000	0.155	373	12.7	0.005	13	1.4	2.6	1.9	0.008	NA	NA	20m.fbmy8028_rel_native_lto.cay9c1g
l.i1
l.i1: continue load after secondary indexes created
Performance metrics for all DBMS, not just the ones listed above. Some are normalized by throughput, others are not. Legend for results is here.
ips	qps	rps	rmbps	wps	wmbps	rpq	rkbpq	wpi	wkbpi	csps	cpups	cspq	cpupq	dbgb1	dbgb2	rss	maxop	p50	p99	tag
75472	0	3	0.4	149.4	57.9	0.000	0.005	0.002	0.785	17092	71.9	0.226	76	3.9	5.8	1.7	0.120	19129	16133	20m.fbmy8028_rel_withdbg.cay9c1g
78740	0	0	0.0	154.7	59.8	0.000	0.000	0.002	0.778	17728	71.8	0.225	73	4.7	6.6	1.8	0.121	20128	16482	20m.fbmy8028_rel.cay9c1g
79051	0	6	0.8	150.0	58.7	0.000	0.010	0.002	0.760	17756	72.0	0.225	73	4.4	6.3	1.7	0.130	20228	16685	20m.fbmy8028_rel_o2.cay9c1g
78740	0	9	1.2	149.0	58.1	0.000	0.015	0.002	0.756	17626	71.3	0.224	72	4.0	5.9	1.7	0.131	20136	16468	20m.fbmy8028_rel_native.cay9c1g
78431	0	0	0.0	151.1	58.9	0.000	0.000	0.002	0.768	17623	72.2	0.225	74	5.3	7.2	1.8	0.152	20028	16232	20m.fbmy8028_rel_o2_lto.cay9c1g
79681	0	12	1.6	153.9	60.2	0.000	0.020	0.002	0.774	17849	71.3	0.224	72	3.5	5.4	1.8	0.117	20278	16432	20m.fbmy8028_rel_lto.cay9c1g
80321	0	6	0.8	155.7	60.5	0.000	0.010	0.002	0.772	18091	71.2	0.225	71	3.8	5.7	1.7	0.133	20436	15983	20m.fbmy8028_rel_native_lto.cay9c1g
q100.1
q100.1: range queries with 100 insert/s per client
Performance metrics for all DBMS, not just the ones listed above. Some are normalized by throughput, others are not. Legend for results is here.
ips	qps	rps	rmbps	wps	wmbps	rpq	rkbpq	wpi	wkbpi	csps	cpups	cspq	cpupq	dbgb1	dbgb2	rss	maxop	p50	p99	tag
399	9940	34	0.4	7.7	1.9	0.003	0.036	0.019	4.803	37773	51.3	3.800	413	2.8	4.8	1.9	0.010	2509	1870	20m.fbmy8028_rel_withdbg.cay9c1g
399	9973	43	0.4	7.6	1.8	0.004	0.042	0.019	4.749	37828	51.2	3.793	411	2.8	4.8	1.8	0.009	2525	1950	20m.fbmy8028_rel.cay9c1g
399	10043	25	0.3	7.6	1.8	0.002	0.030	0.019	4.601	38090	51.2	3.793	408	2.8	4.8	1.8	0.013	2558	1999	20m.fbmy8028_rel_o2.cay9c1g
399	9978	16	0.2	7.3	1.7	0.002	0.025	0.018	4.313	37935	51.1	3.802	410	2.8	4.8	1.8	0.009	2525	1982	20m.fbmy8028_rel_native.cay9c1g
399	10321	43	0.4	8.0	2.0	0.004	0.040	0.020	5.193	39048	51.3	3.783	398	2.8	4.8	1.9	0.157	2557	2046	20m.fbmy8028_rel_o2_lto.cay9c1g
399	10104	8	0.2	6.6	1.4	0.001	0.019	0.017	3.639	38318	51.0	3.792	404	2.9	4.9	1.8	0.017	2525	2062	20m.fbmy8028_rel_lto.cay9c1g
399	10251	25	0.3	7.3	1.7	0.002	0.030	0.018	4.346	38914	51.2	3.796	400	2.8	4.9	1.8	0.019	2589	2030	20m.fbmy8028_rel_native_lto.cay9c1g
q500.1
q500.1: range queries with 500 insert/s per client
Performance metrics for all DBMS, not just the ones listed above. Some are normalized by throughput, others are not. Legend for results is here.
ips	qps	rps	rmbps	wps	wmbps	rpq	rkbpq	wpi	wkbpi	csps	cpups	cspq	cpupq	dbgb1	dbgb2	rss	maxop	p50	p99	tag
1994	9626	0	0.0	7.6	1.8	0.000	0.000	0.004	0.948	36467	51.7	3.788	430	3.2	3.6	1.9	0.018	2382	1950	20m.fbmy8028_rel_withdbg.cay9c1g
1993	9764	0	0.0	6.9	1.6	0.000	0.000	0.003	0.802	37055	51.4	3.795	421	3.2	3.6	1.8	0.019	2477	1998	20m.fbmy8028_rel.cay9c1g
1994	9771	0	0.0	7.2	1.6	0.000	0.000	0.004	0.846	37112	51.4	3.798	421	3.2	3.6	1.8	0.017	2413	1966	20m.fbmy8028_rel_o2.cay9c1g
1993	9631	0	0.0	6.8	1.5	0.000	0.000	0.003	0.776	36592	51.4	3.799	427	3.2	3.7	1.8	0.016	2461	1966	20m.fbmy8028_rel_native.cay9c1g
1994	9978	0	0.0	7.1	1.6	0.000	0.000	0.004	0.832	37797	51.4	3.788	412	3.2	3.6	1.8	0.018	2509	2046	20m.fbmy8028_rel_o2_lto.cay9c1g
1994	9970	0	0.0	7.8	2.0	0.000	0.000	0.004	1.026	37762	51.6	3.788	414	3.1	3.6	1.7	0.036	2525	2062	20m.fbmy8028_rel_lto.cay9c1g
1994	9972	0	0.0	7.3	1.7	0.000	0.000	0.004	0.870	37741	51.5	3.785	413	3.2	3.6	1.8	0.019	2557	2094	20m.fbmy8028_rel_native_lto.cay9c1g
q1000.1
q1000.1: range queries with 1000 insert/s per client
Performance metrics for all DBMS, not just the ones listed above. Some are normalized by throughput, others are not. Legend for results is here.
ips	qps	rps	rmbps	wps	wmbps	rpq	rkbpq	wpi	wkbpi	csps	cpups	cspq	cpupq	dbgb1	dbgb2	rss	maxop	p50	p99	tag
3989	9526	0	0.0	14.3	4.5	0.000	0.000	0.004	1.150	35769	53.7	3.755	451	3.7	5.1	1.9	0.020	2398	1999	20m.fbmy8028_rel_withdbg.cay9c1g
3989	9623	0	0.0	14.8	4.8	0.000	0.000	0.004	1.229	36130	53.6	3.755	446	3.7	5.1	1.8	0.019	2414	1999	20m.fbmy8028_rel.cay9c1g
3987	9544	0	0.0	14.8	4.7	0.000	0.000	0.004	1.213	35826	53.7	3.754	450	3.7	5.1	1.9	0.024	2413	1966	20m.fbmy8028_rel_o2.cay9c1g
3989	9544	0	0.0	15.2	4.8	0.000	0.000	0.004	1.244	35849	53.8	3.756	451	3.7	5.1	1.8	0.026	2413	1998	20m.fbmy8028_rel_native.cay9c1g
3989	9740	0	0.0	15.4	5.0	0.000	0.000	0.004	1.285	36448	54.0	3.742	444	3.6	5.0	1.8	0.022	2445	2014	20m.fbmy8028_rel_o2_lto.cay9c1g
3989	9906	0	0.0	13.8	4.3	0.000	0.000	0.003	1.111	37179	53.4	3.753	431	3.7	5.1	1.8	0.024	2509	2030	20m.fbmy8028_rel_lto.cay9c1g
3987	9915	0	0.0	14.7	4.8	0.000	0.000	0.004	1.234	37126	53.8	3.745	434	3.9	5.3	1.8	0.037	2493	2014	20m.fbmy8028_rel_native_lto.cay9c1g
l.i0
- l.i0: load without secondary indexes
- Legend for results is here.
- Each entry lists the percentage of responses that fit in that bucket (slower than max time for previous bucket, faster than min time for next bucket).
Insert response time histogram
256us	1ms	4ms	16ms	64ms	256ms	1s	4s	16s	gt	max	tag
0.000	0.000	99.354	0.402	0.230	0.013	0.000	0.000	0.000	0.000	0.125	fbmy8028_rel_withdbg.cay9c1g
0.000	0.000	99.380	0.383	0.224	0.013	0.000	0.000	0.000	0.000	0.125	fbmy8028_rel.cay9c1g
0.000	0.000	99.349	0.421	0.216	0.013	0.000	0.000	0.000	0.000	0.126	fbmy8028_rel_o2.cay9c1g
0.000	0.000	99.359	0.439	0.189	0.013	0.000	0.000	0.000	0.000	0.115	fbmy8028_rel_native.cay9c1g
0.000	0.000	99.359	0.411	0.216	0.013	0.000	0.000	0.000	0.000	0.125	fbmy8028_rel_o2_lto.cay9c1g
0.000	0.000	99.364	0.394	0.228	0.013	0.000	0.000	0.000	0.000	0.114	fbmy8028_rel_lto.cay9c1g
0.000	0.000	99.384	0.370	0.232	0.013	0.000	0.000	0.000	0.000	0.114	fbmy8028_rel_native_lto.cay9c1g
l.x
- l.x: create secondary indexes
- Legend for results is here.
- Each entry lists the percentage of responses that fit in that bucket (slower than max time for previous bucket, faster than min time for next bucket).
TODO - determine whether there is data for create index response time
l.i1
- l.i1: continue load after secondary indexes created
- Legend for results is here.
- Each entry lists the percentage of responses that fit in that bucket (slower than max time for previous bucket, faster than min time for next bucket).
Insert response time histogram
256us	1ms	4ms	16ms	64ms	256ms	1s	4s	16s	gt	max	tag
0.000	0.000	98.932	0.933	0.133	0.002	0.000	0.000	0.000	0.000	0.120	fbmy8028_rel_withdbg.cay9c1g
0.000	0.000	99.127	0.739	0.130	0.004	0.000	0.000	0.000	0.000	0.121	fbmy8028_rel.cay9c1g
0.000	0.000	99.035	0.839	0.120	0.006	0.000	0.000	0.000	0.000	0.130	fbmy8028_rel_o2.cay9c1g
0.000	0.000	99.041	0.836	0.118	0.005	0.000	0.000	0.000	0.000	0.131	fbmy8028_rel_native.cay9c1g
0.000	0.000	99.074	0.795	0.125	0.006	0.000	0.000	0.000	0.000	0.152	fbmy8028_rel_o2_lto.cay9c1g
0.000	0.000	99.130	0.748	0.116	0.006	0.000	0.000	0.000	0.000	0.117	fbmy8028_rel_lto.cay9c1g
0.000	0.000	99.120	0.757	0.117	0.006	0.000	0.000	0.000	0.000	0.133	fbmy8028_rel_native_lto.cay9c1g
q100.1
- q100.1: range queries with 100 insert/s per client
- Legend for results is here.
- Each entry lists the percentage of responses that fit in that bucket (slower than max time for previous bucket, faster than min time for next bucket).
Query response time histogram
256us	1ms	4ms	16ms	64ms	256ms	1s	4s	16s	gt	max	tag
1.917	98.066	0.017	0.001	0.000	0.000	0.000	0.000	0.000	0.000	0.010	fbmy8028_rel_withdbg.cay9c1g
3.169	96.816	0.014	0.001	0.000	0.000	0.000	0.000	0.000	0.000	0.009	fbmy8028_rel.cay9c1g
3.026	96.959	0.013	0.001	0.000	0.000	0.000	0.000	0.000	0.000	0.013	fbmy8028_rel_o2.cay9c1g
2.697	97.286	0.016	0.001	0.000	0.000	0.000	0.000	0.000	0.000	0.009	fbmy8028_rel_native.cay9c1g
6.654	93.332	0.013	0.001	0.000	nonzero	0.000	0.000	0.000	0.000	0.157	fbmy8028_rel_o2_lto.cay9c1g
4.915	95.071	0.014	0.001	nonzero	0.000	0.000	0.000	0.000	0.000	0.017	fbmy8028_rel_lto.cay9c1g
6.958	93.028	0.013	0.001	nonzero	0.000	0.000	0.000	0.000	0.000	0.019	fbmy8028_rel_native_lto.cay9c1g
Insert response time histogram
256us	1ms	4ms	16ms	64ms	256ms	1s	4s	16s	gt	max	tag
0.000	0.000	99.208	0.729	0.062	0.000	0.000	0.000	0.000	0.000	0.019	fbmy8028_rel_withdbg.cay9c1g
0.000	0.000	99.333	0.639	0.028	0.000	0.000	0.000	0.000	0.000	0.017	fbmy8028_rel.cay9c1g
0.000	0.000	99.535	0.424	0.042	0.000	0.000	0.000	0.000	0.000	0.017	fbmy8028_rel_o2.cay9c1g
0.000	0.000	99.458	0.500	0.042	0.000	0.000	0.000	0.000	0.000	0.017	fbmy8028_rel_native.cay9c1g
0.000	0.000	99.493	0.465	0.042	0.000	0.000	0.000	0.000	0.000	0.017	fbmy8028_rel_o2_lto.cay9c1g
0.000	0.000	99.750	0.215	0.035	0.000	0.000	0.000	0.000	0.000	0.023	fbmy8028_rel_lto.cay9c1g
0.000	0.000	99.097	0.854	0.049	0.000	0.000	0.000	0.000	0.000	0.021	fbmy8028_rel_native_lto.cay9c1g
q500.1
- q500.1: range queries with 500 insert/s per client
- Legend for results is here.
- Each entry lists the percentage of responses that fit in that bucket (slower than max time for previous bucket, faster than min time for next bucket).
Query response time histogram
256us	1ms	4ms	16ms	64ms	256ms	1s	4s	16s	gt	max	tag
0.588	99.324	0.083	0.005	nonzero	0.000	0.000	0.000	0.000	0.000	0.018	fbmy8028_rel_withdbg.cay9c1g
1.057	98.862	0.077	0.004	nonzero	0.000	0.000	0.000	0.000	0.000	0.019	fbmy8028_rel.cay9c1g
0.704	99.224	0.068	0.003	nonzero	0.000	0.000	0.000	0.000	0.000	0.017	fbmy8028_rel_o2.cay9c1g
0.583	99.335	0.078	0.004	nonzero	0.000	0.000	0.000	0.000	0.000	0.016	fbmy8028_rel_native.cay9c1g
2.199	97.722	0.075	0.004	nonzero	0.000	0.000	0.000	0.000	0.000	0.018	fbmy8028_rel_o2_lto.cay9c1g
2.889	97.027	0.079	0.005	nonzero	0.000	0.000	0.000	0.000	0.000	0.036	fbmy8028_rel_lto.cay9c1g
3.574	96.350	0.071	0.005	nonzero	0.000	0.000	0.000	0.000	0.000	0.019	fbmy8028_rel_native_lto.cay9c1g
Insert response time histogram
256us	1ms	4ms	16ms	64ms	256ms	1s	4s	16s	gt	max	tag
0.000	0.000	95.029	4.872	0.097	0.001	0.000	0.000	0.000	0.000	0.068	fbmy8028_rel_withdbg.cay9c1g
0.000	0.000	96.150	3.760	0.090	0.000	0.000	0.000	0.000	0.000	0.064	fbmy8028_rel.cay9c1g
0.000	0.000	98.860	1.083	0.057	0.000	0.000	0.000	0.000	0.000	0.062	fbmy8028_rel_o2.cay9c1g
0.000	0.000	95.571	4.333	0.096	0.000	0.000	0.000	0.000	0.000	0.063	fbmy8028_rel_native.cay9c1g
0.000	0.000	94.819	5.081	0.100	0.000	0.000	0.000	0.000	0.000	0.062	fbmy8028_rel_o2_lto.cay9c1g
0.000	0.000	95.251	4.653	0.096	0.000	0.000	0.000	0.000	0.000	0.063	fbmy8028_rel_lto.cay9c1g
0.000	0.000	94.074	5.794	0.132	0.000	0.000	0.000	0.000	0.000	0.062	fbmy8028_rel_native_lto.cay9c1g
q1000.1
- q1000.1: range queries with 1000 insert/s per client
- Legend for results is here.
- Each entry lists the percentage of responses that fit in that bucket (slower than max time for previous bucket, faster than min time for next bucket).
Query response time histogram
256us	1ms	4ms	16ms	64ms	256ms	1s	4s	16s	gt	max	tag
0.386	99.389	0.217	0.008	nonzero	0.000	0.000	0.000	0.000	0.000	0.020	fbmy8028_rel_withdbg.cay9c1g
0.626	99.151	0.215	0.008	nonzero	0.000	0.000	0.000	0.000	0.000	0.019	fbmy8028_rel.cay9c1g
0.451	99.316	0.225	0.009	nonzero	0.000	0.000	0.000	0.000	0.000	0.024	fbmy8028_rel_o2.cay9c1g
0.507	99.266	0.219	0.008	nonzero	0.000	0.000	0.000	0.000	0.000	0.026	fbmy8028_rel_native.cay9c1g
1.008	98.763	0.219	0.009	nonzero	0.000	0.000	0.000	0.000	0.000	0.022	fbmy8028_rel_o2_lto.cay9c1g
1.885	97.913	0.195	0.007	nonzero	0.000	0.000	0.000	0.000	0.000	0.024	fbmy8028_rel_lto.cay9c1g
2.372	97.424	0.197	0.008	nonzero	0.000	0.000	0.000	0.000	0.000	0.037	fbmy8028_rel_native_lto.cay9c1g
Insert response time histogram
256us	1ms	4ms	16ms	64ms	256ms	1s	4s	16s	gt	max	tag
0.000	0.000	91.243	8.634	0.122	0.001	0.000	0.000	0.000	0.000	0.066	fbmy8028_rel_withdbg.cay9c1g
0.000	0.000	87.828	11.999	0.172	0.001	0.000	0.000	0.000	0.000	0.068	fbmy8028_rel.cay9c1g
0.000	0.000	87.003	12.822	0.175	0.000	0.000	0.000	0.000	0.000	0.060	fbmy8028_rel_o2.cay9c1g
0.000	0.000	90.968	8.899	0.132	0.001	0.000	0.000	0.000	0.000	0.068	fbmy8028_rel_native.cay9c1g
0.000	0.000	84.478	15.341	0.180	0.001	0.000	0.000	0.000	0.000	0.071	fbmy8028_rel_o2_lto.cay9c1g
0.000	0.000	90.315	9.529	0.155	0.001	0.000	0.000	0.000	0.000	0.068	fbmy8028_rel_lto.cay9c1g
0.000	0.000	90.328	9.533	0.139	0.000	0.000	0.000	0.000	0.000	0.061	fbmy8028_rel_native_lto.cay9c1g