Introduction
This is a report for the insert benchmark with 20M docs and 4 client(s). It is generated by scripts (bash, awk, sed) and Tufte might not be impressed. An overview of the insert benchmark is here and a short update is here. Below, by DBMS, I mean DBMS+version.config. An example is my8020.c10b40 where my means MySQL, 8020 is version 8.0.20 and c10b40 is the name for the configuration file.
The test server has 8 AMD cores, 16G RAM and an NVMe SSD. It is described here as the Beelink. The benchmark was run with 4 clients and there were 1 or 2 connections per client (1 for queries, 1 for inserts). The benchmark loads 20M rows without secondary indexes, creates secondary indexes, loads another 20M rows then does 3 read+write tests for one hour each that do queries as fast as possible with 100, 500 and then 1000 writes/second/client concurrent with the queries. There is one table per client. The database is cached by the storage engine and the only IO is for writes. Clients and the DBMS share one server. The per-database configs are in the per-database subdirectories here.
The tested DBMS are:
- fbmy5635_rel.cay9c - MyRocks 5.6.35, the cay9c config and compiled with CMAKE_BUILD_TYPE=Release: -O3
- fbmy8028_rel_native_lto.cay9c - MyRocks 8.0.28, the cay9c config and compiled with CMAKE_BUILD_TYPE=Release: -O3 -flto -march=native -mtune=native
Contents
- Summary
- l.i0: load without secondary indexes
- l.x: create secondary indexes
- l.i1: continue load after secondary indexes created
- q100.1: range queries with 100 insert/s per client
- q500.1: range queries with 500 insert/s per client
- q1000.1: range queries with 1000 insert/s per client
Summary
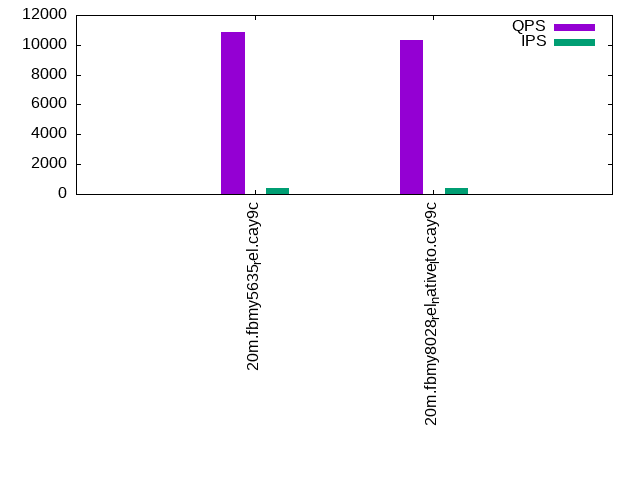
The numbers are inserts/s for l.i0 and l.i1, indexed docs (or rows) /s for l.x and queries/s for q*.2. The values are the average rate over the entire test for inserts (IPS) and queries (QPS). The range of values for IPS and QPS is split into 3 parts: bottom 25%, middle 50%, top 25%. Values in the bottom 25% have a red background, values in the top 25% have a green background and values in the middle have no color. A gray background is used for values that can be ignored because the DBMS did not sustain the target insert rate. Red backgrounds are not used when the minimum value is within 80% of the max value.
| dbms | l.i0 | l.x | l.i1 | q100.1 | q500.1 | q1000.1 |
|---|---|---|---|---|---|---|
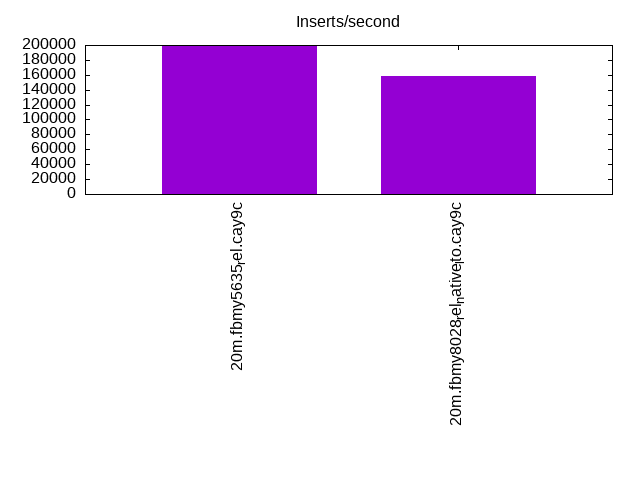
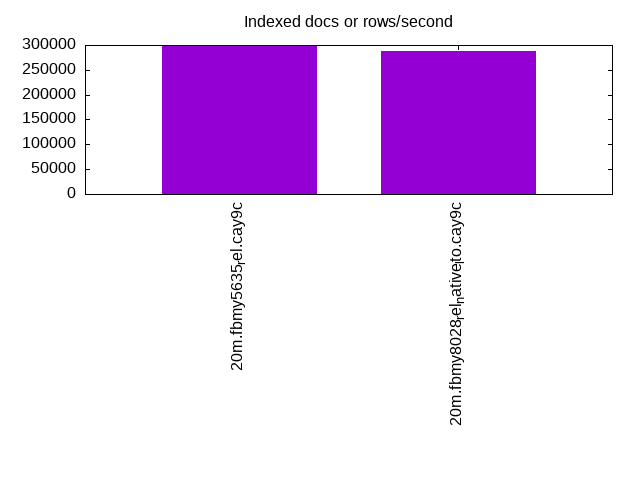
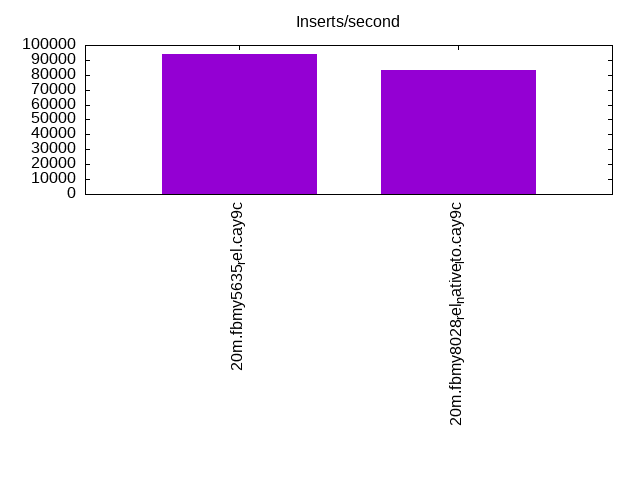
| 20m.fbmy5635_rel.cay9c | 198020 | 300000 | 93897 | 10862 | 10637 | 10712 |
| 20m.fbmy8028_rel_native_lto.cay9c | 158730 | 287143 | 83333 | 10357 | 10405 | 10419 |
This table has relative throughput, throughput for the DBMS relative to the DBMS in the first line, using the absolute throughput from the previous table.
| dbms | l.i0 | l.x | l.i1 | q100.1 | q500.1 | q1000.1 |
|---|---|---|---|---|---|---|
| 20m.fbmy5635_rel.cay9c | 1.00 | 1.00 | 1.00 | 1.00 | 1.00 | 1.00 |
| 20m.fbmy8028_rel_native_lto.cay9c | 0.80 | 0.96 | 0.89 | 0.95 | 0.98 | 0.97 |
This lists the average rate of inserts/s for the tests that do inserts concurrent with queries. For such tests the query rate is listed in the table above. The read+write tests are setup so that the insert rate should match the target rate every second. Cells that are not at least 95% of the target have a red background to indicate a failure to satisfy the target.
| dbms | q100.1 | q500.1 | q1000.1 |
|---|---|---|---|
| fbmy5635_rel.cay9c | 399 | 1994 | 3989 |
| fbmy8028_rel_native_lto.cay9c | 399 | 1994 | 3989 |
| target | 400 | 2000 | 4000 |
l.i0
l.i0: load without secondary indexes. Graphs for performance per 1-second interval are here.
Average throughput:
Insert response time histogram: each cell has the percentage of responses that take <= the time in the header and max is the max response time in seconds. For the max column values in the top 25% of the range have a red background and in the bottom 25% of the range have a green background. The red background is not used when the min value is within 80% of the max value.
| dbms | 256us | 1ms | 4ms | 16ms | 64ms | 256ms | 1s | 4s | 16s | gt | max |
|---|---|---|---|---|---|---|---|---|---|---|---|
| fbmy5635_rel.cay9c | 99.755 | 0.229 | 0.003 | 0.013 | 0.102 | ||||||
| fbmy8028_rel_native_lto.cay9c | 99.290 | 0.504 | 0.193 | 0.013 | 0.137 |
Performance metrics for the DBMS listed above. Some are normalized by throughput, others are not. Legend for results is here.
ips	qps	rps	rmbps	wps	wmbps	rpq	rkbpq	wpi	wkbpi	csps	cpups	cspq	cpupq	dbgb1	dbgb2	rss	maxop	p50	p99	tag
198020	0	0	0.0	121.1	51.6	0.000	0.000	0.001	0.267	19918	72.6	0.101	29	0.9	1.9	0.4	0.102	55359	34462	20m.fbmy5635_rel.cay9c
158730	0	0	0.0	111.8	44.3	0.000	0.000	0.001	0.286	16041	67.2	0.101	34	0.7	1.9	0.7	0.137	42853	8890	20m.fbmy8028_rel_native_lto.cay9c
l.x
l.x: create secondary indexes.
Average throughput:
Performance metrics for the DBMS listed above. Some are normalized by throughput, others are not. Legend for results is here.
ips	qps	rps	rmbps	wps	wmbps	rpq	rkbpq	wpi	wkbpi	csps	cpups	cspq	cpupq	dbgb1	dbgb2	rss	maxop	p50	p99	tag
300000	0	1	0.0	134.0	56.1	0.000	0.000	0.000	0.191	834	48.4	0.003	13	1.4	2.4	2.1	0.003	NA	NA	20m.fbmy5635_rel.cay9c
287143	0	1	0.0	116.8	47.5	0.000	0.000	0.000	0.170	797	46.8	0.003	13	1.4	2.7	2.2	0.010	NA	NA	20m.fbmy8028_rel_native_lto.cay9c
l.i1
l.i1: continue load after secondary indexes created. Graphs for performance per 1-second interval are here.
Average throughput:
Insert response time histogram: each cell has the percentage of responses that take <= the time in the header and max is the max response time in seconds. For the max column values in the top 25% of the range have a red background and in the bottom 25% of the range have a green background. The red background is not used when the min value is within 80% of the max value.
| dbms | 256us | 1ms | 4ms | 16ms | 64ms | 256ms | 1s | 4s | 16s | gt | max |
|---|---|---|---|---|---|---|---|---|---|---|---|
| fbmy5635_rel.cay9c | 99.635 | 0.353 | 0.004 | 0.007 | 0.108 | ||||||
| fbmy8028_rel_native_lto.cay9c | 99.208 | 0.684 | 0.100 | 0.007 | 0.117 |
Performance metrics for the DBMS listed above. Some are normalized by throughput, others are not. Legend for results is here.
ips	qps	rps	rmbps	wps	wmbps	rpq	rkbpq	wpi	wkbpi	csps	cpups	cspq	cpupq	dbgb1	dbgb2	rss	maxop	p50	p99	tag
93897	0	10	1.2	169.6	69.4	0.000	0.013	0.002	0.756	20530	74.4	0.219	63	4.7	6.5	2.3	0.108	24039	16688	20m.fbmy5635_rel.cay9c
83333	0	18	2.2	165.0	65.8	0.000	0.027	0.002	0.809	17825	74.4	0.214	71	3.6	5.5	2.7	0.117	21184	15683	20m.fbmy8028_rel_native_lto.cay9c
q100.1
q100.1: range queries with 100 insert/s per client. Graphs for performance per 1-second interval are here.
Average throughput:
Query response time histogram: each cell has the percentage of responses that take <= the time in the header and max is the max response time in seconds. For max values in the top 25% of the range have a red background and in the bottom 25% of the range have a green background. The red background is not used when the min value is within 80% of the max value.
| dbms | 256us | 1ms | 4ms | 16ms | 64ms | 256ms | 1s | 4s | 16s | gt | max |
|---|---|---|---|---|---|---|---|---|---|---|---|
| fbmy5635_rel.cay9c | 12.373 | 87.619 | 0.008 | 0.001 | 0.009 | ||||||
| fbmy8028_rel_native_lto.cay9c | 8.859 | 91.130 | 0.010 | 0.001 | 0.013 |
Insert response time histogram: each cell has the percentage of responses that take <= the time in the header and max is the max response time in seconds. For max values in the top 25% of the range have a red background and in the bottom 25% of the range have a green background. The red background is not used when the min value is within 80% of the max value.
| dbms | 256us | 1ms | 4ms | 16ms | 64ms | 256ms | 1s | 4s | 16s | gt | max |
|---|---|---|---|---|---|---|---|---|---|---|---|
| fbmy5635_rel.cay9c | 99.771 | 0.229 | 0.014 | ||||||||
| fbmy8028_rel_native_lto.cay9c | 99.729 | 0.236 | 0.035 | 0.017 |
Performance metrics for the DBMS listed above. Some are normalized by throughput, others are not. Legend for results is here.
ips	qps	rps	rmbps	wps	wmbps	rpq	rkbpq	wpi	wkbpi	csps	cpups	cspq	cpupq	dbgb1	dbgb2	rss	maxop	p50	p99	tag
399	10862	23	0.3	7.7	2.1	0.002	0.025	0.019	5.313	40805	50.6	3.757	373	2.9	4.7	6.7	0.009	2701	2397	20m.fbmy5635_rel.cay9c
399	10357	9	0.1	6.6	1.5	0.001	0.012	0.016	3.886	39224	51.1	3.787	395	2.8	4.9	6.4	0.013	2589	2046	20m.fbmy8028_rel_native_lto.cay9c
q500.1
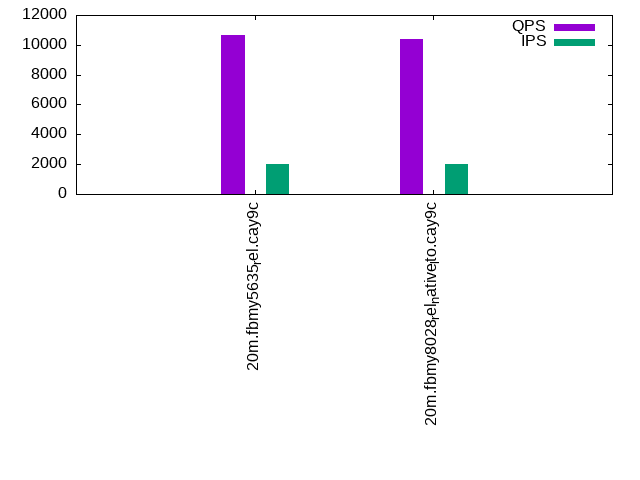
q500.1: range queries with 500 insert/s per client. Graphs for performance per 1-second interval are here.
Average throughput:
Query response time histogram: each cell has the percentage of responses that take <= the time in the header and max is the max response time in seconds. For max values in the top 25% of the range have a red background and in the bottom 25% of the range have a green background. The red background is not used when the min value is within 80% of the max value.
| dbms | 256us | 1ms | 4ms | 16ms | 64ms | 256ms | 1s | 4s | 16s | gt | max |
|---|---|---|---|---|---|---|---|---|---|---|---|
| fbmy5635_rel.cay9c | 10.160 | 89.802 | 0.036 | 0.002 | nonzero | 0.019 | |||||
| fbmy8028_rel_native_lto.cay9c | 8.196 | 91.752 | 0.048 | 0.003 | nonzero | 0.018 |
Insert response time histogram: each cell has the percentage of responses that take <= the time in the header and max is the max response time in seconds. For max values in the top 25% of the range have a red background and in the bottom 25% of the range have a green background. The red background is not used when the min value is within 80% of the max value.
| dbms | 256us | 1ms | 4ms | 16ms | 64ms | 256ms | 1s | 4s | 16s | gt | max |
|---|---|---|---|---|---|---|---|---|---|---|---|
| fbmy5635_rel.cay9c | 97.094 | 2.881 | 0.025 | 0.047 | |||||||
| fbmy8028_rel_native_lto.cay9c | 95.885 | 3.993 | 0.121 | 0.001 | 0.065 |
Performance metrics for the DBMS listed above. Some are normalized by throughput, others are not. Legend for results is here.
ips	qps	rps	rmbps	wps	wmbps	rpq	rkbpq	wpi	wkbpi	csps	cpups	cspq	cpupq	dbgb1	dbgb2	rss	maxop	p50	p99	tag
1994	10637	0	0.0	7.8	2.2	0.000	0.002	0.004	1.104	39838	51.2	3.745	385	3.1	3.4	8.9	0.019	2622	2349	20m.fbmy5635_rel.cay9c
1994	10405	0	0.0	8.1	2.2	0.000	0.000	0.004	1.141	39172	51.9	3.765	399	3.1	3.6	8.7	0.018	2589	2127	20m.fbmy8028_rel_native_lto.cay9c
q1000.1
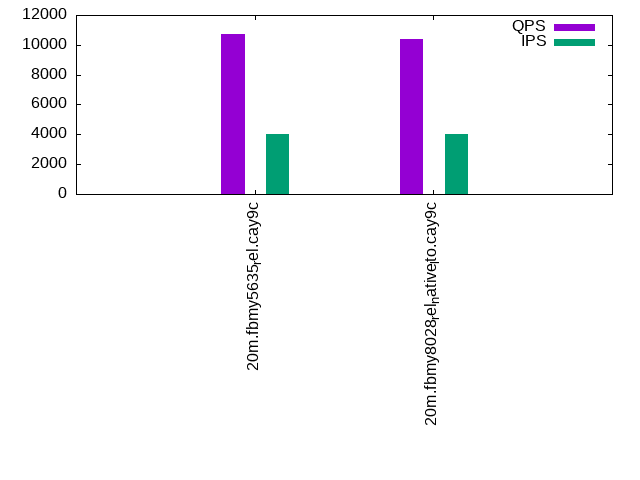
q1000.1: range queries with 1000 insert/s per client. Graphs for performance per 1-second interval are here.
Average throughput:
Query response time histogram: each cell has the percentage of responses that take <= the time in the header and max is the max response time in seconds. For max values in the top 25% of the range have a red background and in the bottom 25% of the range have a green background. The red background is not used when the min value is within 80% of the max value.
| dbms | 256us | 1ms | 4ms | 16ms | 64ms | 256ms | 1s | 4s | 16s | gt | max |
|---|---|---|---|---|---|---|---|---|---|---|---|
| fbmy5635_rel.cay9c | 9.188 | 90.704 | 0.099 | 0.009 | nonzero | 0.025 | |||||
| fbmy8028_rel_native_lto.cay9c | 6.996 | 92.868 | 0.125 | 0.010 | nonzero | 0.022 |
Insert response time histogram: each cell has the percentage of responses that take <= the time in the header and max is the max response time in seconds. For max values in the top 25% of the range have a red background and in the bottom 25% of the range have a green background. The red background is not used when the min value is within 80% of the max value.
| dbms | 256us | 1ms | 4ms | 16ms | 64ms | 256ms | 1s | 4s | 16s | gt | max |
|---|---|---|---|---|---|---|---|---|---|---|---|
| fbmy5635_rel.cay9c | 88.571 | 11.376 | 0.053 | 0.048 | |||||||
| fbmy8028_rel_native_lto.cay9c | 93.031 | 6.841 | 0.127 | 0.001 | 0.076 |
Performance metrics for the DBMS listed above. Some are normalized by throughput, others are not. Legend for results is here.
ips	qps	rps	rmbps	wps	wmbps	rpq	rkbpq	wpi	wkbpi	csps	cpups	cspq	cpupq	dbgb1	dbgb2	rss	maxop	p50	p99	tag
3989	10712	14	0.8	16.0	5.1	0.001	0.075	0.004	1.300	39242	53.2	3.664	397	3.8	5.0	10.5	0.025	2637	2301	20m.fbmy5635_rel.cay9c
3989	10419	17	0.7	14.4	4.3	0.002	0.069	0.004	1.112	38725	53.6	3.717	412	4.0	5.4	10.7	0.022	2590	2141	20m.fbmy8028_rel_native_lto.cay9c
l.i0
l.i0: load without secondary indexes
Performance metrics for all DBMS, not just the ones listed above. Some are normalized by throughput, others are not. Legend for results is here.
ips	qps	rps	rmbps	wps	wmbps	rpq	rkbpq	wpi	wkbpi	csps	cpups	cspq	cpupq	dbgb1	dbgb2	rss	maxop	p50	p99	tag
198020	0	0	0.0	121.1	51.6	0.000	0.000	0.001	0.267	19918	72.6	0.101	29	0.9	1.9	0.4	0.102	55359	34462	20m.fbmy5635_rel.cay9c
158730	0	0	0.0	111.8	44.3	0.000	0.000	0.001	0.286	16041	67.2	0.101	34	0.7	1.9	0.7	0.137	42853	8890	20m.fbmy8028_rel_native_lto.cay9c
l.x
l.x: create secondary indexes
Performance metrics for all DBMS, not just the ones listed above. Some are normalized by throughput, others are not. Legend for results is here.
ips	qps	rps	rmbps	wps	wmbps	rpq	rkbpq	wpi	wkbpi	csps	cpups	cspq	cpupq	dbgb1	dbgb2	rss	maxop	p50	p99	tag
300000	0	1	0.0	134.0	56.1	0.000	0.000	0.000	0.191	834	48.4	0.003	13	1.4	2.4	2.1	0.003	NA	NA	20m.fbmy5635_rel.cay9c
287143	0	1	0.0	116.8	47.5	0.000	0.000	0.000	0.170	797	46.8	0.003	13	1.4	2.7	2.2	0.010	NA	NA	20m.fbmy8028_rel_native_lto.cay9c
l.i1
l.i1: continue load after secondary indexes created
Performance metrics for all DBMS, not just the ones listed above. Some are normalized by throughput, others are not. Legend for results is here.
ips	qps	rps	rmbps	wps	wmbps	rpq	rkbpq	wpi	wkbpi	csps	cpups	cspq	cpupq	dbgb1	dbgb2	rss	maxop	p50	p99	tag
93897	0	10	1.2	169.6	69.4	0.000	0.013	0.002	0.756	20530	74.4	0.219	63	4.7	6.5	2.3	0.108	24039	16688	20m.fbmy5635_rel.cay9c
83333	0	18	2.2	165.0	65.8	0.000	0.027	0.002	0.809	17825	74.4	0.214	71	3.6	5.5	2.7	0.117	21184	15683	20m.fbmy8028_rel_native_lto.cay9c
q100.1
q100.1: range queries with 100 insert/s per client
Performance metrics for all DBMS, not just the ones listed above. Some are normalized by throughput, others are not. Legend for results is here.
ips	qps	rps	rmbps	wps	wmbps	rpq	rkbpq	wpi	wkbpi	csps	cpups	cspq	cpupq	dbgb1	dbgb2	rss	maxop	p50	p99	tag
399	10862	23	0.3	7.7	2.1	0.002	0.025	0.019	5.313	40805	50.6	3.757	373	2.9	4.7	6.7	0.009	2701	2397	20m.fbmy5635_rel.cay9c
399	10357	9	0.1	6.6	1.5	0.001	0.012	0.016	3.886	39224	51.1	3.787	395	2.8	4.9	6.4	0.013	2589	2046	20m.fbmy8028_rel_native_lto.cay9c
q500.1
q500.1: range queries with 500 insert/s per client
Performance metrics for all DBMS, not just the ones listed above. Some are normalized by throughput, others are not. Legend for results is here.
ips	qps	rps	rmbps	wps	wmbps	rpq	rkbpq	wpi	wkbpi	csps	cpups	cspq	cpupq	dbgb1	dbgb2	rss	maxop	p50	p99	tag
1994	10637	0	0.0	7.8	2.2	0.000	0.002	0.004	1.104	39838	51.2	3.745	385	3.1	3.4	8.9	0.019	2622	2349	20m.fbmy5635_rel.cay9c
1994	10405	0	0.0	8.1	2.2	0.000	0.000	0.004	1.141	39172	51.9	3.765	399	3.1	3.6	8.7	0.018	2589	2127	20m.fbmy8028_rel_native_lto.cay9c
q1000.1
q1000.1: range queries with 1000 insert/s per client
Performance metrics for all DBMS, not just the ones listed above. Some are normalized by throughput, others are not. Legend for results is here.
ips	qps	rps	rmbps	wps	wmbps	rpq	rkbpq	wpi	wkbpi	csps	cpups	cspq	cpupq	dbgb1	dbgb2	rss	maxop	p50	p99	tag
3989	10712	14	0.8	16.0	5.1	0.001	0.075	0.004	1.300	39242	53.2	3.664	397	3.8	5.0	10.5	0.025	2637	2301	20m.fbmy5635_rel.cay9c
3989	10419	17	0.7	14.4	4.3	0.002	0.069	0.004	1.112	38725	53.6	3.717	412	4.0	5.4	10.7	0.022	2590	2141	20m.fbmy8028_rel_native_lto.cay9c
l.i0
- l.i0: load without secondary indexes
- Legend for results is here.
- Each entry lists the percentage of responses that fit in that bucket (slower than max time for previous bucket, faster than min time for next bucket).
Insert response time histogram
256us	1ms	4ms	16ms	64ms	256ms	1s	4s	16s	gt	max	tag
0.000	0.000	99.755	0.229	0.003	0.013	0.000	0.000	0.000	0.000	0.102	fbmy5635_rel.cay9c
0.000	0.000	99.290	0.504	0.193	0.013	0.000	0.000	0.000	0.000	0.137	fbmy8028_rel_native_lto.cay9c
l.x
- l.x: create secondary indexes
- Legend for results is here.
- Each entry lists the percentage of responses that fit in that bucket (slower than max time for previous bucket, faster than min time for next bucket).
TODO - determine whether there is data for create index response time
l.i1
- l.i1: continue load after secondary indexes created
- Legend for results is here.
- Each entry lists the percentage of responses that fit in that bucket (slower than max time for previous bucket, faster than min time for next bucket).
Insert response time histogram
256us	1ms	4ms	16ms	64ms	256ms	1s	4s	16s	gt	max	tag
0.000	0.000	99.635	0.353	0.004	0.007	0.000	0.000	0.000	0.000	0.108	fbmy5635_rel.cay9c
0.000	0.000	99.208	0.684	0.100	0.007	0.000	0.000	0.000	0.000	0.117	fbmy8028_rel_native_lto.cay9c
q100.1
- q100.1: range queries with 100 insert/s per client
- Legend for results is here.
- Each entry lists the percentage of responses that fit in that bucket (slower than max time for previous bucket, faster than min time for next bucket).
Query response time histogram
256us	1ms	4ms	16ms	64ms	256ms	1s	4s	16s	gt	max	tag
12.373	87.619	0.008	0.001	0.000	0.000	0.000	0.000	0.000	0.000	0.009	fbmy5635_rel.cay9c
8.859	91.130	0.010	0.001	0.000	0.000	0.000	0.000	0.000	0.000	0.013	fbmy8028_rel_native_lto.cay9c
Insert response time histogram
256us	1ms	4ms	16ms	64ms	256ms	1s	4s	16s	gt	max	tag
0.000	0.000	99.771	0.229	0.000	0.000	0.000	0.000	0.000	0.000	0.014	fbmy5635_rel.cay9c
0.000	0.000	99.729	0.236	0.035	0.000	0.000	0.000	0.000	0.000	0.017	fbmy8028_rel_native_lto.cay9c
q500.1
- q500.1: range queries with 500 insert/s per client
- Legend for results is here.
- Each entry lists the percentage of responses that fit in that bucket (slower than max time for previous bucket, faster than min time for next bucket).
Query response time histogram
256us	1ms	4ms	16ms	64ms	256ms	1s	4s	16s	gt	max	tag
10.160	89.802	0.036	0.002	nonzero	0.000	0.000	0.000	0.000	0.000	0.019	fbmy5635_rel.cay9c
8.196	91.752	0.048	0.003	nonzero	0.000	0.000	0.000	0.000	0.000	0.018	fbmy8028_rel_native_lto.cay9c
Insert response time histogram
256us	1ms	4ms	16ms	64ms	256ms	1s	4s	16s	gt	max	tag
0.000	0.000	97.094	2.881	0.025	0.000	0.000	0.000	0.000	0.000	0.047	fbmy5635_rel.cay9c
0.000	0.000	95.885	3.993	0.121	0.001	0.000	0.000	0.000	0.000	0.065	fbmy8028_rel_native_lto.cay9c
q1000.1
- q1000.1: range queries with 1000 insert/s per client
- Legend for results is here.
- Each entry lists the percentage of responses that fit in that bucket (slower than max time for previous bucket, faster than min time for next bucket).
Query response time histogram
256us	1ms	4ms	16ms	64ms	256ms	1s	4s	16s	gt	max	tag
9.188	90.704	0.099	0.009	nonzero	0.000	0.000	0.000	0.000	0.000	0.025	fbmy5635_rel.cay9c
6.996	92.868	0.125	0.010	nonzero	0.000	0.000	0.000	0.000	0.000	0.022	fbmy8028_rel_native_lto.cay9c
Insert response time histogram
256us	1ms	4ms	16ms	64ms	256ms	1s	4s	16s	gt	max	tag
0.000	0.000	88.571	11.376	0.053	0.000	0.000	0.000	0.000	0.000	0.048	fbmy5635_rel.cay9c
0.000	0.000	93.031	6.841	0.127	0.001	0.000	0.000	0.000	0.000	0.076	fbmy8028_rel_native_lto.cay9c