Introduction
This is a report for the insert benchmark with 20M docs and 4 client(s). It is generated by scripts (bash, awk, sed) and Tufte might not be impressed. An overview of the insert benchmark is here and a short update is here. Below, by DBMS, I mean DBMS+version.config. An example is my8020.c10b40 where my means MySQL, 8020 is version 8.0.20 and c10b40 is the name for the configuration file.
The test server has 8 AMD cores, 16G RAM and an NVMe SSD. It is described here as the Beelink. The benchmark was run with 4 clients and there were 1 or 2 connections per client (1 for queries, 1 for inserts). The benchmark loads 20M rows without secondary indexes, creates secondary indexes, loads another 20M rows then does 3 read+write tests for one hour each that do queries as fast as possible with 100, 500 and then 1000 writes/second/client concurrent with the queries. There is one table per client. The database is cached by the OS page cache but not by the storage engine. Clients and the DBMS share one server. The per-database configs are in the per-database subdirectories here.
The tested DBMS are:
- fbmy8028_rel_withdbg.cay9c1g - MyRocks 8.0.28, the cay9c1g config and compiled with CMAKE_BUILD_TYPE=RelWithDebInfo and -O2
- fbmy8028_rel.cay9c1g - MyRocks 8.0.28, the cay9c1g config and compiled with CMAKE_BUILD_TYPE=Release and -O3
- fbmy8028_rel_o2.cay9c1g - MyRocks 8.0.28, the cay9c1g config and compiled with CMAKE_BUILD_TYPE=Release and -O2
- fbmy8028_rel_native.cay9c1g - MyRocks 8.0.28, the cay9c1g config and compiled with CMAKE_BUILD_TYPE=Release and -O3 -march=native -mtune=native
- fbmy8028_rel_o2_lto.cay9c1g - MyRocks 8.0.28, the cay9c1g config and compiled with CMAKE_BUILD_TYPE=Release and -O2 -flto
- fbmy8028_rel_lto.cay9c1g - MyRocks 8.0.28, the cay9c1g config and compiled with CMAKE_BUILD_TYPE=Release and -O3 -flto
- fbmy8028_rel_native_lto.cay9c1g - MyRocks 8.0.28, the cay9c1g config and compiled with CMAKE_BUILD_TYPE=Release and -O3 -flto -march=native -mtune=native
Contents
- Summary
- l.i0: load without secondary indexes
- l.x: create secondary indexes
- l.i1: continue load after secondary indexes created
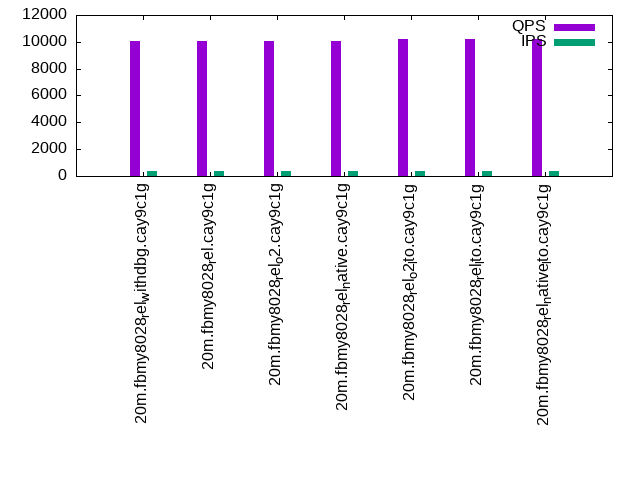
- q100.1: range queries with 100 insert/s per client
- q500.1: range queries with 500 insert/s per client
- q1000.1: range queries with 1000 insert/s per client
Summary
The numbers are inserts/s for l.i0 and l.i1, indexed docs (or rows) /s for l.x and queries/s for q*.2. The values are the average rate over the entire test for inserts (IPS) and queries (QPS). The range of values for IPS and QPS is split into 3 parts: bottom 25%, middle 50%, top 25%. Values in the bottom 25% have a red background, values in the top 25% have a green background and values in the middle have no color. A gray background is used for values that can be ignored because the DBMS did not sustain the target insert rate. Red backgrounds are not used when the minimum value is within 80% of the max value.
| dbms | l.i0 | l.x | l.i1 | q100.1 | q500.1 | q1000.1 |
|---|---|---|---|---|---|---|
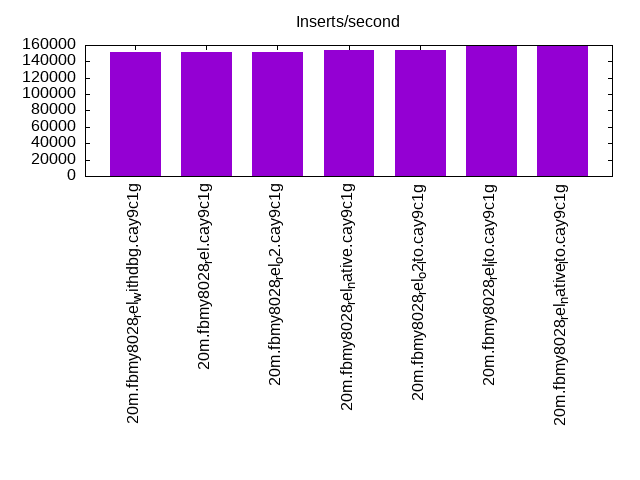
| 20m.fbmy8028_rel_withdbg.cay9c1g | 151515 | 239286 | 74627 | 10078 | 9756 | 9679 |
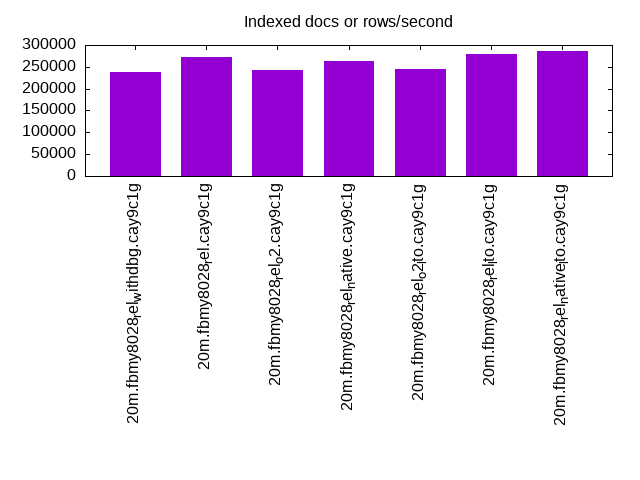
| 20m.fbmy8028_rel.cay9c1g | 151515 | 271622 | 79051 | 10076 | 9878 | 9640 |
| 20m.fbmy8028_rel_o2.cay9c1g | 151515 | 242169 | 79051 | 10036 | 9832 | 9702 |
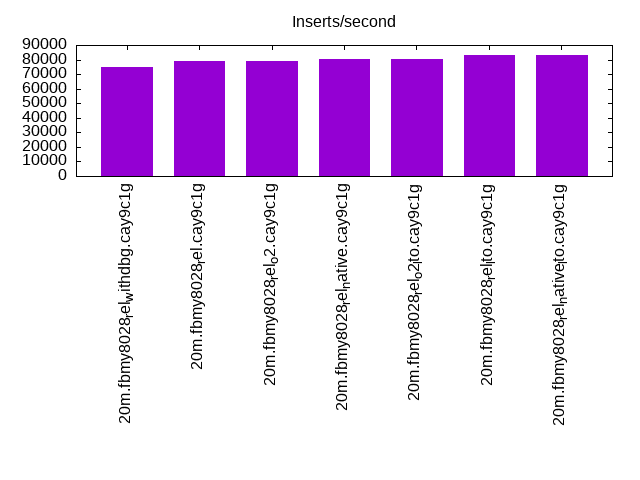
| 20m.fbmy8028_rel_native.cay9c1g | 153846 | 264474 | 80321 | 10029 | 9641 | 9617 |
| 20m.fbmy8028_rel_o2_lto.cay9c1g | 153846 | 245122 | 80321 | 10215 | 9966 | 9882 |
| 20m.fbmy8028_rel_lto.cay9c1g | 158730 | 279167 | 82988 | 10175 | 9843 | 9827 |
| 20m.fbmy8028_rel_native_lto.cay9c1g | 160000 | 287143 | 83333 | 10244 | 10067 | 9909 |
This table has relative throughput, throughput for the DBMS relative to the DBMS in the first line, using the absolute throughput from the previous table.
| dbms | l.i0 | l.x | l.i1 | q100.1 | q500.1 | q1000.1 |
|---|---|---|---|---|---|---|
| 20m.fbmy8028_rel_withdbg.cay9c1g | 1.00 | 1.00 | 1.00 | 1.00 | 1.00 | 1.00 |
| 20m.fbmy8028_rel.cay9c1g | 1.00 | 1.14 | 1.06 | 1.00 | 1.01 | 1.00 |
| 20m.fbmy8028_rel_o2.cay9c1g | 1.00 | 1.01 | 1.06 | 1.00 | 1.01 | 1.00 |
| 20m.fbmy8028_rel_native.cay9c1g | 1.02 | 1.11 | 1.08 | 1.00 | 0.99 | 0.99 |
| 20m.fbmy8028_rel_o2_lto.cay9c1g | 1.02 | 1.02 | 1.08 | 1.01 | 1.02 | 1.02 |
| 20m.fbmy8028_rel_lto.cay9c1g | 1.05 | 1.17 | 1.11 | 1.01 | 1.01 | 1.02 |
| 20m.fbmy8028_rel_native_lto.cay9c1g | 1.06 | 1.20 | 1.12 | 1.02 | 1.03 | 1.02 |
This lists the average rate of inserts/s for the tests that do inserts concurrent with queries. For such tests the query rate is listed in the table above. The read+write tests are setup so that the insert rate should match the target rate every second. Cells that are not at least 95% of the target have a red background to indicate a failure to satisfy the target.
| dbms | q100.1 | q500.1 | q1000.1 |
|---|---|---|---|
| fbmy8028_rel_withdbg.cay9c1g | 399 | 1994 | 3987 |
| fbmy8028_rel.cay9c1g | 399 | 1994 | 3989 |
| fbmy8028_rel_o2.cay9c1g | 399 | 1994 | 3989 |
| fbmy8028_rel_native.cay9c1g | 399 | 1994 | 3989 |
| fbmy8028_rel_o2_lto.cay9c1g | 399 | 1994 | 3989 |
| fbmy8028_rel_lto.cay9c1g | 399 | 1994 | 3989 |
| fbmy8028_rel_native_lto.cay9c1g | 399 | 1994 | 3989 |
| target | 400 | 2000 | 4000 |
l.i0
l.i0: load without secondary indexes. Graphs for performance per 1-second interval are here.
Average throughput:
Insert response time histogram: each cell has the percentage of responses that take <= the time in the header and max is the max response time in seconds. For the max column values in the top 25% of the range have a red background and in the bottom 25% of the range have a green background. The red background is not used when the min value is within 80% of the max value.
| dbms | 256us | 1ms | 4ms | 16ms | 64ms | 256ms | 1s | 4s | 16s | gt | max |
|---|---|---|---|---|---|---|---|---|---|---|---|
| fbmy8028_rel_withdbg.cay9c1g | 99.253 | 0.536 | 0.198 | 0.013 | 0.121 | ||||||
| fbmy8028_rel.cay9c1g | 99.237 | 0.556 | 0.194 | 0.013 | 0.132 | ||||||
| fbmy8028_rel_o2.cay9c1g | 99.248 | 0.559 | 0.178 | 0.013 | 0.117 | ||||||
| fbmy8028_rel_native.cay9c1g | 99.272 | 0.517 | 0.198 | 0.013 | 0.126 | ||||||
| fbmy8028_rel_o2_lto.cay9c1g | 99.255 | 0.528 | 0.203 | 0.013 | 0.121 | ||||||
| fbmy8028_rel_lto.cay9c1g | 99.279 | 0.515 | 0.193 | 0.013 | 0.123 | ||||||
| fbmy8028_rel_native_lto.cay9c1g | 99.302 | 0.483 | 0.202 | 0.013 | 0.139 |
Performance metrics for the DBMS listed above. Some are normalized by throughput, others are not. Legend for results is here.
ips	qps	rps	rmbps	wps	wmbps	rpq	rkbpq	wpi	wkbpi	csps	cpups	cspq	cpupq	dbgb1	dbgb2	rss	maxop	p50	p99	tag
151515	0	0	0.0	112.5	42.6	0.000	0.000	0.001	0.288	15525	66.9	0.102	35	0.7	1.9	0.8	0.121	40556	26970	20m.fbmy8028_rel_withdbg.cay9c1g
151515	0	0	0.0	111.5	42.6	0.000	0.000	0.001	0.288	15619	66.4	0.103	35	0.7	1.9	0.8	0.132	41355	8890	20m.fbmy8028_rel.cay9c1g
151515	0	0	0.0	111.8	42.6	0.000	0.000	0.001	0.288	15606	67.1	0.103	35	0.7	1.9	0.7	0.117	40656	24483	20m.fbmy8028_rel_o2.cay9c1g
153846	0	0	0.0	112.1	42.6	0.000	0.000	0.001	0.284	15601	66.4	0.101	35	0.7	1.9	0.8	0.126	41355	11594	20m.fbmy8028_rel_native.cay9c1g
153846	0	0	0.0	112.6	42.6	0.000	0.000	0.001	0.284	15586	66.8	0.101	35	0.7	1.9	0.8	0.121	41654	5294	20m.fbmy8028_rel_o2_lto.cay9c1g
158730	0	0	0.0	116.3	44.3	0.000	0.000	0.001	0.286	16141	66.5	0.102	34	0.7	1.9	0.7	0.123	43352	34674	20m.fbmy8028_rel_lto.cay9c1g
160000	0	0	0.0	111.2	44.3	0.000	0.000	0.001	0.284	16148	66.6	0.101	33	0.7	1.9	0.8	0.139	43253	29267	20m.fbmy8028_rel_native_lto.cay9c1g
l.x
l.x: create secondary indexes.
Average throughput:
Performance metrics for the DBMS listed above. Some are normalized by throughput, others are not. Legend for results is here.
ips	qps	rps	rmbps	wps	wmbps	rpq	rkbpq	wpi	wkbpi	csps	cpups	cspq	cpupq	dbgb1	dbgb2	rss	maxop	p50	p99	tag
239286	0	1	0.0	94.4	39.4	0.000	0.000	0.000	0.169	680	48.1	0.003	16	1.4	2.7	2.2	0.014	NA	NA	20m.fbmy8028_rel_withdbg.cay9c1g
271622	0	0	0.0	102.1	43.4	0.000	0.000	0.000	0.164	579	47.8	0.002	14	1.4	2.7	2.2	0.014	NA	NA	20m.fbmy8028_rel.cay9c1g
242169	0	0	0.0	94.0	39.4	0.000	0.000	0.000	0.167	660	48.4	0.003	16	1.4	2.7	2.1	0.017	NA	NA	20m.fbmy8028_rel_o2.cay9c1g
264474	0	1	0.0	108.4	44.4	0.000	0.000	0.000	0.172	638	47.1	0.002	14	1.4	2.7	2.2	0.017	NA	NA	20m.fbmy8028_rel_native.cay9c1g
245122	0	0	0.0	95.4	40.5	0.000	0.000	0.000	0.169	658	48.1	0.003	16	1.4	2.7	2.2	0.009	NA	NA	20m.fbmy8028_rel_o2_lto.cay9c1g
279167	0	1	0.0	115.3	47.1	0.000	0.000	0.000	0.173	709	47.2	0.003	14	1.4	2.7	2.2	0.009	NA	NA	20m.fbmy8028_rel_lto.cay9c1g
287143	0	1	0.0	113.8	47.4	0.000	0.000	0.000	0.169	813	47.3	0.003	13	1.4	2.7	2.2	0.008	NA	NA	20m.fbmy8028_rel_native_lto.cay9c1g
l.i1
l.i1: continue load after secondary indexes created. Graphs for performance per 1-second interval are here.
Average throughput:
Insert response time histogram: each cell has the percentage of responses that take <= the time in the header and max is the max response time in seconds. For the max column values in the top 25% of the range have a red background and in the bottom 25% of the range have a green background. The red background is not used when the min value is within 80% of the max value.
| dbms | 256us | 1ms | 4ms | 16ms | 64ms | 256ms | 1s | 4s | 16s | gt | max |
|---|---|---|---|---|---|---|---|---|---|---|---|
| fbmy8028_rel_withdbg.cay9c1g | 99.022 | 0.849 | 0.103 | 0.006 | 0.020 | 0.763 | |||||
| fbmy8028_rel.cay9c1g | 99.165 | 0.716 | 0.113 | 0.006 | 0.128 | ||||||
| fbmy8028_rel_o2.cay9c1g | 99.091 | 0.785 | 0.119 | 0.005 | 0.119 | ||||||
| fbmy8028_rel_native.cay9c1g | 99.229 | 0.652 | 0.112 | 0.007 | 0.153 | ||||||
| fbmy8028_rel_o2_lto.cay9c1g | 99.080 | 0.795 | 0.119 | 0.006 | 0.122 | ||||||
| fbmy8028_rel_lto.cay9c1g | 99.251 | 0.642 | 0.100 | 0.007 | 0.122 | ||||||
| fbmy8028_rel_native_lto.cay9c1g | 99.250 | 0.637 | 0.106 | 0.007 | 0.108 |
Performance metrics for the DBMS listed above. Some are normalized by throughput, others are not. Legend for results is here.
ips	qps	rps	rmbps	wps	wmbps	rpq	rkbpq	wpi	wkbpi	csps	cpups	cspq	cpupq	dbgb1	dbgb2	rss	maxop	p50	p99	tag
74627	0	15	1.8	154.9	59.8	0.000	0.025	0.002	0.821	16160	73.7	0.217	79	3.8	5.7	1.7	0.763	20028	50	20m.fbmy8028_rel_withdbg.cay9c1g
79051	0	15	1.9	159.4	62.0	0.000	0.024	0.002	0.803	17248	74.1	0.218	75	3.6	5.5	1.8	0.128	20328	15533	20m.fbmy8028_rel.cay9c1g
79051	0	13	1.6	161.2	62.1	0.000	0.021	0.002	0.805	17099	74.7	0.216	76	3.8	5.8	1.7	0.119	20178	15933	20m.fbmy8028_rel_o2.cay9c1g
80321	0	9	1.1	161.5	62.0	0.000	0.014	0.002	0.790	17340	74.4	0.216	74	5.0	6.9	1.8	0.153	20634	14934	20m.fbmy8028_rel_native.cay9c1g
80321	0	18	2.2	157.8	61.0	0.000	0.028	0.002	0.778	17222	74.8	0.214	75	3.4	5.4	1.8	0.122	20485	15583	20m.fbmy8028_rel_o2_lto.cay9c1g
82988	0	20	2.5	169.0	65.4	0.000	0.031	0.002	0.807	17839	74.4	0.215	72	3.3	5.3	1.8	0.122	21177	16538	20m.fbmy8028_rel_lto.cay9c1g
83333	0	16	1.9	168.4	65.4	0.000	0.023	0.002	0.804	17939	74.3	0.215	71	3.5	5.4	1.7	0.108	21377	15783	20m.fbmy8028_rel_native_lto.cay9c1g
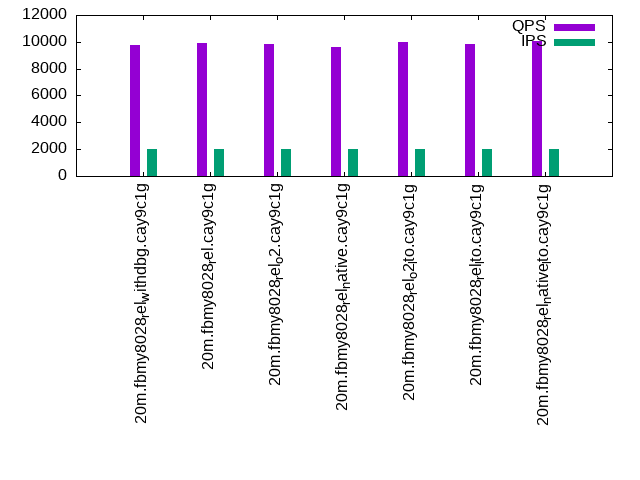
q100.1
q100.1: range queries with 100 insert/s per client. Graphs for performance per 1-second interval are here.
Average throughput:
Query response time histogram: each cell has the percentage of responses that take <= the time in the header and max is the max response time in seconds. For max values in the top 25% of the range have a red background and in the bottom 25% of the range have a green background. The red background is not used when the min value is within 80% of the max value.
| dbms | 256us | 1ms | 4ms | 16ms | 64ms | 256ms | 1s | 4s | 16s | gt | max |
|---|---|---|---|---|---|---|---|---|---|---|---|
| fbmy8028_rel_withdbg.cay9c1g | 3.856 | 96.133 | 0.011 | 0.001 | nonzero | 0.016 | |||||
| fbmy8028_rel.cay9c1g | 4.363 | 95.625 | 0.012 | 0.001 | 0.008 | ||||||
| fbmy8028_rel_o2.cay9c1g | 4.084 | 95.904 | 0.011 | nonzero | 0.013 | ||||||
| fbmy8028_rel_native.cay9c1g | 3.508 | 96.480 | 0.011 | 0.001 | 0.014 | ||||||
| fbmy8028_rel_o2_lto.cay9c1g | 6.335 | 93.653 | 0.011 | 0.001 | 0.009 | ||||||
| fbmy8028_rel_lto.cay9c1g | 6.289 | 93.700 | 0.010 | nonzero | 0.013 | ||||||
| fbmy8028_rel_native_lto.cay9c1g | 7.171 | 92.818 | 0.010 | nonzero | 0.014 |
Insert response time histogram: each cell has the percentage of responses that take <= the time in the header and max is the max response time in seconds. For max values in the top 25% of the range have a red background and in the bottom 25% of the range have a green background. The red background is not used when the min value is within 80% of the max value.
| dbms | 256us | 1ms | 4ms | 16ms | 64ms | 256ms | 1s | 4s | 16s | gt | max |
|---|---|---|---|---|---|---|---|---|---|---|---|
| fbmy8028_rel_withdbg.cay9c1g | 99.604 | 0.354 | 0.042 | 0.017 | |||||||
| fbmy8028_rel.cay9c1g | 99.333 | 0.618 | 0.049 | 0.018 | |||||||
| fbmy8028_rel_o2.cay9c1g | 99.444 | 0.521 | 0.035 | 0.017 | |||||||
| fbmy8028_rel_native.cay9c1g | 99.521 | 0.438 | 0.042 | 0.023 | |||||||
| fbmy8028_rel_o2_lto.cay9c1g | 99.556 | 0.403 | 0.042 | 0.018 | |||||||
| fbmy8028_rel_lto.cay9c1g | 99.521 | 0.444 | 0.035 | 0.017 | |||||||
| fbmy8028_rel_native_lto.cay9c1g | 99.653 | 0.319 | 0.028 | 0.017 |
Performance metrics for the DBMS listed above. Some are normalized by throughput, others are not. Legend for results is here.
ips	qps	rps	rmbps	wps	wmbps	rpq	rkbpq	wpi	wkbpi	csps	cpups	cspq	cpupq	dbgb1	dbgb2	rss	maxop	p50	p99	tag
399	10078	4	0.1	7.0	1.6	0.000	0.011	0.017	3.988	38099	51.1	3.780	406	2.8	4.9	1.9	0.016	2525	2062	20m.fbmy8028_rel_withdbg.cay9c1g
399	10076	11	0.2	7.2	1.7	0.001	0.016	0.018	4.437	38072	51.2	3.779	407	2.8	4.9	1.7	0.008	2541	2031	20m.fbmy8028_rel.cay9c1g
399	10036	10	0.2	7.0	1.5	0.001	0.017	0.017	3.957	38006	51.0	3.787	407	2.9	4.9	1.8	0.013	2477	1950	20m.fbmy8028_rel_o2.cay9c1g
399	10029	22	0.3	7.9	1.9	0.002	0.028	0.020	5.000	37875	51.3	3.776	409	2.8	4.8	1.8	0.014	2510	2031	20m.fbmy8028_rel_native.cay9c1g
399	10215	8	0.1	7.3	1.7	0.001	0.012	0.018	4.441	38592	51.2	3.778	401	2.8	4.9	1.7	0.009	2557	2078	20m.fbmy8028_rel_o2_lto.cay9c1g
399	10175	3	0.1	6.5	1.4	0.000	0.008	0.016	3.662	38541	51.0	3.788	401	2.9	4.9	1.8	0.013	2573	2079	20m.fbmy8028_rel_lto.cay9c1g
399	10244	14	0.2	7.4	1.7	0.001	0.015	0.019	4.458	38719	51.2	3.780	400	2.8	4.8	1.8	0.014	2573	2047	20m.fbmy8028_rel_native_lto.cay9c1g
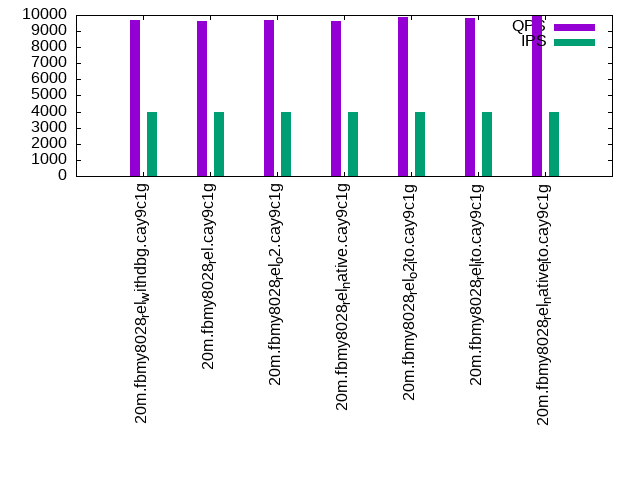
q500.1
q500.1: range queries with 500 insert/s per client. Graphs for performance per 1-second interval are here.
Average throughput:
Query response time histogram: each cell has the percentage of responses that take <= the time in the header and max is the max response time in seconds. For max values in the top 25% of the range have a red background and in the bottom 25% of the range have a green background. The red background is not used when the min value is within 80% of the max value.
| dbms | 256us | 1ms | 4ms | 16ms | 64ms | 256ms | 1s | 4s | 16s | gt | max |
|---|---|---|---|---|---|---|---|---|---|---|---|
| fbmy8028_rel_withdbg.cay9c1g | 1.306 | 98.633 | 0.057 | 0.004 | nonzero | 0.018 | |||||
| fbmy8028_rel.cay9c1g | 1.851 | 98.098 | 0.049 | 0.003 | 0.016 | ||||||
| fbmy8028_rel_o2.cay9c1g | 1.326 | 98.618 | 0.053 | 0.003 | nonzero | 0.020 | |||||
| fbmy8028_rel_native.cay9c1g | 1.243 | 98.704 | 0.050 | 0.003 | nonzero | 0.017 | |||||
| fbmy8028_rel_o2_lto.cay9c1g | 2.944 | 96.999 | 0.055 | 0.003 | nonzero | 0.020 | |||||
| fbmy8028_rel_lto.cay9c1g | 2.703 | 97.250 | 0.045 | 0.002 | nonzero | 0.016 | |||||
| fbmy8028_rel_native_lto.cay9c1g | 4.125 | 95.826 | 0.046 | 0.002 | nonzero | 0.020 |
Insert response time histogram: each cell has the percentage of responses that take <= the time in the header and max is the max response time in seconds. For max values in the top 25% of the range have a red background and in the bottom 25% of the range have a green background. The red background is not used when the min value is within 80% of the max value.
| dbms | 256us | 1ms | 4ms | 16ms | 64ms | 256ms | 1s | 4s | 16s | gt | max |
|---|---|---|---|---|---|---|---|---|---|---|---|
| fbmy8028_rel_withdbg.cay9c1g | 94.626 | 5.232 | 0.140 | 0.001 | 0.069 | ||||||
| fbmy8028_rel.cay9c1g | 96.871 | 3.049 | 0.081 | 0.051 | |||||||
| fbmy8028_rel_o2.cay9c1g | 96.419 | 3.471 | 0.110 | 0.062 | |||||||
| fbmy8028_rel_native.cay9c1g | 98.119 | 1.801 | 0.079 | 0.062 | |||||||
| fbmy8028_rel_o2_lto.cay9c1g | 97.129 | 2.771 | 0.099 | 0.001 | 0.067 | ||||||
| fbmy8028_rel_lto.cay9c1g | 97.642 | 2.278 | 0.079 | 0.001 | 0.066 | ||||||
| fbmy8028_rel_native_lto.cay9c1g | 97.869 | 2.046 | 0.083 | 0.001 | 0.065 |
Performance metrics for the DBMS listed above. Some are normalized by throughput, others are not. Legend for results is here.
ips	qps	rps	rmbps	wps	wmbps	rpq	rkbpq	wpi	wkbpi	csps	cpups	cspq	cpupq	dbgb1	dbgb2	rss	maxop	p50	p99	tag
1994	9756	0	0.0	7.4	1.7	0.000	0.000	0.004	0.887	36804	51.8	3.772	425	3.2	3.7	1.7	0.018	2413	1982	20m.fbmy8028_rel_withdbg.cay9c1g
1994	9878	0	0.0	7.4	1.7	0.000	0.000	0.004	0.886	37263	51.8	3.772	420	3.2	3.7	1.7	0.016	2461	2030	20m.fbmy8028_rel.cay9c1g
1994	9832	0	0.0	7.4	1.8	0.000	0.000	0.004	0.928	37064	51.8	3.770	422	3.2	3.7	1.8	0.020	2477	1998	20m.fbmy8028_rel_o2.cay9c1g
1994	9641	0	0.0	8.3	2.1	0.000	0.000	0.004	1.101	36308	52.0	3.766	431	3.1	3.6	1.7	0.017	2413	1983	20m.fbmy8028_rel_native.cay9c1g
1994	9966	0	0.0	8.4	2.2	0.000	0.000	0.004	1.142	37497	51.9	3.762	417	3.1	3.6	1.7	0.020	2509	2030	20m.fbmy8028_rel_o2_lto.cay9c1g
1994	9843	0	0.0	8.0	2.0	0.000	0.000	0.004	1.040	37084	51.8	3.768	421	3.2	3.7	1.8	0.016	2477	2062	20m.fbmy8028_rel_lto.cay9c1g
1994	10067	0	0.0	7.1	1.6	0.000	0.000	0.004	0.845	38005	51.6	3.775	410	3.2	3.7	1.7	0.020	2493	2062	20m.fbmy8028_rel_native_lto.cay9c1g
q1000.1
q1000.1: range queries with 1000 insert/s per client. Graphs for performance per 1-second interval are here.
Average throughput:
Query response time histogram: each cell has the percentage of responses that take <= the time in the header and max is the max response time in seconds. For max values in the top 25% of the range have a red background and in the bottom 25% of the range have a green background. The red background is not used when the min value is within 80% of the max value.
| dbms | 256us | 1ms | 4ms | 16ms | 64ms | 256ms | 1s | 4s | 16s | gt | max |
|---|---|---|---|---|---|---|---|---|---|---|---|
| fbmy8028_rel_withdbg.cay9c1g | 0.834 | 99.023 | 0.137 | 0.006 | nonzero | 0.021 | |||||
| fbmy8028_rel.cay9c1g | 1.028 | 98.822 | 0.143 | 0.007 | nonzero | 0.024 | |||||
| fbmy8028_rel_o2.cay9c1g | 1.001 | 98.859 | 0.133 | 0.006 | nonzero | 0.023 | |||||
| fbmy8028_rel_native.cay9c1g | 1.018 | 98.831 | 0.144 | 0.007 | nonzero | 0.019 | |||||
| fbmy8028_rel_o2_lto.cay9c1g | 1.993 | 97.889 | 0.112 | 0.005 | nonzero | 0.021 | |||||
| fbmy8028_rel_lto.cay9c1g | 2.154 | 97.743 | 0.099 | 0.004 | nonzero | 0.020 | |||||
| fbmy8028_rel_native_lto.cay9c1g | 2.866 | 97.016 | 0.113 | 0.005 | nonzero | 0.019 |
Insert response time histogram: each cell has the percentage of responses that take <= the time in the header and max is the max response time in seconds. For max values in the top 25% of the range have a red background and in the bottom 25% of the range have a green background. The red background is not used when the min value is within 80% of the max value.
| dbms | 256us | 1ms | 4ms | 16ms | 64ms | 256ms | 1s | 4s | 16s | gt | max |
|---|---|---|---|---|---|---|---|---|---|---|---|
| fbmy8028_rel_withdbg.cay9c1g | 91.142 | 8.703 | 0.154 | 0.001 | 0.064 | ||||||
| fbmy8028_rel.cay9c1g | 91.654 | 8.169 | 0.176 | 0.001 | 0.065 | ||||||
| fbmy8028_rel_o2.cay9c1g | 93.572 | 6.308 | 0.119 | 0.001 | 0.067 | ||||||
| fbmy8028_rel_native.cay9c1g | 87.970 | 11.840 | 0.190 | 0.001 | 0.066 | ||||||
| fbmy8028_rel_o2_lto.cay9c1g | 94.107 | 5.773 | 0.120 | 0.058 | |||||||
| fbmy8028_rel_lto.cay9c1g | 97.814 | 2.089 | 0.096 | 0.001 | 0.114 | ||||||
| fbmy8028_rel_native_lto.cay9c1g | 94.706 | 5.166 | 0.128 | 0.061 |
Performance metrics for the DBMS listed above. Some are normalized by throughput, others are not. Legend for results is here.
ips	qps	rps	rmbps	wps	wmbps	rpq	rkbpq	wpi	wkbpi	csps	cpups	cspq	cpupq	dbgb1	dbgb2	rss	maxop	p50	p99	tag
3987	9679	0	0.0	15.4	4.9	0.000	0.000	0.004	1.266	35831	53.9	3.702	446	3.6	5.1	1.8	0.021	2445	2014	20m.fbmy8028_rel_withdbg.cay9c1g
3989	9640	0	0.0	15.4	4.9	0.000	0.000	0.004	1.265	35713	54.0	3.704	448	3.6	5.1	1.8	0.024	2429	1998	20m.fbmy8028_rel.cay9c1g
3989	9702	0	0.0	16.5	5.4	0.000	0.000	0.004	1.387	35781	54.3	3.688	448	3.7	5.1	1.8	0.023	2445	1998	20m.fbmy8028_rel_o2.cay9c1g
3989	9617	0	0.0	15.3	5.0	0.000	0.000	0.004	1.276	35589	53.9	3.701	448	3.7	5.1	1.8	0.019	2397	2030	20m.fbmy8028_rel_native.cay9c1g
3989	9882	0	0.0	15.3	4.8	0.000	0.000	0.004	1.234	36529	54.0	3.697	437	3.7	5.1	1.8	0.021	2493	2046	20m.fbmy8028_rel_o2_lto.cay9c1g
3989	9827	0	0.0	15.2	4.9	0.000	0.000	0.004	1.249	36348	53.8	3.699	438	3.7	5.1	1.8	0.020	2461	2014	20m.fbmy8028_rel_lto.cay9c1g
3989	9909	0	0.0	15.3	4.9	0.000	0.000	0.004	1.262	36735	53.8	3.707	434	3.7	5.1	1.8	0.019	2493	2014	20m.fbmy8028_rel_native_lto.cay9c1g
l.i0
l.i0: load without secondary indexes
Performance metrics for all DBMS, not just the ones listed above. Some are normalized by throughput, others are not. Legend for results is here.
ips	qps	rps	rmbps	wps	wmbps	rpq	rkbpq	wpi	wkbpi	csps	cpups	cspq	cpupq	dbgb1	dbgb2	rss	maxop	p50	p99	tag
151515	0	0	0.0	112.5	42.6	0.000	0.000	0.001	0.288	15525	66.9	0.102	35	0.7	1.9	0.8	0.121	40556	26970	20m.fbmy8028_rel_withdbg.cay9c1g
151515	0	0	0.0	111.5	42.6	0.000	0.000	0.001	0.288	15619	66.4	0.103	35	0.7	1.9	0.8	0.132	41355	8890	20m.fbmy8028_rel.cay9c1g
151515	0	0	0.0	111.8	42.6	0.000	0.000	0.001	0.288	15606	67.1	0.103	35	0.7	1.9	0.7	0.117	40656	24483	20m.fbmy8028_rel_o2.cay9c1g
153846	0	0	0.0	112.1	42.6	0.000	0.000	0.001	0.284	15601	66.4	0.101	35	0.7	1.9	0.8	0.126	41355	11594	20m.fbmy8028_rel_native.cay9c1g
153846	0	0	0.0	112.6	42.6	0.000	0.000	0.001	0.284	15586	66.8	0.101	35	0.7	1.9	0.8	0.121	41654	5294	20m.fbmy8028_rel_o2_lto.cay9c1g
158730	0	0	0.0	116.3	44.3	0.000	0.000	0.001	0.286	16141	66.5	0.102	34	0.7	1.9	0.7	0.123	43352	34674	20m.fbmy8028_rel_lto.cay9c1g
160000	0	0	0.0	111.2	44.3	0.000	0.000	0.001	0.284	16148	66.6	0.101	33	0.7	1.9	0.8	0.139	43253	29267	20m.fbmy8028_rel_native_lto.cay9c1g
l.x
l.x: create secondary indexes
Performance metrics for all DBMS, not just the ones listed above. Some are normalized by throughput, others are not. Legend for results is here.
ips	qps	rps	rmbps	wps	wmbps	rpq	rkbpq	wpi	wkbpi	csps	cpups	cspq	cpupq	dbgb1	dbgb2	rss	maxop	p50	p99	tag
239286	0	1	0.0	94.4	39.4	0.000	0.000	0.000	0.169	680	48.1	0.003	16	1.4	2.7	2.2	0.014	NA	NA	20m.fbmy8028_rel_withdbg.cay9c1g
271622	0	0	0.0	102.1	43.4	0.000	0.000	0.000	0.164	579	47.8	0.002	14	1.4	2.7	2.2	0.014	NA	NA	20m.fbmy8028_rel.cay9c1g
242169	0	0	0.0	94.0	39.4	0.000	0.000	0.000	0.167	660	48.4	0.003	16	1.4	2.7	2.1	0.017	NA	NA	20m.fbmy8028_rel_o2.cay9c1g
264474	0	1	0.0	108.4	44.4	0.000	0.000	0.000	0.172	638	47.1	0.002	14	1.4	2.7	2.2	0.017	NA	NA	20m.fbmy8028_rel_native.cay9c1g
245122	0	0	0.0	95.4	40.5	0.000	0.000	0.000	0.169	658	48.1	0.003	16	1.4	2.7	2.2	0.009	NA	NA	20m.fbmy8028_rel_o2_lto.cay9c1g
279167	0	1	0.0	115.3	47.1	0.000	0.000	0.000	0.173	709	47.2	0.003	14	1.4	2.7	2.2	0.009	NA	NA	20m.fbmy8028_rel_lto.cay9c1g
287143	0	1	0.0	113.8	47.4	0.000	0.000	0.000	0.169	813	47.3	0.003	13	1.4	2.7	2.2	0.008	NA	NA	20m.fbmy8028_rel_native_lto.cay9c1g
l.i1
l.i1: continue load after secondary indexes created
Performance metrics for all DBMS, not just the ones listed above. Some are normalized by throughput, others are not. Legend for results is here.
ips	qps	rps	rmbps	wps	wmbps	rpq	rkbpq	wpi	wkbpi	csps	cpups	cspq	cpupq	dbgb1	dbgb2	rss	maxop	p50	p99	tag
74627	0	15	1.8	154.9	59.8	0.000	0.025	0.002	0.821	16160	73.7	0.217	79	3.8	5.7	1.7	0.763	20028	50	20m.fbmy8028_rel_withdbg.cay9c1g
79051	0	15	1.9	159.4	62.0	0.000	0.024	0.002	0.803	17248	74.1	0.218	75	3.6	5.5	1.8	0.128	20328	15533	20m.fbmy8028_rel.cay9c1g
79051	0	13	1.6	161.2	62.1	0.000	0.021	0.002	0.805	17099	74.7	0.216	76	3.8	5.8	1.7	0.119	20178	15933	20m.fbmy8028_rel_o2.cay9c1g
80321	0	9	1.1	161.5	62.0	0.000	0.014	0.002	0.790	17340	74.4	0.216	74	5.0	6.9	1.8	0.153	20634	14934	20m.fbmy8028_rel_native.cay9c1g
80321	0	18	2.2	157.8	61.0	0.000	0.028	0.002	0.778	17222	74.8	0.214	75	3.4	5.4	1.8	0.122	20485	15583	20m.fbmy8028_rel_o2_lto.cay9c1g
82988	0	20	2.5	169.0	65.4	0.000	0.031	0.002	0.807	17839	74.4	0.215	72	3.3	5.3	1.8	0.122	21177	16538	20m.fbmy8028_rel_lto.cay9c1g
83333	0	16	1.9	168.4	65.4	0.000	0.023	0.002	0.804	17939	74.3	0.215	71	3.5	5.4	1.7	0.108	21377	15783	20m.fbmy8028_rel_native_lto.cay9c1g
q100.1
q100.1: range queries with 100 insert/s per client
Performance metrics for all DBMS, not just the ones listed above. Some are normalized by throughput, others are not. Legend for results is here.
ips	qps	rps	rmbps	wps	wmbps	rpq	rkbpq	wpi	wkbpi	csps	cpups	cspq	cpupq	dbgb1	dbgb2	rss	maxop	p50	p99	tag
399	10078	4	0.1	7.0	1.6	0.000	0.011	0.017	3.988	38099	51.1	3.780	406	2.8	4.9	1.9	0.016	2525	2062	20m.fbmy8028_rel_withdbg.cay9c1g
399	10076	11	0.2	7.2	1.7	0.001	0.016	0.018	4.437	38072	51.2	3.779	407	2.8	4.9	1.7	0.008	2541	2031	20m.fbmy8028_rel.cay9c1g
399	10036	10	0.2	7.0	1.5	0.001	0.017	0.017	3.957	38006	51.0	3.787	407	2.9	4.9	1.8	0.013	2477	1950	20m.fbmy8028_rel_o2.cay9c1g
399	10029	22	0.3	7.9	1.9	0.002	0.028	0.020	5.000	37875	51.3	3.776	409	2.8	4.8	1.8	0.014	2510	2031	20m.fbmy8028_rel_native.cay9c1g
399	10215	8	0.1	7.3	1.7	0.001	0.012	0.018	4.441	38592	51.2	3.778	401	2.8	4.9	1.7	0.009	2557	2078	20m.fbmy8028_rel_o2_lto.cay9c1g
399	10175	3	0.1	6.5	1.4	0.000	0.008	0.016	3.662	38541	51.0	3.788	401	2.9	4.9	1.8	0.013	2573	2079	20m.fbmy8028_rel_lto.cay9c1g
399	10244	14	0.2	7.4	1.7	0.001	0.015	0.019	4.458	38719	51.2	3.780	400	2.8	4.8	1.8	0.014	2573	2047	20m.fbmy8028_rel_native_lto.cay9c1g
q500.1
q500.1: range queries with 500 insert/s per client
Performance metrics for all DBMS, not just the ones listed above. Some are normalized by throughput, others are not. Legend for results is here.
ips	qps	rps	rmbps	wps	wmbps	rpq	rkbpq	wpi	wkbpi	csps	cpups	cspq	cpupq	dbgb1	dbgb2	rss	maxop	p50	p99	tag
1994	9756	0	0.0	7.4	1.7	0.000	0.000	0.004	0.887	36804	51.8	3.772	425	3.2	3.7	1.7	0.018	2413	1982	20m.fbmy8028_rel_withdbg.cay9c1g
1994	9878	0	0.0	7.4	1.7	0.000	0.000	0.004	0.886	37263	51.8	3.772	420	3.2	3.7	1.7	0.016	2461	2030	20m.fbmy8028_rel.cay9c1g
1994	9832	0	0.0	7.4	1.8	0.000	0.000	0.004	0.928	37064	51.8	3.770	422	3.2	3.7	1.8	0.020	2477	1998	20m.fbmy8028_rel_o2.cay9c1g
1994	9641	0	0.0	8.3	2.1	0.000	0.000	0.004	1.101	36308	52.0	3.766	431	3.1	3.6	1.7	0.017	2413	1983	20m.fbmy8028_rel_native.cay9c1g
1994	9966	0	0.0	8.4	2.2	0.000	0.000	0.004	1.142	37497	51.9	3.762	417	3.1	3.6	1.7	0.020	2509	2030	20m.fbmy8028_rel_o2_lto.cay9c1g
1994	9843	0	0.0	8.0	2.0	0.000	0.000	0.004	1.040	37084	51.8	3.768	421	3.2	3.7	1.8	0.016	2477	2062	20m.fbmy8028_rel_lto.cay9c1g
1994	10067	0	0.0	7.1	1.6	0.000	0.000	0.004	0.845	38005	51.6	3.775	410	3.2	3.7	1.7	0.020	2493	2062	20m.fbmy8028_rel_native_lto.cay9c1g
q1000.1
q1000.1: range queries with 1000 insert/s per client
Performance metrics for all DBMS, not just the ones listed above. Some are normalized by throughput, others are not. Legend for results is here.
ips	qps	rps	rmbps	wps	wmbps	rpq	rkbpq	wpi	wkbpi	csps	cpups	cspq	cpupq	dbgb1	dbgb2	rss	maxop	p50	p99	tag
3987	9679	0	0.0	15.4	4.9	0.000	0.000	0.004	1.266	35831	53.9	3.702	446	3.6	5.1	1.8	0.021	2445	2014	20m.fbmy8028_rel_withdbg.cay9c1g
3989	9640	0	0.0	15.4	4.9	0.000	0.000	0.004	1.265	35713	54.0	3.704	448	3.6	5.1	1.8	0.024	2429	1998	20m.fbmy8028_rel.cay9c1g
3989	9702	0	0.0	16.5	5.4	0.000	0.000	0.004	1.387	35781	54.3	3.688	448	3.7	5.1	1.8	0.023	2445	1998	20m.fbmy8028_rel_o2.cay9c1g
3989	9617	0	0.0	15.3	5.0	0.000	0.000	0.004	1.276	35589	53.9	3.701	448	3.7	5.1	1.8	0.019	2397	2030	20m.fbmy8028_rel_native.cay9c1g
3989	9882	0	0.0	15.3	4.8	0.000	0.000	0.004	1.234	36529	54.0	3.697	437	3.7	5.1	1.8	0.021	2493	2046	20m.fbmy8028_rel_o2_lto.cay9c1g
3989	9827	0	0.0	15.2	4.9	0.000	0.000	0.004	1.249	36348	53.8	3.699	438	3.7	5.1	1.8	0.020	2461	2014	20m.fbmy8028_rel_lto.cay9c1g
3989	9909	0	0.0	15.3	4.9	0.000	0.000	0.004	1.262	36735	53.8	3.707	434	3.7	5.1	1.8	0.019	2493	2014	20m.fbmy8028_rel_native_lto.cay9c1g
l.i0
- l.i0: load without secondary indexes
- Legend for results is here.
- Each entry lists the percentage of responses that fit in that bucket (slower than max time for previous bucket, faster than min time for next bucket).
Insert response time histogram
256us	1ms	4ms	16ms	64ms	256ms	1s	4s	16s	gt	max	tag
0.000	0.000	99.253	0.536	0.198	0.013	0.000	0.000	0.000	0.000	0.121	fbmy8028_rel_withdbg.cay9c1g
0.000	0.000	99.237	0.556	0.194	0.013	0.000	0.000	0.000	0.000	0.132	fbmy8028_rel.cay9c1g
0.000	0.000	99.248	0.559	0.178	0.013	0.000	0.000	0.000	0.000	0.117	fbmy8028_rel_o2.cay9c1g
0.000	0.000	99.272	0.517	0.198	0.013	0.000	0.000	0.000	0.000	0.126	fbmy8028_rel_native.cay9c1g
0.000	0.000	99.255	0.528	0.203	0.013	0.000	0.000	0.000	0.000	0.121	fbmy8028_rel_o2_lto.cay9c1g
0.000	0.000	99.279	0.515	0.193	0.013	0.000	0.000	0.000	0.000	0.123	fbmy8028_rel_lto.cay9c1g
0.000	0.000	99.302	0.483	0.202	0.013	0.000	0.000	0.000	0.000	0.139	fbmy8028_rel_native_lto.cay9c1g
l.x
- l.x: create secondary indexes
- Legend for results is here.
- Each entry lists the percentage of responses that fit in that bucket (slower than max time for previous bucket, faster than min time for next bucket).
TODO - determine whether there is data for create index response time
l.i1
- l.i1: continue load after secondary indexes created
- Legend for results is here.
- Each entry lists the percentage of responses that fit in that bucket (slower than max time for previous bucket, faster than min time for next bucket).
Insert response time histogram
256us	1ms	4ms	16ms	64ms	256ms	1s	4s	16s	gt	max	tag
0.000	0.000	99.022	0.849	0.103	0.006	0.020	0.000	0.000	0.000	0.763	fbmy8028_rel_withdbg.cay9c1g
0.000	0.000	99.165	0.716	0.113	0.006	0.000	0.000	0.000	0.000	0.128	fbmy8028_rel.cay9c1g
0.000	0.000	99.091	0.785	0.119	0.005	0.000	0.000	0.000	0.000	0.119	fbmy8028_rel_o2.cay9c1g
0.000	0.000	99.229	0.652	0.112	0.007	0.000	0.000	0.000	0.000	0.153	fbmy8028_rel_native.cay9c1g
0.000	0.000	99.080	0.795	0.119	0.006	0.000	0.000	0.000	0.000	0.122	fbmy8028_rel_o2_lto.cay9c1g
0.000	0.000	99.251	0.642	0.100	0.007	0.000	0.000	0.000	0.000	0.122	fbmy8028_rel_lto.cay9c1g
0.000	0.000	99.250	0.637	0.106	0.007	0.000	0.000	0.000	0.000	0.108	fbmy8028_rel_native_lto.cay9c1g
q100.1
- q100.1: range queries with 100 insert/s per client
- Legend for results is here.
- Each entry lists the percentage of responses that fit in that bucket (slower than max time for previous bucket, faster than min time for next bucket).
Query response time histogram
256us	1ms	4ms	16ms	64ms	256ms	1s	4s	16s	gt	max	tag
3.856	96.133	0.011	0.001	nonzero	0.000	0.000	0.000	0.000	0.000	0.016	fbmy8028_rel_withdbg.cay9c1g
4.363	95.625	0.012	0.001	0.000	0.000	0.000	0.000	0.000	0.000	0.008	fbmy8028_rel.cay9c1g
4.084	95.904	0.011	nonzero	0.000	0.000	0.000	0.000	0.000	0.000	0.013	fbmy8028_rel_o2.cay9c1g
3.508	96.480	0.011	0.001	0.000	0.000	0.000	0.000	0.000	0.000	0.014	fbmy8028_rel_native.cay9c1g
6.335	93.653	0.011	0.001	0.000	0.000	0.000	0.000	0.000	0.000	0.009	fbmy8028_rel_o2_lto.cay9c1g
6.289	93.700	0.010	nonzero	0.000	0.000	0.000	0.000	0.000	0.000	0.013	fbmy8028_rel_lto.cay9c1g
7.171	92.818	0.010	nonzero	0.000	0.000	0.000	0.000	0.000	0.000	0.014	fbmy8028_rel_native_lto.cay9c1g
Insert response time histogram
256us	1ms	4ms	16ms	64ms	256ms	1s	4s	16s	gt	max	tag
0.000	0.000	99.604	0.354	0.042	0.000	0.000	0.000	0.000	0.000	0.017	fbmy8028_rel_withdbg.cay9c1g
0.000	0.000	99.333	0.618	0.049	0.000	0.000	0.000	0.000	0.000	0.018	fbmy8028_rel.cay9c1g
0.000	0.000	99.444	0.521	0.035	0.000	0.000	0.000	0.000	0.000	0.017	fbmy8028_rel_o2.cay9c1g
0.000	0.000	99.521	0.438	0.042	0.000	0.000	0.000	0.000	0.000	0.023	fbmy8028_rel_native.cay9c1g
0.000	0.000	99.556	0.403	0.042	0.000	0.000	0.000	0.000	0.000	0.018	fbmy8028_rel_o2_lto.cay9c1g
0.000	0.000	99.521	0.444	0.035	0.000	0.000	0.000	0.000	0.000	0.017	fbmy8028_rel_lto.cay9c1g
0.000	0.000	99.653	0.319	0.028	0.000	0.000	0.000	0.000	0.000	0.017	fbmy8028_rel_native_lto.cay9c1g
q500.1
- q500.1: range queries with 500 insert/s per client
- Legend for results is here.
- Each entry lists the percentage of responses that fit in that bucket (slower than max time for previous bucket, faster than min time for next bucket).
Query response time histogram
256us	1ms	4ms	16ms	64ms	256ms	1s	4s	16s	gt	max	tag
1.306	98.633	0.057	0.004	nonzero	0.000	0.000	0.000	0.000	0.000	0.018	fbmy8028_rel_withdbg.cay9c1g
1.851	98.098	0.049	0.003	0.000	0.000	0.000	0.000	0.000	0.000	0.016	fbmy8028_rel.cay9c1g
1.326	98.618	0.053	0.003	nonzero	0.000	0.000	0.000	0.000	0.000	0.020	fbmy8028_rel_o2.cay9c1g
1.243	98.704	0.050	0.003	nonzero	0.000	0.000	0.000	0.000	0.000	0.017	fbmy8028_rel_native.cay9c1g
2.944	96.999	0.055	0.003	nonzero	0.000	0.000	0.000	0.000	0.000	0.020	fbmy8028_rel_o2_lto.cay9c1g
2.703	97.250	0.045	0.002	nonzero	0.000	0.000	0.000	0.000	0.000	0.016	fbmy8028_rel_lto.cay9c1g
4.125	95.826	0.046	0.002	nonzero	0.000	0.000	0.000	0.000	0.000	0.020	fbmy8028_rel_native_lto.cay9c1g
Insert response time histogram
256us	1ms	4ms	16ms	64ms	256ms	1s	4s	16s	gt	max	tag
0.000	0.000	94.626	5.232	0.140	0.001	0.000	0.000	0.000	0.000	0.069	fbmy8028_rel_withdbg.cay9c1g
0.000	0.000	96.871	3.049	0.081	0.000	0.000	0.000	0.000	0.000	0.051	fbmy8028_rel.cay9c1g
0.000	0.000	96.419	3.471	0.110	0.000	0.000	0.000	0.000	0.000	0.062	fbmy8028_rel_o2.cay9c1g
0.000	0.000	98.119	1.801	0.079	0.000	0.000	0.000	0.000	0.000	0.062	fbmy8028_rel_native.cay9c1g
0.000	0.000	97.129	2.771	0.099	0.001	0.000	0.000	0.000	0.000	0.067	fbmy8028_rel_o2_lto.cay9c1g
0.000	0.000	97.642	2.278	0.079	0.001	0.000	0.000	0.000	0.000	0.066	fbmy8028_rel_lto.cay9c1g
0.000	0.000	97.869	2.046	0.083	0.001	0.000	0.000	0.000	0.000	0.065	fbmy8028_rel_native_lto.cay9c1g
q1000.1
- q1000.1: range queries with 1000 insert/s per client
- Legend for results is here.
- Each entry lists the percentage of responses that fit in that bucket (slower than max time for previous bucket, faster than min time for next bucket).
Query response time histogram
256us	1ms	4ms	16ms	64ms	256ms	1s	4s	16s	gt	max	tag
0.834	99.023	0.137	0.006	nonzero	0.000	0.000	0.000	0.000	0.000	0.021	fbmy8028_rel_withdbg.cay9c1g
1.028	98.822	0.143	0.007	nonzero	0.000	0.000	0.000	0.000	0.000	0.024	fbmy8028_rel.cay9c1g
1.001	98.859	0.133	0.006	nonzero	0.000	0.000	0.000	0.000	0.000	0.023	fbmy8028_rel_o2.cay9c1g
1.018	98.831	0.144	0.007	nonzero	0.000	0.000	0.000	0.000	0.000	0.019	fbmy8028_rel_native.cay9c1g
1.993	97.889	0.112	0.005	nonzero	0.000	0.000	0.000	0.000	0.000	0.021	fbmy8028_rel_o2_lto.cay9c1g
2.154	97.743	0.099	0.004	nonzero	0.000	0.000	0.000	0.000	0.000	0.020	fbmy8028_rel_lto.cay9c1g
2.866	97.016	0.113	0.005	nonzero	0.000	0.000	0.000	0.000	0.000	0.019	fbmy8028_rel_native_lto.cay9c1g
Insert response time histogram
256us	1ms	4ms	16ms	64ms	256ms	1s	4s	16s	gt	max	tag
0.000	0.000	91.142	8.703	0.154	0.001	0.000	0.000	0.000	0.000	0.064	fbmy8028_rel_withdbg.cay9c1g
0.000	0.000	91.654	8.169	0.176	0.001	0.000	0.000	0.000	0.000	0.065	fbmy8028_rel.cay9c1g
0.000	0.000	93.572	6.308	0.119	0.001	0.000	0.000	0.000	0.000	0.067	fbmy8028_rel_o2.cay9c1g
0.000	0.000	87.970	11.840	0.190	0.001	0.000	0.000	0.000	0.000	0.066	fbmy8028_rel_native.cay9c1g
0.000	0.000	94.107	5.773	0.120	0.000	0.000	0.000	0.000	0.000	0.058	fbmy8028_rel_o2_lto.cay9c1g
0.000	0.000	97.814	2.089	0.096	0.001	0.000	0.000	0.000	0.000	0.114	fbmy8028_rel_lto.cay9c1g
0.000	0.000	94.706	5.166	0.128	0.000	0.000	0.000	0.000	0.000	0.061	fbmy8028_rel_native_lto.cay9c1g