Introduction
This is a report for the insert benchmark with 20M docs and 4 client(s). It is generated by scripts (bash, awk, sed) and Tufte might not be impressed. An overview of the insert benchmark is here and a short update is here. Below, by DBMS, I mean DBMS+version.config. An example is my8020.c10b40 where my means MySQL, 8020 is version 8.0.20 and c10b40 is the name for the configuration file.
The test server has 8 AMD cores, 16G RAM and an NVMe SSD. It is described here as the Beelink. The benchmark was run with 4 clients and there were 1 or 2 connections per client (1 for queries, 1 for inserts). The benchmark loads 20M rows without secondary indexes, creates secondary indexes, loads another 20M rows then does 3 read+write tests for one hour each that do queries as fast as possible with 100, 500 and then 1000 writes/second/client concurrent with the queries. There is one table per client. The database is cached by the OS page cache but not by the storage engine. Clients and the DBMS share one server. The per-database configs are in the per-database subdirectories here.
The tested DBMS are:
- fbmy5635_rel_withdbg.cay9c1g - MyRocks 5.6.35, the cay9c1g config and compiled with CMAKE_BUILD_TYPE=RelWithDebInfo and -O2
- fbmy5635_rel_o2.cay9c1g - MyRocks 5.6.35, the cay9c1g config and compiled with CMAKE_BUILD_TYPE=Release and -O2
- fbmy5635_rel.cay9c1g - MyRocks 5.6.35, the cay9c1g config and compiled with CMAKE_BUILD_TYPE=Release and -O3
Contents
- Summary
- l.i0: load without secondary indexes
- l.x: create secondary indexes
- l.i1: continue load after secondary indexes created
- q100.1: range queries with 100 insert/s per client
- q500.1: range queries with 500 insert/s per client
- q1000.1: range queries with 1000 insert/s per client
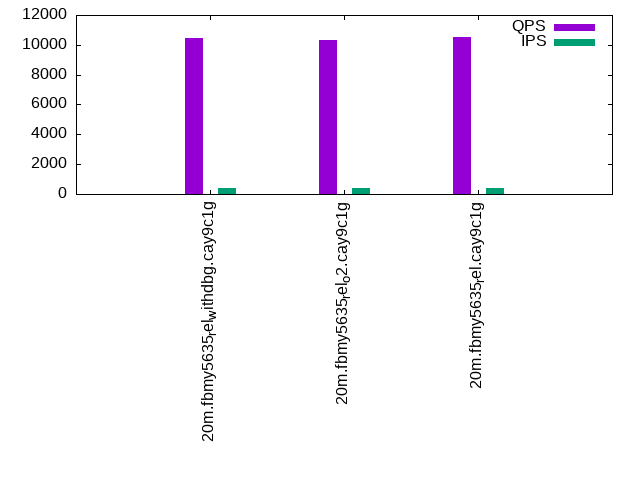
Summary
The numbers are inserts/s for l.i0 and l.i1, indexed docs (or rows) /s for l.x and queries/s for q*.2. The values are the average rate over the entire test for inserts (IPS) and queries (QPS). The range of values for IPS and QPS is split into 3 parts: bottom 25%, middle 50%, top 25%. Values in the bottom 25% have a red background, values in the top 25% have a green background and values in the middle have no color. A gray background is used for values that can be ignored because the DBMS did not sustain the target insert rate. Red backgrounds are not used when the minimum value is within 80% of the max value.
| dbms | l.i0 | l.x | l.i1 | q100.1 | q500.1 | q1000.1 |
|---|---|---|---|---|---|---|
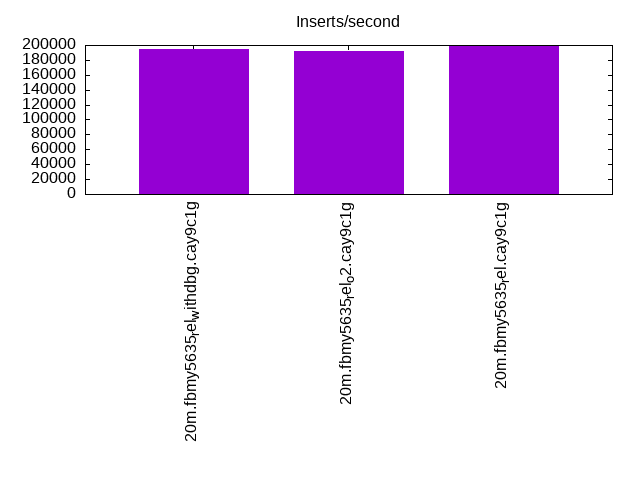
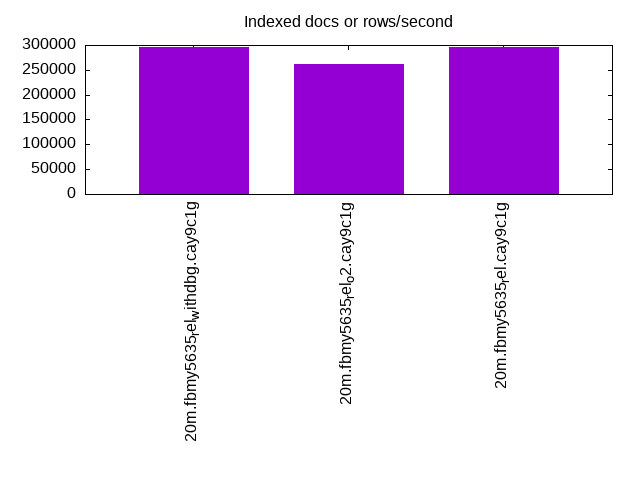
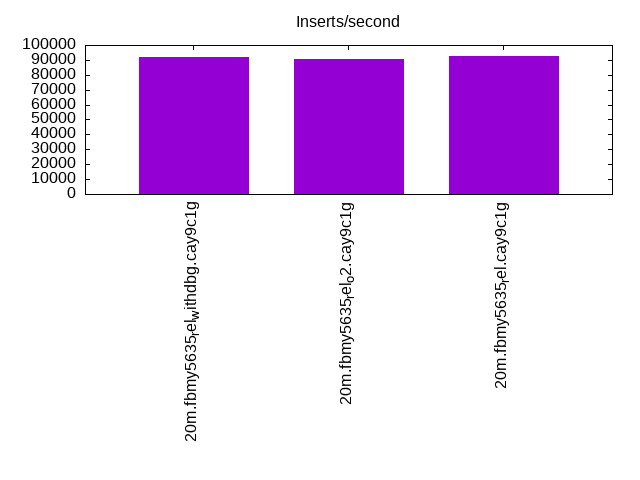
| 20m.fbmy5635_rel_withdbg.cay9c1g | 194175 | 295588 | 91743 | 10427 | 10153 | 10201 |
| 20m.fbmy5635_rel_o2.cay9c1g | 192308 | 261039 | 90909 | 10308 | 10119 | 10196 |
| 20m.fbmy5635_rel.cay9c1g | 198020 | 295588 | 92592 | 10514 | 10269 | 10270 |
This table has relative throughput, throughput for the DBMS relative to the DBMS in the first line, using the absolute throughput from the previous table.
| dbms | l.i0 | l.x | l.i1 | q100.1 | q500.1 | q1000.1 |
|---|---|---|---|---|---|---|
| 20m.fbmy5635_rel_withdbg.cay9c1g | 1.00 | 1.00 | 1.00 | 1.00 | 1.00 | 1.00 |
| 20m.fbmy5635_rel_o2.cay9c1g | 0.99 | 0.88 | 0.99 | 0.99 | 1.00 | 1.00 |
| 20m.fbmy5635_rel.cay9c1g | 1.02 | 1.00 | 1.01 | 1.01 | 1.01 | 1.01 |
This lists the average rate of inserts/s for the tests that do inserts concurrent with queries. For such tests the query rate is listed in the table above. The read+write tests are setup so that the insert rate should match the target rate every second. Cells that are not at least 95% of the target have a red background to indicate a failure to satisfy the target.
| dbms | q100.1 | q500.1 | q1000.1 |
|---|---|---|---|
| fbmy5635_rel_withdbg.cay9c1g | 399 | 1993 | 3989 |
| fbmy5635_rel_o2.cay9c1g | 399 | 1994 | 3989 |
| fbmy5635_rel.cay9c1g | 399 | 1994 | 3989 |
| target | 400 | 2000 | 4000 |
l.i0
l.i0: load without secondary indexes. Graphs for performance per 1-second interval are here.
Average throughput:
Insert response time histogram: each cell has the percentage of responses that take <= the time in the header and max is the max response time in seconds. For the max column values in the top 25% of the range have a red background and in the bottom 25% of the range have a green background. The red background is not used when the min value is within 80% of the max value.
| dbms | 256us | 1ms | 4ms | 16ms | 64ms | 256ms | 1s | 4s | 16s | gt | max |
|---|---|---|---|---|---|---|---|---|---|---|---|
| fbmy5635_rel_withdbg.cay9c1g | 99.763 | 0.220 | 0.005 | 0.013 | 0.103 | ||||||
| fbmy5635_rel_o2.cay9c1g | 99.764 | 0.219 | 0.003 | 0.013 | 0.114 | ||||||
| fbmy5635_rel.cay9c1g | 99.749 | 0.237 | 0.001 | 0.013 | 0.107 |
Performance metrics for the DBMS listed above. Some are normalized by throughput, others are not. Legend for results is here.
ips	qps	rps	rmbps	wps	wmbps	rpq	rkbpq	wpi	wkbpi	csps	cpups	cspq	cpupq	dbgb1	dbgb2	rss	maxop	p50	p99	tag
194175	0	0	0.0	122.0	51.3	0.000	0.000	0.001	0.271	20093	72.5	0.103	30	0.9	1.9	0.4	0.103	54541	18680	20m.fbmy5635_rel_withdbg.cay9c1g
192308	0	0	0.0	124.2	52.3	0.000	0.000	0.001	0.278	19892	73.4	0.103	31	0.8	1.8	0.4	0.114	52741	23474	20m.fbmy5635_rel_o2.cay9c1g
198020	0	0	0.0	122.2	51.5	0.000	0.000	0.001	0.267	20134	72.1	0.102	29	0.9	1.9	0.4	0.107	55157	22284	20m.fbmy5635_rel.cay9c1g
l.x
l.x: create secondary indexes.
Average throughput:
Performance metrics for the DBMS listed above. Some are normalized by throughput, others are not. Legend for results is here.
ips	qps	rps	rmbps	wps	wmbps	rpq	rkbpq	wpi	wkbpi	csps	cpups	cspq	cpupq	dbgb1	dbgb2	rss	maxop	p50	p99	tag
295588	0	1	0.0	128.8	54.1	0.000	0.000	0.000	0.187	614	49.1	0.002	13	1.4	2.4	1.5	0.008	NA	NA	20m.fbmy5635_rel_withdbg.cay9c1g
261039	0	1	0.0	108.6	45.6	0.000	0.000	0.000	0.179	546	48.0	0.002	15	1.4	2.5	1.5	0.024	NA	NA	20m.fbmy5635_rel_o2.cay9c1g
295588	0	1	0.0	131.8	55.7	0.000	0.000	0.000	0.193	656	48.6	0.002	13	1.4	2.4	1.6	0.003	NA	NA	20m.fbmy5635_rel.cay9c1g
l.i1
l.i1: continue load after secondary indexes created. Graphs for performance per 1-second interval are here.
Average throughput:
Insert response time histogram: each cell has the percentage of responses that take <= the time in the header and max is the max response time in seconds. For the max column values in the top 25% of the range have a red background and in the bottom 25% of the range have a green background. The red background is not used when the min value is within 80% of the max value.
| dbms | 256us | 1ms | 4ms | 16ms | 64ms | 256ms | 1s | 4s | 16s | gt | max |
|---|---|---|---|---|---|---|---|---|---|---|---|
| fbmy5635_rel_withdbg.cay9c1g | 99.594 | 0.392 | 0.007 | 0.007 | 0.117 | ||||||
| fbmy5635_rel_o2.cay9c1g | 99.607 | 0.386 | nonzero | 0.007 | 0.110 | ||||||
| fbmy5635_rel.cay9c1g | 99.611 | 0.379 | 0.004 | 0.007 | 0.108 |
Performance metrics for the DBMS listed above. Some are normalized by throughput, others are not. Legend for results is here.
ips	qps	rps	rmbps	wps	wmbps	rpq	rkbpq	wpi	wkbpi	csps	cpups	cspq	cpupq	dbgb1	dbgb2	rss	maxop	p50	p99	tag
91743	0	10	1.2	172.7	69.7	0.000	0.014	0.002	0.778	20098	74.1	0.219	65	4.7	6.5	1.4	0.117	23583	18080	20m.fbmy5635_rel_withdbg.cay9c1g
90909	0	11	1.4	169.8	68.6	0.000	0.016	0.002	0.773	19744	75.2	0.217	66	3.5	5.3	1.3	0.110	23474	17388	20m.fbmy5635_rel_o2.cay9c1g
92592	0	12	1.5	173.4	69.9	0.000	0.017	0.002	0.773	20258	73.9	0.219	64	4.3	6.0	1.3	0.108	23931	17836	20m.fbmy5635_rel.cay9c1g
q100.1
q100.1: range queries with 100 insert/s per client. Graphs for performance per 1-second interval are here.
Average throughput:
Query response time histogram: each cell has the percentage of responses that take <= the time in the header and max is the max response time in seconds. For max values in the top 25% of the range have a red background and in the bottom 25% of the range have a green background. The red background is not used when the min value is within 80% of the max value.
| dbms | 256us | 1ms | 4ms | 16ms | 64ms | 256ms | 1s | 4s | 16s | gt | max |
|---|---|---|---|---|---|---|---|---|---|---|---|
| fbmy5635_rel_withdbg.cay9c1g | 9.002 | 90.991 | 0.006 | 0.001 | 0.015 | ||||||
| fbmy5635_rel_o2.cay9c1g | 8.532 | 91.462 | 0.006 | 0.001 | 0.013 | ||||||
| fbmy5635_rel.cay9c1g | 10.299 | 89.693 | 0.007 | 0.001 | 0.012 |
Insert response time histogram: each cell has the percentage of responses that take <= the time in the header and max is the max response time in seconds. For max values in the top 25% of the range have a red background and in the bottom 25% of the range have a green background. The red background is not used when the min value is within 80% of the max value.
| dbms | 256us | 1ms | 4ms | 16ms | 64ms | 256ms | 1s | 4s | 16s | gt | max |
|---|---|---|---|---|---|---|---|---|---|---|---|
| fbmy5635_rel_withdbg.cay9c1g | 99.347 | 0.590 | 0.062 | 0.035 | |||||||
| fbmy5635_rel_o2.cay9c1g | 99.424 | 0.562 | 0.014 | 0.028 | |||||||
| fbmy5635_rel.cay9c1g | 99.493 | 0.507 | 0.011 |
Performance metrics for the DBMS listed above. Some are normalized by throughput, others are not. Legend for results is here.
ips	qps	rps	rmbps	wps	wmbps	rpq	rkbpq	wpi	wkbpi	csps	cpups	cspq	cpupq	dbgb1	dbgb2	rss	maxop	p50	p99	tag
399	10427	23	0.3	8.0	2.0	0.002	0.026	0.020	5.167	39156	50.6	3.755	388	2.8	4.7	1.3	0.015	2589	2269	20m.fbmy5635_rel_withdbg.cay9c1g
399	10308	17	0.2	7.7	1.9	0.002	0.023	0.019	4.756	38726	50.5	3.757	392	2.8	4.7	1.4	0.013	2525	2285	20m.fbmy5635_rel_o2.cay9c1g
399	10514	17	0.2	7.9	1.9	0.002	0.023	0.020	4.992	39547	50.6	3.762	385	2.8	4.7	1.4	0.012	2637	2253	20m.fbmy5635_rel.cay9c1g
q500.1
q500.1: range queries with 500 insert/s per client. Graphs for performance per 1-second interval are here.
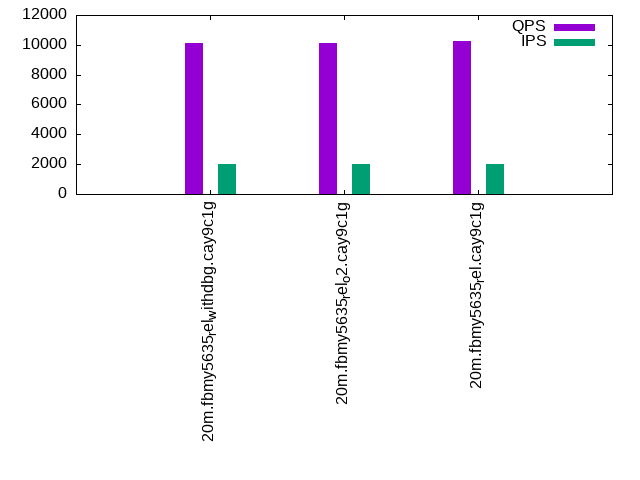
Average throughput:
Query response time histogram: each cell has the percentage of responses that take <= the time in the header and max is the max response time in seconds. For max values in the top 25% of the range have a red background and in the bottom 25% of the range have a green background. The red background is not used when the min value is within 80% of the max value.
| dbms | 256us | 1ms | 4ms | 16ms | 64ms | 256ms | 1s | 4s | 16s | gt | max |
|---|---|---|---|---|---|---|---|---|---|---|---|
| fbmy5635_rel_withdbg.cay9c1g | 7.016 | 92.951 | 0.032 | 0.001 | 0.014 | ||||||
| fbmy5635_rel_o2.cay9c1g | 6.676 | 93.299 | 0.025 | 0.001 | 0.015 | ||||||
| fbmy5635_rel.cay9c1g | 7.758 | 92.211 | 0.030 | 0.001 | nonzero | 0.021 |
Insert response time histogram: each cell has the percentage of responses that take <= the time in the header and max is the max response time in seconds. For max values in the top 25% of the range have a red background and in the bottom 25% of the range have a green background. The red background is not used when the min value is within 80% of the max value.
| dbms | 256us | 1ms | 4ms | 16ms | 64ms | 256ms | 1s | 4s | 16s | gt | max |
|---|---|---|---|---|---|---|---|---|---|---|---|
| fbmy5635_rel_withdbg.cay9c1g | 97.975 | 2.007 | 0.018 | 0.047 | |||||||
| fbmy5635_rel_o2.cay9c1g | 98.236 | 1.747 | 0.017 | 0.047 | |||||||
| fbmy5635_rel.cay9c1g | 97.893 | 2.090 | 0.017 | 0.046 |
Performance metrics for the DBMS listed above. Some are normalized by throughput, others are not. Legend for results is here.
ips	qps	rps	rmbps	wps	wmbps	rpq	rkbpq	wpi	wkbpi	csps	cpups	cspq	cpupq	dbgb1	dbgb2	rss	maxop	p50	p99	tag
1993	10153	0	0.0	8.2	2.1	0.000	0.000	0.004	1.103	37980	51.2	3.741	403	3.1	3.5	1.4	0.014	2493	2222	20m.fbmy5635_rel_withdbg.cay9c1g
1994	10119	0	0.0	7.0	1.7	0.000	0.000	0.003	0.854	37914	51.0	3.747	403	3.2	3.5	1.4	0.015	2509	2206	20m.fbmy5635_rel_o2.cay9c1g
1994	10269	0	0.0	7.8	2.0	0.000	0.000	0.004	1.014	38467	51.1	3.746	398	3.2	3.5	1.4	0.021	2557	2238	20m.fbmy5635_rel.cay9c1g
q1000.1
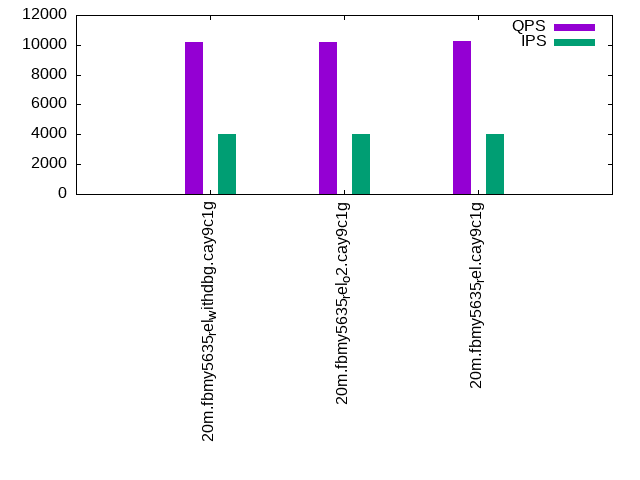
q1000.1: range queries with 1000 insert/s per client. Graphs for performance per 1-second interval are here.
Average throughput:
Query response time histogram: each cell has the percentage of responses that take <= the time in the header and max is the max response time in seconds. For max values in the top 25% of the range have a red background and in the bottom 25% of the range have a green background. The red background is not used when the min value is within 80% of the max value.
| dbms | 256us | 1ms | 4ms | 16ms | 64ms | 256ms | 1s | 4s | 16s | gt | max |
|---|---|---|---|---|---|---|---|---|---|---|---|
| fbmy5635_rel_withdbg.cay9c1g | 5.737 | 94.186 | 0.073 | 0.004 | nonzero | 0.023 | |||||
| fbmy5635_rel_o2.cay9c1g | 5.197 | 94.726 | 0.073 | 0.004 | nonzero | 0.028 | |||||
| fbmy5635_rel.cay9c1g | 6.203 | 93.716 | 0.077 | 0.004 | nonzero | 0.018 |
Insert response time histogram: each cell has the percentage of responses that take <= the time in the header and max is the max response time in seconds. For max values in the top 25% of the range have a red background and in the bottom 25% of the range have a green background. The red background is not used when the min value is within 80% of the max value.
| dbms | 256us | 1ms | 4ms | 16ms | 64ms | 256ms | 1s | 4s | 16s | gt | max |
|---|---|---|---|---|---|---|---|---|---|---|---|
| fbmy5635_rel_withdbg.cay9c1g | 86.729 | 13.212 | 0.058 | 0.051 | |||||||
| fbmy5635_rel_o2.cay9c1g | 87.367 | 12.565 | 0.069 | 0.048 | |||||||
| fbmy5635_rel.cay9c1g | 93.808 | 6.151 | 0.042 | 0.056 |
Performance metrics for the DBMS listed above. Some are normalized by throughput, others are not. Legend for results is here.
ips	qps	rps	rmbps	wps	wmbps	rpq	rkbpq	wpi	wkbpi	csps	cpups	cspq	cpupq	dbgb1	dbgb2	rss	maxop	p50	p99	tag
3989	10201	0	0.0	15.0	4.9	0.000	0.000	0.004	1.263	37274	53.2	3.654	417	3.9	5.2	1.4	0.023	2493	2190	20m.fbmy5635_rel_withdbg.cay9c1g
3989	10196	0	0.0	16.1	5.3	0.000	0.000	0.004	1.373	36917	53.6	3.621	421	3.7	4.9	1.4	0.028	2525	2205	20m.fbmy5635_rel_o2.cay9c1g
3989	10270	0	0.0	15.4	5.0	0.000	0.000	0.004	1.290	37504	53.3	3.652	415	3.7	4.9	1.4	0.018	2509	2207	20m.fbmy5635_rel.cay9c1g
l.i0
l.i0: load without secondary indexes
Performance metrics for all DBMS, not just the ones listed above. Some are normalized by throughput, others are not. Legend for results is here.
ips	qps	rps	rmbps	wps	wmbps	rpq	rkbpq	wpi	wkbpi	csps	cpups	cspq	cpupq	dbgb1	dbgb2	rss	maxop	p50	p99	tag
194175	0	0	0.0	122.0	51.3	0.000	0.000	0.001	0.271	20093	72.5	0.103	30	0.9	1.9	0.4	0.103	54541	18680	20m.fbmy5635_rel_withdbg.cay9c1g
192308	0	0	0.0	124.2	52.3	0.000	0.000	0.001	0.278	19892	73.4	0.103	31	0.8	1.8	0.4	0.114	52741	23474	20m.fbmy5635_rel_o2.cay9c1g
198020	0	0	0.0	122.2	51.5	0.000	0.000	0.001	0.267	20134	72.1	0.102	29	0.9	1.9	0.4	0.107	55157	22284	20m.fbmy5635_rel.cay9c1g
l.x
l.x: create secondary indexes
Performance metrics for all DBMS, not just the ones listed above. Some are normalized by throughput, others are not. Legend for results is here.
ips	qps	rps	rmbps	wps	wmbps	rpq	rkbpq	wpi	wkbpi	csps	cpups	cspq	cpupq	dbgb1	dbgb2	rss	maxop	p50	p99	tag
295588	0	1	0.0	128.8	54.1	0.000	0.000	0.000	0.187	614	49.1	0.002	13	1.4	2.4	1.5	0.008	NA	NA	20m.fbmy5635_rel_withdbg.cay9c1g
261039	0	1	0.0	108.6	45.6	0.000	0.000	0.000	0.179	546	48.0	0.002	15	1.4	2.5	1.5	0.024	NA	NA	20m.fbmy5635_rel_o2.cay9c1g
295588	0	1	0.0	131.8	55.7	0.000	0.000	0.000	0.193	656	48.6	0.002	13	1.4	2.4	1.6	0.003	NA	NA	20m.fbmy5635_rel.cay9c1g
l.i1
l.i1: continue load after secondary indexes created
Performance metrics for all DBMS, not just the ones listed above. Some are normalized by throughput, others are not. Legend for results is here.
ips	qps	rps	rmbps	wps	wmbps	rpq	rkbpq	wpi	wkbpi	csps	cpups	cspq	cpupq	dbgb1	dbgb2	rss	maxop	p50	p99	tag
91743	0	10	1.2	172.7	69.7	0.000	0.014	0.002	0.778	20098	74.1	0.219	65	4.7	6.5	1.4	0.117	23583	18080	20m.fbmy5635_rel_withdbg.cay9c1g
90909	0	11	1.4	169.8	68.6	0.000	0.016	0.002	0.773	19744	75.2	0.217	66	3.5	5.3	1.3	0.110	23474	17388	20m.fbmy5635_rel_o2.cay9c1g
92592	0	12	1.5	173.4	69.9	0.000	0.017	0.002	0.773	20258	73.9	0.219	64	4.3	6.0	1.3	0.108	23931	17836	20m.fbmy5635_rel.cay9c1g
q100.1
q100.1: range queries with 100 insert/s per client
Performance metrics for all DBMS, not just the ones listed above. Some are normalized by throughput, others are not. Legend for results is here.
ips	qps	rps	rmbps	wps	wmbps	rpq	rkbpq	wpi	wkbpi	csps	cpups	cspq	cpupq	dbgb1	dbgb2	rss	maxop	p50	p99	tag
399	10427	23	0.3	8.0	2.0	0.002	0.026	0.020	5.167	39156	50.6	3.755	388	2.8	4.7	1.3	0.015	2589	2269	20m.fbmy5635_rel_withdbg.cay9c1g
399	10308	17	0.2	7.7	1.9	0.002	0.023	0.019	4.756	38726	50.5	3.757	392	2.8	4.7	1.4	0.013	2525	2285	20m.fbmy5635_rel_o2.cay9c1g
399	10514	17	0.2	7.9	1.9	0.002	0.023	0.020	4.992	39547	50.6	3.762	385	2.8	4.7	1.4	0.012	2637	2253	20m.fbmy5635_rel.cay9c1g
q500.1
q500.1: range queries with 500 insert/s per client
Performance metrics for all DBMS, not just the ones listed above. Some are normalized by throughput, others are not. Legend for results is here.
ips	qps	rps	rmbps	wps	wmbps	rpq	rkbpq	wpi	wkbpi	csps	cpups	cspq	cpupq	dbgb1	dbgb2	rss	maxop	p50	p99	tag
1993	10153	0	0.0	8.2	2.1	0.000	0.000	0.004	1.103	37980	51.2	3.741	403	3.1	3.5	1.4	0.014	2493	2222	20m.fbmy5635_rel_withdbg.cay9c1g
1994	10119	0	0.0	7.0	1.7	0.000	0.000	0.003	0.854	37914	51.0	3.747	403	3.2	3.5	1.4	0.015	2509	2206	20m.fbmy5635_rel_o2.cay9c1g
1994	10269	0	0.0	7.8	2.0	0.000	0.000	0.004	1.014	38467	51.1	3.746	398	3.2	3.5	1.4	0.021	2557	2238	20m.fbmy5635_rel.cay9c1g
q1000.1
q1000.1: range queries with 1000 insert/s per client
Performance metrics for all DBMS, not just the ones listed above. Some are normalized by throughput, others are not. Legend for results is here.
ips	qps	rps	rmbps	wps	wmbps	rpq	rkbpq	wpi	wkbpi	csps	cpups	cspq	cpupq	dbgb1	dbgb2	rss	maxop	p50	p99	tag
3989	10201	0	0.0	15.0	4.9	0.000	0.000	0.004	1.263	37274	53.2	3.654	417	3.9	5.2	1.4	0.023	2493	2190	20m.fbmy5635_rel_withdbg.cay9c1g
3989	10196	0	0.0	16.1	5.3	0.000	0.000	0.004	1.373	36917	53.6	3.621	421	3.7	4.9	1.4	0.028	2525	2205	20m.fbmy5635_rel_o2.cay9c1g
3989	10270	0	0.0	15.4	5.0	0.000	0.000	0.004	1.290	37504	53.3	3.652	415	3.7	4.9	1.4	0.018	2509	2207	20m.fbmy5635_rel.cay9c1g
l.i0
- l.i0: load without secondary indexes
- Legend for results is here.
- Each entry lists the percentage of responses that fit in that bucket (slower than max time for previous bucket, faster than min time for next bucket).
Insert response time histogram
256us	1ms	4ms	16ms	64ms	256ms	1s	4s	16s	gt	max	tag
0.000	0.000	99.763	0.220	0.005	0.013	0.000	0.000	0.000	0.000	0.103	fbmy5635_rel_withdbg.cay9c1g
0.000	0.000	99.764	0.219	0.003	0.013	0.000	0.000	0.000	0.000	0.114	fbmy5635_rel_o2.cay9c1g
0.000	0.000	99.749	0.237	0.001	0.013	0.000	0.000	0.000	0.000	0.107	fbmy5635_rel.cay9c1g
l.x
- l.x: create secondary indexes
- Legend for results is here.
- Each entry lists the percentage of responses that fit in that bucket (slower than max time for previous bucket, faster than min time for next bucket).
TODO - determine whether there is data for create index response time
l.i1
- l.i1: continue load after secondary indexes created
- Legend for results is here.
- Each entry lists the percentage of responses that fit in that bucket (slower than max time for previous bucket, faster than min time for next bucket).
Insert response time histogram
256us	1ms	4ms	16ms	64ms	256ms	1s	4s	16s	gt	max	tag
0.000	0.000	99.594	0.392	0.007	0.007	0.000	0.000	0.000	0.000	0.117	fbmy5635_rel_withdbg.cay9c1g
0.000	0.000	99.607	0.386	nonzero	0.007	0.000	0.000	0.000	0.000	0.110	fbmy5635_rel_o2.cay9c1g
0.000	0.000	99.611	0.379	0.004	0.007	0.000	0.000	0.000	0.000	0.108	fbmy5635_rel.cay9c1g
q100.1
- q100.1: range queries with 100 insert/s per client
- Legend for results is here.
- Each entry lists the percentage of responses that fit in that bucket (slower than max time for previous bucket, faster than min time for next bucket).
Query response time histogram
256us	1ms	4ms	16ms	64ms	256ms	1s	4s	16s	gt	max	tag
9.002	90.991	0.006	0.001	0.000	0.000	0.000	0.000	0.000	0.000	0.015	fbmy5635_rel_withdbg.cay9c1g
8.532	91.462	0.006	0.001	0.000	0.000	0.000	0.000	0.000	0.000	0.013	fbmy5635_rel_o2.cay9c1g
10.299	89.693	0.007	0.001	0.000	0.000	0.000	0.000	0.000	0.000	0.012	fbmy5635_rel.cay9c1g
Insert response time histogram
256us	1ms	4ms	16ms	64ms	256ms	1s	4s	16s	gt	max	tag
0.000	0.000	99.347	0.590	0.062	0.000	0.000	0.000	0.000	0.000	0.035	fbmy5635_rel_withdbg.cay9c1g
0.000	0.000	99.424	0.562	0.014	0.000	0.000	0.000	0.000	0.000	0.028	fbmy5635_rel_o2.cay9c1g
0.000	0.000	99.493	0.507	0.000	0.000	0.000	0.000	0.000	0.000	0.011	fbmy5635_rel.cay9c1g
q500.1
- q500.1: range queries with 500 insert/s per client
- Legend for results is here.
- Each entry lists the percentage of responses that fit in that bucket (slower than max time for previous bucket, faster than min time for next bucket).
Query response time histogram
256us	1ms	4ms	16ms	64ms	256ms	1s	4s	16s	gt	max	tag
7.016	92.951	0.032	0.001	0.000	0.000	0.000	0.000	0.000	0.000	0.014	fbmy5635_rel_withdbg.cay9c1g
6.676	93.299	0.025	0.001	0.000	0.000	0.000	0.000	0.000	0.000	0.015	fbmy5635_rel_o2.cay9c1g
7.758	92.211	0.030	0.001	nonzero	0.000	0.000	0.000	0.000	0.000	0.021	fbmy5635_rel.cay9c1g
Insert response time histogram
256us	1ms	4ms	16ms	64ms	256ms	1s	4s	16s	gt	max	tag
0.000	0.000	97.975	2.007	0.018	0.000	0.000	0.000	0.000	0.000	0.047	fbmy5635_rel_withdbg.cay9c1g
0.000	0.000	98.236	1.747	0.017	0.000	0.000	0.000	0.000	0.000	0.047	fbmy5635_rel_o2.cay9c1g
0.000	0.000	97.893	2.090	0.017	0.000	0.000	0.000	0.000	0.000	0.046	fbmy5635_rel.cay9c1g
q1000.1
- q1000.1: range queries with 1000 insert/s per client
- Legend for results is here.
- Each entry lists the percentage of responses that fit in that bucket (slower than max time for previous bucket, faster than min time for next bucket).
Query response time histogram
256us	1ms	4ms	16ms	64ms	256ms	1s	4s	16s	gt	max	tag
5.737	94.186	0.073	0.004	nonzero	0.000	0.000	0.000	0.000	0.000	0.023	fbmy5635_rel_withdbg.cay9c1g
5.197	94.726	0.073	0.004	nonzero	0.000	0.000	0.000	0.000	0.000	0.028	fbmy5635_rel_o2.cay9c1g
6.203	93.716	0.077	0.004	nonzero	0.000	0.000	0.000	0.000	0.000	0.018	fbmy5635_rel.cay9c1g
Insert response time histogram
256us	1ms	4ms	16ms	64ms	256ms	1s	4s	16s	gt	max	tag
0.000	0.000	86.729	13.212	0.058	0.000	0.000	0.000	0.000	0.000	0.051	fbmy5635_rel_withdbg.cay9c1g
0.000	0.000	87.367	12.565	0.069	0.000	0.000	0.000	0.000	0.000	0.048	fbmy5635_rel_o2.cay9c1g
0.000	0.000	93.808	6.151	0.042	0.000	0.000	0.000	0.000	0.000	0.056	fbmy5635_rel.cay9c1g