Introduction
This is a report for the insert benchmark with 20M docs and 1 client(s). It is generated by scripts (bash, awk, sed) and Tufte might not be impressed. An overview of the insert benchmark is here and a short update is here. Below, by DBMS, I mean DBMS+version.config. An example is my8020.c10b40 where my means MySQL, 8020 is version 8.0.20 and c10b40 is the name for the configuration file.
The test server has 8 AMD cores, 16G RAM and an NVMe SSD. It is described here as the Beelink. The benchmark was run with 1 client and there were 1 or 2 connections per client (1 for queries, 1 for inserts). The benchmark loads 20M rows without secondary indexes, creates secondary indexes, loads another 20M rows then does 3 read+write tests for one hour each that do queries as fast as possible with 100, 500 and then 1000 writes/second/client concurrent with the queries. There is one table per client. The database is cached by the storage engine and the only IO is for writes. Clients and the DBMS share one server. The per-database configs are in the per-database subdirectories here.
The tested DBMS are:
- fbmy8028_rel_withdbg.cay9c - MyRocks 8.0.28, the cay9c config and compiled with CMAKE_BUILD_TYPE=RelWithDebInfo and -O2
- fbmy8028_rel.cay9c - MyRocks 8.0.28, the cay9c config and compiled with CMAKE_BUILD_TYPE=Release and -O3
- fbmy8028_rel_o2.cay9c - MyRocks 8.0.28, the cay9c config and compiled with CMAKE_BUILD_TYPE=Release and -O2
- fbmy8028_rel_native.cay9c - MyRocks 8.0.28, the cay9c config and compiled with CMAKE_BUILD_TYPE=Release and -O3 -march=native -mtune=native
- fbmy8028_rel_o2_lto.cay9c - MyRocks 8.0.28, the cay9c config and compiled with CMAKE_BUILD_TYPE=Release and -O2 -flto
- fbmy8028_rel_lto.cay9c - MyRocks 8.0.28, the cay9c config and compiled with CMAKE_BUILD_TYPE=Release and -O3 -flto
- fbmy8028_rel_native_lto.cay9c - MyRocks 8.0.28, the cay9c config and compiled with CMAKE_BUILD_TYPE=Release and -O3 -flto -march=native -mtune=native
Contents
- Summary
- l.i0: load without secondary indexes
- l.x: create secondary indexes
- l.i1: continue load after secondary indexes created
- q100.1: range queries with 100 insert/s per client
- q500.1: range queries with 500 insert/s per client
- q1000.1: range queries with 1000 insert/s per client
Summary
The numbers are inserts/s for l.i0 and l.i1, indexed docs (or rows) /s for l.x and queries/s for q*.2. The values are the average rate over the entire test for inserts (IPS) and queries (QPS). The range of values for IPS and QPS is split into 3 parts: bottom 25%, middle 50%, top 25%. Values in the bottom 25% have a red background, values in the top 25% have a green background and values in the middle have no color. A gray background is used for values that can be ignored because the DBMS did not sustain the target insert rate. Red backgrounds are not used when the minimum value is within 80% of the max value.
| dbms | l.i0 | l.x | l.i1 | q100.1 | q500.1 | q1000.1 |
|---|---|---|---|---|---|---|
| 20m.fbmy8028_rel_withdbg.cay9c | 56980 | 65472 | 24067 | 2320 | 2280 | 2237 |
| 20m.fbmy8028_rel.cay9c | 57803 | 73626 | 24184 | 2321 | 2298 | 2300 |
| 20m.fbmy8028_rel_o2.cay9c | 57637 | 65472 | 24242 | 2310 | 2266 | 2282 |
| 20m.fbmy8028_rel_native.cay9c | 56818 | 73626 | 23952 | 2332 | 2251 | 2194 |
| 20m.fbmy8028_rel_o2_lto.cay9c | 58651 | 66118 | 24510 | 2356 | 2274 | 2304 |
| 20m.fbmy8028_rel_lto.cay9c | 60790 | 75281 | 25510 | 2414 | 2374 | 2269 |
| 20m.fbmy8028_rel_native_lto.cay9c | 61538 | 77907 | 25740 | 2459 | 2352 | 2348 |
This table has relative throughput, throughput for the DBMS relative to the DBMS in the first line, using the absolute throughput from the previous table.
| dbms | l.i0 | l.x | l.i1 | q100.1 | q500.1 | q1000.1 |
|---|---|---|---|---|---|---|
| 20m.fbmy8028_rel_withdbg.cay9c | 1.00 | 1.00 | 1.00 | 1.00 | 1.00 | 1.00 |
| 20m.fbmy8028_rel.cay9c | 1.01 | 1.12 | 1.00 | 1.00 | 1.01 | 1.03 |
| 20m.fbmy8028_rel_o2.cay9c | 1.01 | 1.00 | 1.01 | 1.00 | 0.99 | 1.02 |
| 20m.fbmy8028_rel_native.cay9c | 1.00 | 1.12 | 1.00 | 1.01 | 0.99 | 0.98 |
| 20m.fbmy8028_rel_o2_lto.cay9c | 1.03 | 1.01 | 1.02 | 1.02 | 1.00 | 1.03 |
| 20m.fbmy8028_rel_lto.cay9c | 1.07 | 1.15 | 1.06 | 1.04 | 1.04 | 1.01 |
| 20m.fbmy8028_rel_native_lto.cay9c | 1.08 | 1.19 | 1.07 | 1.06 | 1.03 | 1.05 |
This lists the average rate of inserts/s for the tests that do inserts concurrent with queries. For such tests the query rate is listed in the table above. The read+write tests are setup so that the insert rate should match the target rate every second. Cells that are not at least 95% of the target have a red background to indicate a failure to satisfy the target.
| dbms | q100.1 | q500.1 | q1000.1 |
|---|---|---|---|
| fbmy8028_rel_withdbg.cay9c | 100 | 499 | 998 |
| fbmy8028_rel.cay9c | 100 | 499 | 998 |
| fbmy8028_rel_o2.cay9c | 100 | 499 | 998 |
| fbmy8028_rel_native.cay9c | 100 | 499 | 998 |
| fbmy8028_rel_o2_lto.cay9c | 100 | 499 | 998 |
| fbmy8028_rel_lto.cay9c | 100 | 499 | 998 |
| fbmy8028_rel_native_lto.cay9c | 100 | 499 | 998 |
| target | 100 | 500 | 1000 |
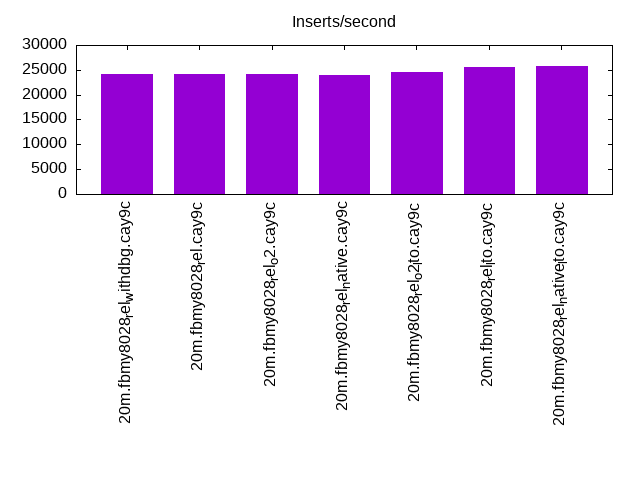
l.i0
l.i0: load without secondary indexes. Graphs for performance per 1-second interval are here.
Average throughput:

Insert response time histogram: each cell has the percentage of responses that take <= the time in the header and max is the max response time in seconds. For the max column values in the top 25% of the range have a red background and in the bottom 25% of the range have a green background. The red background is not used when the min value is within 80% of the max value.
| dbms | 256us | 1ms | 4ms | 16ms | 64ms | 256ms | 1s | 4s | 16s | gt | max |
|---|---|---|---|---|---|---|---|---|---|---|---|
| fbmy8028_rel_withdbg.cay9c | 99.722 | 0.200 | 0.074 | 0.003 | 0.099 | ||||||
| fbmy8028_rel.cay9c | 99.725 | 0.197 | 0.075 | 0.003 | 0.081 | ||||||
| fbmy8028_rel_o2.cay9c | 99.723 | 0.203 | 0.071 | 0.003 | 0.080 | ||||||
| fbmy8028_rel_native.cay9c | 99.720 | 0.204 | 0.073 | 0.003 | 0.079 | ||||||
| fbmy8028_rel_o2_lto.cay9c | 99.725 | 0.200 | 0.071 | 0.003 | 0.093 | ||||||
| fbmy8028_rel_lto.cay9c | 99.731 | 0.195 | 0.072 | 0.002 | 0.080 | ||||||
| fbmy8028_rel_native_lto.cay9c | 99.734 | 0.194 | 0.069 | 0.003 | 0.078 |
Performance metrics for the DBMS listed above. Some are normalized by throughput, others are not. Legend for results is here.
ips	qps	rps	rmbps	wps	wmbps	rpq	rkbpq	wpi	wkbpi	csps	cpups	cspq	cpupq	dbgb1	dbgb2	rss	maxop	p50	p99	tag
56980	0	0	0.0	34.7	11.1	0.000	0.000	0.001	0.200	5940	22.5	0.104	32	0.7	1.9	0.6	0.099	57135	51441	20m.fbmy8028_rel_withdbg.cay9c
57803	0	0	0.0	35.0	11.3	0.000	0.000	0.001	0.200	6015	22.6	0.104	31	0.7	1.9	0.6	0.081	58034	52043	20m.fbmy8028_rel.cay9c
57637	0	0	0.0	34.9	11.2	0.000	0.000	0.001	0.199	5974	22.6	0.104	31	0.7	1.9	0.6	0.080	58033	50942	20m.fbmy8028_rel_o2.cay9c
56818	0	0	0.0	34.4	11.1	0.000	0.000	0.001	0.200	5910	22.3	0.104	31	0.7	1.9	0.6	0.079	57037	51693	20m.fbmy8028_rel_native.cay9c
58651	0	0	0.0	35.7	11.5	0.000	0.000	0.001	0.200	6080	22.9	0.104	31	0.7	1.9	0.6	0.093	58935	51442	20m.fbmy8028_rel_o2_lto.cay9c
60790	0	0	0.0	36.8	11.8	0.000	0.000	0.001	0.199	6292	22.4	0.104	29	0.7	1.9	0.6	0.080	61132	55634	20m.fbmy8028_rel_lto.cay9c
61538	0	0	0.0	36.9	12.0	0.000	0.000	0.001	0.199	6369	22.7	0.104	30	0.7	1.9	0.6	0.078	62029	55439	20m.fbmy8028_rel_native_lto.cay9c
l.x
l.x: create secondary indexes.
Average throughput:
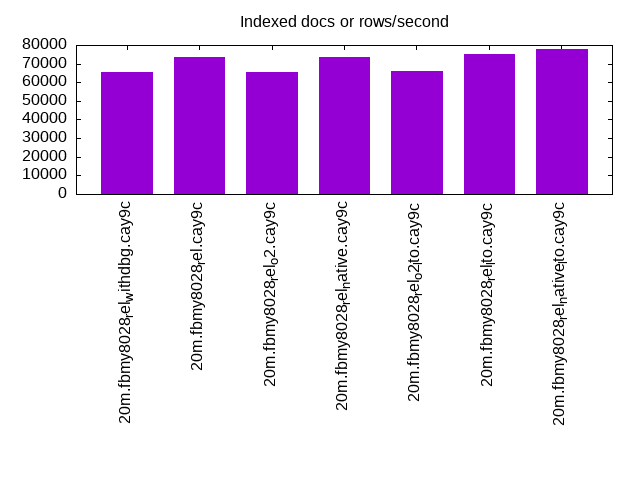
Performance metrics for the DBMS listed above. Some are normalized by throughput, others are not. Legend for results is here.
ips	qps	rps	rmbps	wps	wmbps	rpq	rkbpq	wpi	wkbpi	csps	cpups	cspq	cpupq	dbgb1	dbgb2	rss	maxop	p50	p99	tag
65472	0	0	0.0	25.4	10.0	0.000	0.000	0.000	0.156	389	12.8	0.006	16	1.4	2.7	1.9	0.009	NA	NA	20m.fbmy8028_rel_withdbg.cay9c
73626	0	0	0.0	28.3	11.1	0.000	0.000	0.000	0.155	377	12.7	0.005	14	1.4	2.7	1.9	0.012	NA	NA	20m.fbmy8028_rel.cay9c
65472	0	0	0.0	25.5	10.0	0.000	0.000	0.000	0.156	389	12.8	0.006	16	1.4	2.7	1.9	0.009	NA	NA	20m.fbmy8028_rel_o2.cay9c
73626	0	0	0.0	28.4	11.2	0.000	0.000	0.000	0.155	376	12.8	0.005	14	1.4	2.7	1.9	0.014	NA	NA	20m.fbmy8028_rel_native.cay9c
66118	0	0	0.0	25.5	10.0	0.000	0.000	0.000	0.155	359	12.8	0.005	15	1.4	2.7	1.9	0.008	NA	NA	20m.fbmy8028_rel_o2_lto.cay9c
75281	0	0	0.0	29.1	11.4	0.000	0.000	0.000	0.156	386	12.8	0.005	14	1.4	2.7	1.9	0.027	NA	NA	20m.fbmy8028_rel_lto.cay9c
77907	0	0	0.0	30.0	11.9	0.000	0.000	0.000	0.156	410	12.7	0.005	13	1.4	2.7	1.9	0.009	NA	NA	20m.fbmy8028_rel_native_lto.cay9c
l.i1
l.i1: continue load after secondary indexes created. Graphs for performance per 1-second interval are here.
Average throughput:
Insert response time histogram: each cell has the percentage of responses that take <= the time in the header and max is the max response time in seconds. For the max column values in the top 25% of the range have a red background and in the bottom 25% of the range have a green background. The red background is not used when the min value is within 80% of the max value.
| dbms | 256us | 1ms | 4ms | 16ms | 64ms | 256ms | 1s | 4s | 16s | gt | max |
|---|---|---|---|---|---|---|---|---|---|---|---|
| fbmy8028_rel_withdbg.cay9c | 99.737 | 0.225 | 0.038 | 0.063 | |||||||
| fbmy8028_rel.cay9c | 99.737 | 0.224 | 0.038 | nonzero | 0.076 | ||||||
| fbmy8028_rel_o2.cay9c | 99.740 | 0.221 | 0.039 | 0.001 | 0.075 | ||||||
| fbmy8028_rel_native.cay9c | 99.731 | 0.229 | 0.039 | 0.001 | 0.074 | ||||||
| fbmy8028_rel_o2_lto.cay9c | 99.740 | 0.221 | 0.039 | nonzero | 0.074 | ||||||
| fbmy8028_rel_lto.cay9c | 99.749 | 0.211 | 0.039 | 0.001 | 0.074 | ||||||
| fbmy8028_rel_native_lto.cay9c | 99.751 | 0.211 | 0.037 | 0.001 | 0.074 |
Performance metrics for the DBMS listed above. Some are normalized by throughput, others are not. Legend for results is here.
ips	qps	rps	rmbps	wps	wmbps	rpq	rkbpq	wpi	wkbpi	csps	cpups	cspq	cpupq	dbgb1	dbgb2	rss	maxop	p50	p99	tag
24067	0	7	0.9	63.3	24.8	0.000	0.038	0.003	1.055	5352	27.2	0.222	90	2.8	4.7	2.6	0.063	23873	21525	20m.fbmy8028_rel_withdbg.cay9c
24184	0	7	0.9	62.8	24.7	0.000	0.038	0.003	1.046	5356	26.9	0.221	89	3.1	5.0	2.6	0.076	23974	21536	20m.fbmy8028_rel.cay9c
24242	0	7	0.9	62.2	24.6	0.000	0.038	0.003	1.041	5380	26.9	0.222	89	2.8	4.8	2.5	0.075	24073	21391	20m.fbmy8028_rel_o2.cay9c
23952	0	7	0.9	63.0	24.6	0.000	0.038	0.003	1.053	5307	26.8	0.222	90	3.1	5.0	2.6	0.074	23673	21226	20m.fbmy8028_rel_native.cay9c
24510	0	7	0.9	63.4	25.0	0.000	0.038	0.003	1.044	5424	27.4	0.221	89	3.0	4.9	2.6	0.074	24422	21626	20m.fbmy8028_rel_o2_lto.cay9c
25510	0	8	0.9	66.0	26.2	0.000	0.038	0.003	1.053	5610	27.0	0.220	85	3.1	5.0	2.6	0.074	25322	22674	20m.fbmy8028_rel_lto.cay9c
25740	0	8	1.0	67.9	26.5	0.000	0.038	0.003	1.054	5712	27.2	0.222	85	3.0	4.9	2.6	0.074	25672	22525	20m.fbmy8028_rel_native_lto.cay9c
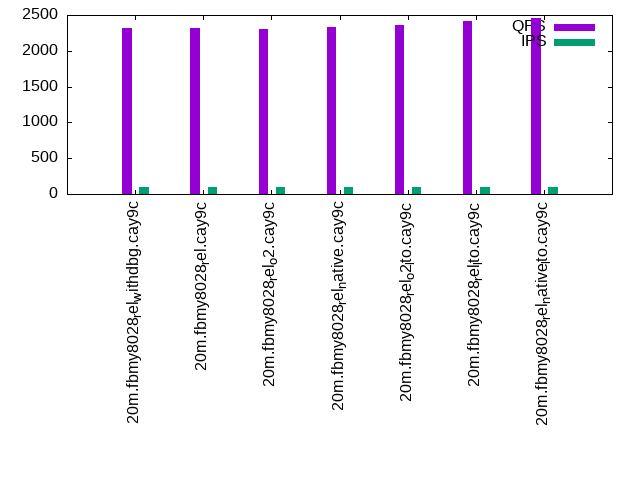
q100.1
q100.1: range queries with 100 insert/s per client. Graphs for performance per 1-second interval are here.
Average throughput:
Query response time histogram: each cell has the percentage of responses that take <= the time in the header and max is the max response time in seconds. For max values in the top 25% of the range have a red background and in the bottom 25% of the range have a green background. The red background is not used when the min value is within 80% of the max value.
| dbms | 256us | 1ms | 4ms | 16ms | 64ms | 256ms | 1s | 4s | 16s | gt | max |
|---|---|---|---|---|---|---|---|---|---|---|---|
| fbmy8028_rel_withdbg.cay9c | 0.661 | 99.338 | nonzero | nonzero | 0.007 | ||||||
| fbmy8028_rel.cay9c | 0.924 | 99.076 | nonzero | 0.003 | |||||||
| fbmy8028_rel_o2.cay9c | 0.420 | 99.580 | nonzero | 0.004 | |||||||
| fbmy8028_rel_native.cay9c | 0.626 | 99.374 | nonzero | 0.001 | |||||||
| fbmy8028_rel_o2_lto.cay9c | 1.109 | 98.891 | nonzero | 0.003 | |||||||
| fbmy8028_rel_lto.cay9c | 2.028 | 97.972 | nonzero | 0.003 | |||||||
| fbmy8028_rel_native_lto.cay9c | 1.647 | 98.353 | nonzero | 0.001 |
Insert response time histogram: each cell has the percentage of responses that take <= the time in the header and max is the max response time in seconds. For max values in the top 25% of the range have a red background and in the bottom 25% of the range have a green background. The red background is not used when the min value is within 80% of the max value.
| dbms | 256us | 1ms | 4ms | 16ms | 64ms | 256ms | 1s | 4s | 16s | gt | max |
|---|---|---|---|---|---|---|---|---|---|---|---|
| fbmy8028_rel_withdbg.cay9c | 99.389 | 0.583 | 0.028 | 0.018 | |||||||
| fbmy8028_rel.cay9c | 99.556 | 0.417 | 0.028 | 0.018 | |||||||
| fbmy8028_rel_o2.cay9c | 99.583 | 0.417 | 0.009 | ||||||||
| fbmy8028_rel_native.cay9c | 99.528 | 0.472 | 0.009 | ||||||||
| fbmy8028_rel_o2_lto.cay9c | 99.556 | 0.417 | 0.028 | 0.016 | |||||||
| fbmy8028_rel_lto.cay9c | 99.528 | 0.472 | 0.009 | ||||||||
| fbmy8028_rel_native_lto.cay9c | 99.556 | 0.417 | 0.028 | 0.018 |
Performance metrics for the DBMS listed above. Some are normalized by throughput, others are not. Legend for results is here.
ips	qps	rps	rmbps	wps	wmbps	rpq	rkbpq	wpi	wkbpi	csps	cpups	cspq	cpupq	dbgb1	dbgb2	rss	maxop	p50	p99	tag
100	2320	0	0.0	3.4	0.1	0.000	0.000	0.034	0.869	9125	13.4	3.934	462	2.8	4.8	4.4	0.007	2285	2078	20m.fbmy8028_rel_withdbg.cay9c
100	2321	0	0.0	3.5	0.1	0.000	0.000	0.036	1.312	9124	13.4	3.930	462	2.8	4.8	4.4	0.003	2269	2061	20m.fbmy8028_rel.cay9c
100	2310	0	0.0	3.7	0.2	0.000	0.000	0.038	2.002	9082	13.4	3.932	464	2.8	4.7	4.3	0.004	2237	2046	20m.fbmy8028_rel_o2.cay9c
100	2332	0	0.0	4.0	0.3	0.000	0.000	0.041	2.957	9171	13.5	3.933	463	2.8	4.7	4.3	0.001	2317	2157	20m.fbmy8028_rel_native.cay9c
100	2356	0	0.0	3.8	0.2	0.000	0.000	0.038	2.388	9265	13.5	3.932	458	2.8	4.7	4.4	0.003	2303	2157	20m.fbmy8028_rel_o2_lto.cay9c
100	2414	0	0.0	3.6	0.1	0.000	0.000	0.036	1.398	9478	13.4	3.926	444	2.8	4.8	4.3	0.003	2365	2158	20m.fbmy8028_rel_lto.cay9c
100	2459	0	0.0	3.5	0.1	0.000	0.000	0.035	1.078	9656	13.4	3.926	436	2.8	4.8	4.4	0.001	2445	2221	20m.fbmy8028_rel_native_lto.cay9c
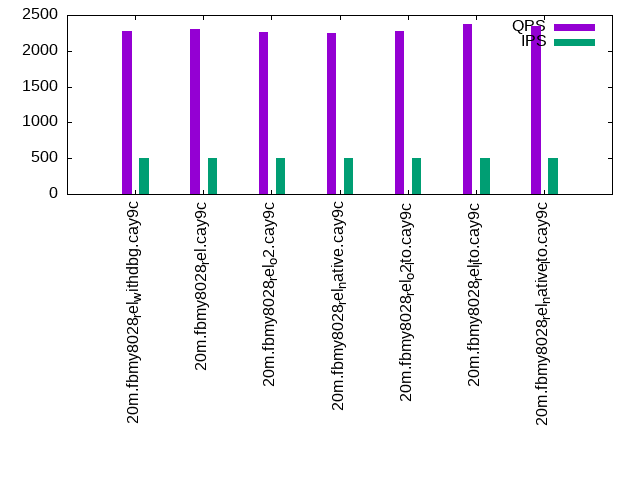
q500.1
q500.1: range queries with 500 insert/s per client. Graphs for performance per 1-second interval are here.
Average throughput:
Query response time histogram: each cell has the percentage of responses that take <= the time in the header and max is the max response time in seconds. For max values in the top 25% of the range have a red background and in the bottom 25% of the range have a green background. The red background is not used when the min value is within 80% of the max value.
| dbms | 256us | 1ms | 4ms | 16ms | 64ms | 256ms | 1s | 4s | 16s | gt | max |
|---|---|---|---|---|---|---|---|---|---|---|---|
| fbmy8028_rel_withdbg.cay9c | 0.199 | 99.801 | 0.001 | 0.002 | |||||||
| fbmy8028_rel.cay9c | 0.407 | 99.592 | 0.001 | 0.004 | |||||||
| fbmy8028_rel_o2.cay9c | 0.232 | 99.768 | 0.001 | 0.003 | |||||||
| fbmy8028_rel_native.cay9c | 0.306 | 99.694 | nonzero | 0.003 | |||||||
| fbmy8028_rel_o2_lto.cay9c | 0.431 | 99.568 | 0.001 | 0.003 | |||||||
| fbmy8028_rel_lto.cay9c | 1.152 | 98.847 | nonzero | 0.002 | |||||||
| fbmy8028_rel_native_lto.cay9c | 1.188 | 98.812 | nonzero | 0.003 |
Insert response time histogram: each cell has the percentage of responses that take <= the time in the header and max is the max response time in seconds. For max values in the top 25% of the range have a red background and in the bottom 25% of the range have a green background. The red background is not used when the min value is within 80% of the max value.
| dbms | 256us | 1ms | 4ms | 16ms | 64ms | 256ms | 1s | 4s | 16s | gt | max |
|---|---|---|---|---|---|---|---|---|---|---|---|
| fbmy8028_rel_withdbg.cay9c | 99.633 | 0.322 | 0.044 | 0.018 | |||||||
| fbmy8028_rel.cay9c | 99.600 | 0.356 | 0.044 | 0.023 | |||||||
| fbmy8028_rel_o2.cay9c | 99.606 | 0.350 | 0.044 | 0.018 | |||||||
| fbmy8028_rel_native.cay9c | 99.617 | 0.339 | 0.044 | 0.018 | |||||||
| fbmy8028_rel_o2_lto.cay9c | 99.672 | 0.289 | 0.039 | 0.023 | |||||||
| fbmy8028_rel_lto.cay9c | 99.633 | 0.322 | 0.044 | 0.019 | |||||||
| fbmy8028_rel_native_lto.cay9c | 99.633 | 0.322 | 0.044 | 0.018 |
Performance metrics for the DBMS listed above. Some are normalized by throughput, others are not. Legend for results is here.
ips	qps	rps	rmbps	wps	wmbps	rpq	rkbpq	wpi	wkbpi	csps	cpups	cspq	cpupq	dbgb1	dbgb2	rss	maxop	p50	p99	tag
499	2280	0	0.0	3.7	0.2	0.000	0.000	0.007	0.509	9053	13.7	3.970	481	2.9	5.0	4.6	0.002	2285	2013	20m.fbmy8028_rel_withdbg.cay9c
499	2298	0	0.0	3.7	0.3	0.000	0.000	0.007	0.529	9106	13.6	3.963	474	2.9	5.0	4.5	0.004	2301	2014	20m.fbmy8028_rel.cay9c
499	2266	0	0.0	3.7	0.3	0.000	0.000	0.007	0.571	8981	13.5	3.964	477	2.9	5.0	4.4	0.003	2237	2015	20m.fbmy8028_rel_o2.cay9c
499	2251	0	0.0	3.5	0.2	0.000	0.000	0.007	0.408	8924	13.5	3.964	480	2.9	5.0	4.5	0.003	2222	2014	20m.fbmy8028_rel_native.cay9c
499	2274	0	0.0	3.7	0.3	0.000	0.000	0.007	0.571	9014	13.6	3.964	479	2.9	5.0	4.6	0.003	2269	2046	20m.fbmy8028_rel_o2_lto.cay9c
499	2374	0	0.0	3.6	0.2	0.000	0.000	0.007	0.489	9394	13.5	3.957	455	2.9	5.0	4.5	0.002	2349	2125	20m.fbmy8028_rel_lto.cay9c
499	2352	0	0.0	3.7	0.2	0.000	0.000	0.007	0.509	9310	13.6	3.959	463	2.9	5.0	4.5	0.003	2318	2158	20m.fbmy8028_rel_native_lto.cay9c
q1000.1
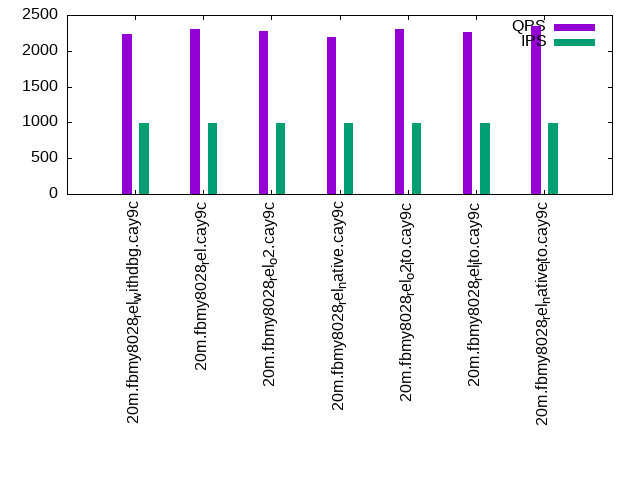
q1000.1: range queries with 1000 insert/s per client. Graphs for performance per 1-second interval are here.
Average throughput:
Query response time histogram: each cell has the percentage of responses that take <= the time in the header and max is the max response time in seconds. For max values in the top 25% of the range have a red background and in the bottom 25% of the range have a green background. The red background is not used when the min value is within 80% of the max value.
| dbms | 256us | 1ms | 4ms | 16ms | 64ms | 256ms | 1s | 4s | 16s | gt | max |
|---|---|---|---|---|---|---|---|---|---|---|---|
| fbmy8028_rel_withdbg.cay9c | 0.200 | 99.800 | 0.001 | 0.003 | |||||||
| fbmy8028_rel.cay9c | 0.479 | 99.519 | 0.002 | 0.003 | |||||||
| fbmy8028_rel_o2.cay9c | 0.253 | 99.746 | 0.001 | 0.004 | |||||||
| fbmy8028_rel_native.cay9c | 0.175 | 99.824 | nonzero | 0.001 | |||||||
| fbmy8028_rel_o2_lto.cay9c | 0.723 | 99.276 | 0.001 | nonzero | 0.004 | ||||||
| fbmy8028_rel_lto.cay9c | 0.575 | 99.425 | 0.001 | 0.003 | |||||||
| fbmy8028_rel_native_lto.cay9c | 1.182 | 98.818 | 0.001 | nonzero | 0.005 |
Insert response time histogram: each cell has the percentage of responses that take <= the time in the header and max is the max response time in seconds. For max values in the top 25% of the range have a red background and in the bottom 25% of the range have a green background. The red background is not used when the min value is within 80% of the max value.
| dbms | 256us | 1ms | 4ms | 16ms | 64ms | 256ms | 1s | 4s | 16s | gt | max |
|---|---|---|---|---|---|---|---|---|---|---|---|
| fbmy8028_rel_withdbg.cay9c | 99.628 | 0.336 | 0.036 | 0.023 | |||||||
| fbmy8028_rel.cay9c | 99.644 | 0.314 | 0.042 | 0.023 | |||||||
| fbmy8028_rel_o2.cay9c | 99.614 | 0.344 | 0.042 | 0.018 | |||||||
| fbmy8028_rel_native.cay9c | 99.642 | 0.314 | 0.044 | 0.018 | |||||||
| fbmy8028_rel_o2_lto.cay9c | 99.686 | 0.269 | 0.044 | 0.023 | |||||||
| fbmy8028_rel_lto.cay9c | 99.642 | 0.317 | 0.042 | 0.023 | |||||||
| fbmy8028_rel_native_lto.cay9c | 99.661 | 0.297 | 0.042 | 0.023 |
Performance metrics for the DBMS listed above. Some are normalized by throughput, others are not. Legend for results is here.
ips	qps	rps	rmbps	wps	wmbps	rpq	rkbpq	wpi	wkbpi	csps	cpups	cspq	cpupq	dbgb1	dbgb2	rss	maxop	p50	p99	tag
998	2237	0	0.0	6.2	1.2	0.000	0.000	0.006	1.275	8985	14.6	4.017	522	3.1	3.3	5.3	0.003	2237	1998	20m.fbmy8028_rel_withdbg.cay9c
998	2300	0	0.0	6.0	1.2	0.000	0.000	0.006	1.237	9226	14.7	4.010	511	3.1	3.4	5.9	0.003	2317	2014	20m.fbmy8028_rel.cay9c
998	2282	0	0.0	5.2	0.9	0.000	0.000	0.005	0.932	9149	14.5	4.009	508	3.1	3.4	5.1	0.004	2285	2014	20m.fbmy8028_rel_o2.cay9c
998	2194	0	0.0	5.3	0.9	0.000	0.000	0.005	0.930	8816	14.5	4.017	529	3.1	3.4	5.2	0.001	2157	1998	20m.fbmy8028_rel_native.cay9c
998	2304	0	0.0	5.3	0.9	0.000	0.000	0.005	0.893	9242	14.5	4.011	503	3.1	3.4	5.5	0.004	2269	2046	20m.fbmy8028_rel_o2_lto.cay9c
998	2269	0	0.0	6.1	1.3	0.000	0.000	0.006	1.300	9102	14.7	4.012	518	3.0	3.3	5.3	0.003	2253	2062	20m.fbmy8028_rel_lto.cay9c
998	2348	0	0.0	6.1	1.2	0.000	0.000	0.006	1.275	9404	14.5	4.006	494	3.1	3.4	5.3	0.005	2318	2142	20m.fbmy8028_rel_native_lto.cay9c
l.i0
l.i0: load without secondary indexes
Performance metrics for all DBMS, not just the ones listed above. Some are normalized by throughput, others are not. Legend for results is here.
ips	qps	rps	rmbps	wps	wmbps	rpq	rkbpq	wpi	wkbpi	csps	cpups	cspq	cpupq	dbgb1	dbgb2	rss	maxop	p50	p99	tag
56980	0	0	0.0	34.7	11.1	0.000	0.000	0.001	0.200	5940	22.5	0.104	32	0.7	1.9	0.6	0.099	57135	51441	20m.fbmy8028_rel_withdbg.cay9c
57803	0	0	0.0	35.0	11.3	0.000	0.000	0.001	0.200	6015	22.6	0.104	31	0.7	1.9	0.6	0.081	58034	52043	20m.fbmy8028_rel.cay9c
57637	0	0	0.0	34.9	11.2	0.000	0.000	0.001	0.199	5974	22.6	0.104	31	0.7	1.9	0.6	0.080	58033	50942	20m.fbmy8028_rel_o2.cay9c
56818	0	0	0.0	34.4	11.1	0.000	0.000	0.001	0.200	5910	22.3	0.104	31	0.7	1.9	0.6	0.079	57037	51693	20m.fbmy8028_rel_native.cay9c
58651	0	0	0.0	35.7	11.5	0.000	0.000	0.001	0.200	6080	22.9	0.104	31	0.7	1.9	0.6	0.093	58935	51442	20m.fbmy8028_rel_o2_lto.cay9c
60790	0	0	0.0	36.8	11.8	0.000	0.000	0.001	0.199	6292	22.4	0.104	29	0.7	1.9	0.6	0.080	61132	55634	20m.fbmy8028_rel_lto.cay9c
61538	0	0	0.0	36.9	12.0	0.000	0.000	0.001	0.199	6369	22.7	0.104	30	0.7	1.9	0.6	0.078	62029	55439	20m.fbmy8028_rel_native_lto.cay9c
l.x
l.x: create secondary indexes
Performance metrics for all DBMS, not just the ones listed above. Some are normalized by throughput, others are not. Legend for results is here.
ips	qps	rps	rmbps	wps	wmbps	rpq	rkbpq	wpi	wkbpi	csps	cpups	cspq	cpupq	dbgb1	dbgb2	rss	maxop	p50	p99	tag
65472	0	0	0.0	25.4	10.0	0.000	0.000	0.000	0.156	389	12.8	0.006	16	1.4	2.7	1.9	0.009	NA	NA	20m.fbmy8028_rel_withdbg.cay9c
73626	0	0	0.0	28.3	11.1	0.000	0.000	0.000	0.155	377	12.7	0.005	14	1.4	2.7	1.9	0.012	NA	NA	20m.fbmy8028_rel.cay9c
65472	0	0	0.0	25.5	10.0	0.000	0.000	0.000	0.156	389	12.8	0.006	16	1.4	2.7	1.9	0.009	NA	NA	20m.fbmy8028_rel_o2.cay9c
73626	0	0	0.0	28.4	11.2	0.000	0.000	0.000	0.155	376	12.8	0.005	14	1.4	2.7	1.9	0.014	NA	NA	20m.fbmy8028_rel_native.cay9c
66118	0	0	0.0	25.5	10.0	0.000	0.000	0.000	0.155	359	12.8	0.005	15	1.4	2.7	1.9	0.008	NA	NA	20m.fbmy8028_rel_o2_lto.cay9c
75281	0	0	0.0	29.1	11.4	0.000	0.000	0.000	0.156	386	12.8	0.005	14	1.4	2.7	1.9	0.027	NA	NA	20m.fbmy8028_rel_lto.cay9c
77907	0	0	0.0	30.0	11.9	0.000	0.000	0.000	0.156	410	12.7	0.005	13	1.4	2.7	1.9	0.009	NA	NA	20m.fbmy8028_rel_native_lto.cay9c
l.i1
l.i1: continue load after secondary indexes created
Performance metrics for all DBMS, not just the ones listed above. Some are normalized by throughput, others are not. Legend for results is here.
ips	qps	rps	rmbps	wps	wmbps	rpq	rkbpq	wpi	wkbpi	csps	cpups	cspq	cpupq	dbgb1	dbgb2	rss	maxop	p50	p99	tag
24067	0	7	0.9	63.3	24.8	0.000	0.038	0.003	1.055	5352	27.2	0.222	90	2.8	4.7	2.6	0.063	23873	21525	20m.fbmy8028_rel_withdbg.cay9c
24184	0	7	0.9	62.8	24.7	0.000	0.038	0.003	1.046	5356	26.9	0.221	89	3.1	5.0	2.6	0.076	23974	21536	20m.fbmy8028_rel.cay9c
24242	0	7	0.9	62.2	24.6	0.000	0.038	0.003	1.041	5380	26.9	0.222	89	2.8	4.8	2.5	0.075	24073	21391	20m.fbmy8028_rel_o2.cay9c
23952	0	7	0.9	63.0	24.6	0.000	0.038	0.003	1.053	5307	26.8	0.222	90	3.1	5.0	2.6	0.074	23673	21226	20m.fbmy8028_rel_native.cay9c
24510	0	7	0.9	63.4	25.0	0.000	0.038	0.003	1.044	5424	27.4	0.221	89	3.0	4.9	2.6	0.074	24422	21626	20m.fbmy8028_rel_o2_lto.cay9c
25510	0	8	0.9	66.0	26.2	0.000	0.038	0.003	1.053	5610	27.0	0.220	85	3.1	5.0	2.6	0.074	25322	22674	20m.fbmy8028_rel_lto.cay9c
25740	0	8	1.0	67.9	26.5	0.000	0.038	0.003	1.054	5712	27.2	0.222	85	3.0	4.9	2.6	0.074	25672	22525	20m.fbmy8028_rel_native_lto.cay9c
q100.1
q100.1: range queries with 100 insert/s per client
Performance metrics for all DBMS, not just the ones listed above. Some are normalized by throughput, others are not. Legend for results is here.
ips	qps	rps	rmbps	wps	wmbps	rpq	rkbpq	wpi	wkbpi	csps	cpups	cspq	cpupq	dbgb1	dbgb2	rss	maxop	p50	p99	tag
100	2320	0	0.0	3.4	0.1	0.000	0.000	0.034	0.869	9125	13.4	3.934	462	2.8	4.8	4.4	0.007	2285	2078	20m.fbmy8028_rel_withdbg.cay9c
100	2321	0	0.0	3.5	0.1	0.000	0.000	0.036	1.312	9124	13.4	3.930	462	2.8	4.8	4.4	0.003	2269	2061	20m.fbmy8028_rel.cay9c
100	2310	0	0.0	3.7	0.2	0.000	0.000	0.038	2.002	9082	13.4	3.932	464	2.8	4.7	4.3	0.004	2237	2046	20m.fbmy8028_rel_o2.cay9c
100	2332	0	0.0	4.0	0.3	0.000	0.000	0.041	2.957	9171	13.5	3.933	463	2.8	4.7	4.3	0.001	2317	2157	20m.fbmy8028_rel_native.cay9c
100	2356	0	0.0	3.8	0.2	0.000	0.000	0.038	2.388	9265	13.5	3.932	458	2.8	4.7	4.4	0.003	2303	2157	20m.fbmy8028_rel_o2_lto.cay9c
100	2414	0	0.0	3.6	0.1	0.000	0.000	0.036	1.398	9478	13.4	3.926	444	2.8	4.8	4.3	0.003	2365	2158	20m.fbmy8028_rel_lto.cay9c
100	2459	0	0.0	3.5	0.1	0.000	0.000	0.035	1.078	9656	13.4	3.926	436	2.8	4.8	4.4	0.001	2445	2221	20m.fbmy8028_rel_native_lto.cay9c
q500.1
q500.1: range queries with 500 insert/s per client
Performance metrics for all DBMS, not just the ones listed above. Some are normalized by throughput, others are not. Legend for results is here.
ips	qps	rps	rmbps	wps	wmbps	rpq	rkbpq	wpi	wkbpi	csps	cpups	cspq	cpupq	dbgb1	dbgb2	rss	maxop	p50	p99	tag
499	2280	0	0.0	3.7	0.2	0.000	0.000	0.007	0.509	9053	13.7	3.970	481	2.9	5.0	4.6	0.002	2285	2013	20m.fbmy8028_rel_withdbg.cay9c
499	2298	0	0.0	3.7	0.3	0.000	0.000	0.007	0.529	9106	13.6	3.963	474	2.9	5.0	4.5	0.004	2301	2014	20m.fbmy8028_rel.cay9c
499	2266	0	0.0	3.7	0.3	0.000	0.000	0.007	0.571	8981	13.5	3.964	477	2.9	5.0	4.4	0.003	2237	2015	20m.fbmy8028_rel_o2.cay9c
499	2251	0	0.0	3.5	0.2	0.000	0.000	0.007	0.408	8924	13.5	3.964	480	2.9	5.0	4.5	0.003	2222	2014	20m.fbmy8028_rel_native.cay9c
499	2274	0	0.0	3.7	0.3	0.000	0.000	0.007	0.571	9014	13.6	3.964	479	2.9	5.0	4.6	0.003	2269	2046	20m.fbmy8028_rel_o2_lto.cay9c
499	2374	0	0.0	3.6	0.2	0.000	0.000	0.007	0.489	9394	13.5	3.957	455	2.9	5.0	4.5	0.002	2349	2125	20m.fbmy8028_rel_lto.cay9c
499	2352	0	0.0	3.7	0.2	0.000	0.000	0.007	0.509	9310	13.6	3.959	463	2.9	5.0	4.5	0.003	2318	2158	20m.fbmy8028_rel_native_lto.cay9c
q1000.1
q1000.1: range queries with 1000 insert/s per client
Performance metrics for all DBMS, not just the ones listed above. Some are normalized by throughput, others are not. Legend for results is here.
ips	qps	rps	rmbps	wps	wmbps	rpq	rkbpq	wpi	wkbpi	csps	cpups	cspq	cpupq	dbgb1	dbgb2	rss	maxop	p50	p99	tag
998	2237	0	0.0	6.2	1.2	0.000	0.000	0.006	1.275	8985	14.6	4.017	522	3.1	3.3	5.3	0.003	2237	1998	20m.fbmy8028_rel_withdbg.cay9c
998	2300	0	0.0	6.0	1.2	0.000	0.000	0.006	1.237	9226	14.7	4.010	511	3.1	3.4	5.9	0.003	2317	2014	20m.fbmy8028_rel.cay9c
998	2282	0	0.0	5.2	0.9	0.000	0.000	0.005	0.932	9149	14.5	4.009	508	3.1	3.4	5.1	0.004	2285	2014	20m.fbmy8028_rel_o2.cay9c
998	2194	0	0.0	5.3	0.9	0.000	0.000	0.005	0.930	8816	14.5	4.017	529	3.1	3.4	5.2	0.001	2157	1998	20m.fbmy8028_rel_native.cay9c
998	2304	0	0.0	5.3	0.9	0.000	0.000	0.005	0.893	9242	14.5	4.011	503	3.1	3.4	5.5	0.004	2269	2046	20m.fbmy8028_rel_o2_lto.cay9c
998	2269	0	0.0	6.1	1.3	0.000	0.000	0.006	1.300	9102	14.7	4.012	518	3.0	3.3	5.3	0.003	2253	2062	20m.fbmy8028_rel_lto.cay9c
998	2348	0	0.0	6.1	1.2	0.000	0.000	0.006	1.275	9404	14.5	4.006	494	3.1	3.4	5.3	0.005	2318	2142	20m.fbmy8028_rel_native_lto.cay9c
l.i0
- l.i0: load without secondary indexes
- Legend for results is here.
- Each entry lists the percentage of responses that fit in that bucket (slower than max time for previous bucket, faster than min time for next bucket).
Insert response time histogram
256us	1ms	4ms	16ms	64ms	256ms	1s	4s	16s	gt	max	tag
0.000	0.000	99.722	0.200	0.074	0.003	0.000	0.000	0.000	0.000	0.099	fbmy8028_rel_withdbg.cay9c
0.000	0.000	99.725	0.197	0.075	0.003	0.000	0.000	0.000	0.000	0.081	fbmy8028_rel.cay9c
0.000	0.000	99.723	0.203	0.071	0.003	0.000	0.000	0.000	0.000	0.080	fbmy8028_rel_o2.cay9c
0.000	0.000	99.720	0.204	0.073	0.003	0.000	0.000	0.000	0.000	0.079	fbmy8028_rel_native.cay9c
0.000	0.000	99.725	0.200	0.071	0.003	0.000	0.000	0.000	0.000	0.093	fbmy8028_rel_o2_lto.cay9c
0.000	0.000	99.731	0.195	0.072	0.002	0.000	0.000	0.000	0.000	0.080	fbmy8028_rel_lto.cay9c
0.000	0.000	99.734	0.194	0.069	0.003	0.000	0.000	0.000	0.000	0.078	fbmy8028_rel_native_lto.cay9c
l.x
- l.x: create secondary indexes
- Legend for results is here.
- Each entry lists the percentage of responses that fit in that bucket (slower than max time for previous bucket, faster than min time for next bucket).
TODO - determine whether there is data for create index response time
l.i1
- l.i1: continue load after secondary indexes created
- Legend for results is here.
- Each entry lists the percentage of responses that fit in that bucket (slower than max time for previous bucket, faster than min time for next bucket).
Insert response time histogram
256us	1ms	4ms	16ms	64ms	256ms	1s	4s	16s	gt	max	tag
0.000	0.000	99.737	0.225	0.038	0.000	0.000	0.000	0.000	0.000	0.063	fbmy8028_rel_withdbg.cay9c
0.000	0.000	99.737	0.224	0.038	nonzero	0.000	0.000	0.000	0.000	0.076	fbmy8028_rel.cay9c
0.000	0.000	99.740	0.221	0.039	0.001	0.000	0.000	0.000	0.000	0.075	fbmy8028_rel_o2.cay9c
0.000	0.000	99.731	0.229	0.039	0.001	0.000	0.000	0.000	0.000	0.074	fbmy8028_rel_native.cay9c
0.000	0.000	99.740	0.221	0.039	nonzero	0.000	0.000	0.000	0.000	0.074	fbmy8028_rel_o2_lto.cay9c
0.000	0.000	99.749	0.211	0.039	0.001	0.000	0.000	0.000	0.000	0.074	fbmy8028_rel_lto.cay9c
0.000	0.000	99.751	0.211	0.037	0.001	0.000	0.000	0.000	0.000	0.074	fbmy8028_rel_native_lto.cay9c
q100.1
- q100.1: range queries with 100 insert/s per client
- Legend for results is here.
- Each entry lists the percentage of responses that fit in that bucket (slower than max time for previous bucket, faster than min time for next bucket).
Query response time histogram
256us	1ms	4ms	16ms	64ms	256ms	1s	4s	16s	gt	max	tag
0.661	99.338	nonzero	nonzero	0.000	0.000	0.000	0.000	0.000	0.000	0.007	fbmy8028_rel_withdbg.cay9c
0.924	99.076	nonzero	0.000	0.000	0.000	0.000	0.000	0.000	0.000	0.003	fbmy8028_rel.cay9c
0.420	99.580	nonzero	0.000	0.000	0.000	0.000	0.000	0.000	0.000	0.004	fbmy8028_rel_o2.cay9c
0.626	99.374	nonzero	0.000	0.000	0.000	0.000	0.000	0.000	0.000	0.001	fbmy8028_rel_native.cay9c
1.109	98.891	nonzero	0.000	0.000	0.000	0.000	0.000	0.000	0.000	0.003	fbmy8028_rel_o2_lto.cay9c
2.028	97.972	nonzero	0.000	0.000	0.000	0.000	0.000	0.000	0.000	0.003	fbmy8028_rel_lto.cay9c
1.647	98.353	nonzero	0.000	0.000	0.000	0.000	0.000	0.000	0.000	0.001	fbmy8028_rel_native_lto.cay9c
Insert response time histogram
256us	1ms	4ms	16ms	64ms	256ms	1s	4s	16s	gt	max	tag
0.000	0.000	99.389	0.583	0.028	0.000	0.000	0.000	0.000	0.000	0.018	fbmy8028_rel_withdbg.cay9c
0.000	0.000	99.556	0.417	0.028	0.000	0.000	0.000	0.000	0.000	0.018	fbmy8028_rel.cay9c
0.000	0.000	99.583	0.417	0.000	0.000	0.000	0.000	0.000	0.000	0.009	fbmy8028_rel_o2.cay9c
0.000	0.000	99.528	0.472	0.000	0.000	0.000	0.000	0.000	0.000	0.009	fbmy8028_rel_native.cay9c
0.000	0.000	99.556	0.417	0.028	0.000	0.000	0.000	0.000	0.000	0.016	fbmy8028_rel_o2_lto.cay9c
0.000	0.000	99.528	0.472	0.000	0.000	0.000	0.000	0.000	0.000	0.009	fbmy8028_rel_lto.cay9c
0.000	0.000	99.556	0.417	0.028	0.000	0.000	0.000	0.000	0.000	0.018	fbmy8028_rel_native_lto.cay9c
q500.1
- q500.1: range queries with 500 insert/s per client
- Legend for results is here.
- Each entry lists the percentage of responses that fit in that bucket (slower than max time for previous bucket, faster than min time for next bucket).
Query response time histogram
256us	1ms	4ms	16ms	64ms	256ms	1s	4s	16s	gt	max	tag
0.199	99.801	0.001	0.000	0.000	0.000	0.000	0.000	0.000	0.000	0.002	fbmy8028_rel_withdbg.cay9c
0.407	99.592	0.001	0.000	0.000	0.000	0.000	0.000	0.000	0.000	0.004	fbmy8028_rel.cay9c
0.232	99.768	0.001	0.000	0.000	0.000	0.000	0.000	0.000	0.000	0.003	fbmy8028_rel_o2.cay9c
0.306	99.694	nonzero	0.000	0.000	0.000	0.000	0.000	0.000	0.000	0.003	fbmy8028_rel_native.cay9c
0.431	99.568	0.001	0.000	0.000	0.000	0.000	0.000	0.000	0.000	0.003	fbmy8028_rel_o2_lto.cay9c
1.152	98.847	nonzero	0.000	0.000	0.000	0.000	0.000	0.000	0.000	0.002	fbmy8028_rel_lto.cay9c
1.188	98.812	nonzero	0.000	0.000	0.000	0.000	0.000	0.000	0.000	0.003	fbmy8028_rel_native_lto.cay9c
Insert response time histogram
256us	1ms	4ms	16ms	64ms	256ms	1s	4s	16s	gt	max	tag
0.000	0.000	99.633	0.322	0.044	0.000	0.000	0.000	0.000	0.000	0.018	fbmy8028_rel_withdbg.cay9c
0.000	0.000	99.600	0.356	0.044	0.000	0.000	0.000	0.000	0.000	0.023	fbmy8028_rel.cay9c
0.000	0.000	99.606	0.350	0.044	0.000	0.000	0.000	0.000	0.000	0.018	fbmy8028_rel_o2.cay9c
0.000	0.000	99.617	0.339	0.044	0.000	0.000	0.000	0.000	0.000	0.018	fbmy8028_rel_native.cay9c
0.000	0.000	99.672	0.289	0.039	0.000	0.000	0.000	0.000	0.000	0.023	fbmy8028_rel_o2_lto.cay9c
0.000	0.000	99.633	0.322	0.044	0.000	0.000	0.000	0.000	0.000	0.019	fbmy8028_rel_lto.cay9c
0.000	0.000	99.633	0.322	0.044	0.000	0.000	0.000	0.000	0.000	0.018	fbmy8028_rel_native_lto.cay9c
q1000.1
- q1000.1: range queries with 1000 insert/s per client
- Legend for results is here.
- Each entry lists the percentage of responses that fit in that bucket (slower than max time for previous bucket, faster than min time for next bucket).
Query response time histogram
256us	1ms	4ms	16ms	64ms	256ms	1s	4s	16s	gt	max	tag
0.200	99.800	0.001	0.000	0.000	0.000	0.000	0.000	0.000	0.000	0.003	fbmy8028_rel_withdbg.cay9c
0.479	99.519	0.002	0.000	0.000	0.000	0.000	0.000	0.000	0.000	0.003	fbmy8028_rel.cay9c
0.253	99.746	0.001	0.000	0.000	0.000	0.000	0.000	0.000	0.000	0.004	fbmy8028_rel_o2.cay9c
0.175	99.824	nonzero	0.000	0.000	0.000	0.000	0.000	0.000	0.000	0.001	fbmy8028_rel_native.cay9c
0.723	99.276	0.001	nonzero	0.000	0.000	0.000	0.000	0.000	0.000	0.004	fbmy8028_rel_o2_lto.cay9c
0.575	99.425	0.001	0.000	0.000	0.000	0.000	0.000	0.000	0.000	0.003	fbmy8028_rel_lto.cay9c
1.182	98.818	0.001	nonzero	0.000	0.000	0.000	0.000	0.000	0.000	0.005	fbmy8028_rel_native_lto.cay9c
Insert response time histogram
256us	1ms	4ms	16ms	64ms	256ms	1s	4s	16s	gt	max	tag
0.000	0.000	99.628	0.336	0.036	0.000	0.000	0.000	0.000	0.000	0.023	fbmy8028_rel_withdbg.cay9c
0.000	0.000	99.644	0.314	0.042	0.000	0.000	0.000	0.000	0.000	0.023	fbmy8028_rel.cay9c
0.000	0.000	99.614	0.344	0.042	0.000	0.000	0.000	0.000	0.000	0.018	fbmy8028_rel_o2.cay9c
0.000	0.000	99.642	0.314	0.044	0.000	0.000	0.000	0.000	0.000	0.018	fbmy8028_rel_native.cay9c
0.000	0.000	99.686	0.269	0.044	0.000	0.000	0.000	0.000	0.000	0.023	fbmy8028_rel_o2_lto.cay9c
0.000	0.000	99.642	0.317	0.042	0.000	0.000	0.000	0.000	0.000	0.023	fbmy8028_rel_lto.cay9c
0.000	0.000	99.661	0.297	0.042	0.000	0.000	0.000	0.000	0.000	0.023	fbmy8028_rel_native_lto.cay9c