Introduction
This is a report for the insert benchmark with 20M docs and 1 client(s). It is generated by scripts (bash, awk, sed) and Tufte might not be impressed. An overview of the insert benchmark is here and a short update is here. Below, by DBMS, I mean DBMS+version.config. An example is my8020.c10b40 where my means MySQL, 8020 is version 8.0.20 and c10b40 is the name for the configuration file.
The test server has 8 AMD cores, 16G RAM and an NVMe SSD. It is described here as the Beelink. The benchmark was run with 1 client and there were 1 or 2 connections per client (1 for queries, 1 for inserts). The benchmark loads 20M rows without secondary indexes, creates secondary indexes, loads another 20M rows then does 3 read+write tests for one hour each that do queries as fast as possible with 100, 500 and then 1000 writes/second/client concurrent with the queries. There is one table per client. The database is cached by the storage engine and the only IO is for writes. Clients and the DBMS share one server. The per-database configs are in the per-database subdirectories here.
The tested DBMS are:
- fbmy5635_rel.cay9c - MyRocks 5.6.35, the cay9c config and compiled with CMAKE_BUILD_TYPE=Release: -O3
- fbmy8028_rel_native_lto.cay9c - MyRocks 8.0.28, the cay9c config and compiled with CMAKE_BUILD_TYPE=Release: -O3 -flto -march=native -mtune=native
Contents
- Summary
- l.i0: load without secondary indexes
- l.x: create secondary indexes
- l.i1: continue load after secondary indexes created
- q100.1: range queries with 100 insert/s per client
- q500.1: range queries with 500 insert/s per client
- q1000.1: range queries with 1000 insert/s per client
Summary
The numbers are inserts/s for l.i0 and l.i1, indexed docs (or rows) /s for l.x and queries/s for q*.2. The values are the average rate over the entire test for inserts (IPS) and queries (QPS). The range of values for IPS and QPS is split into 3 parts: bottom 25%, middle 50%, top 25%. Values in the bottom 25% have a red background, values in the top 25% have a green background and values in the middle have no color. A gray background is used for values that can be ignored because the DBMS did not sustain the target insert rate. Red backgrounds are not used when the minimum value is within 80% of the max value.
| dbms | l.i0 | l.x | l.i1 | q100.1 | q500.1 | q1000.1 |
|---|---|---|---|---|---|---|
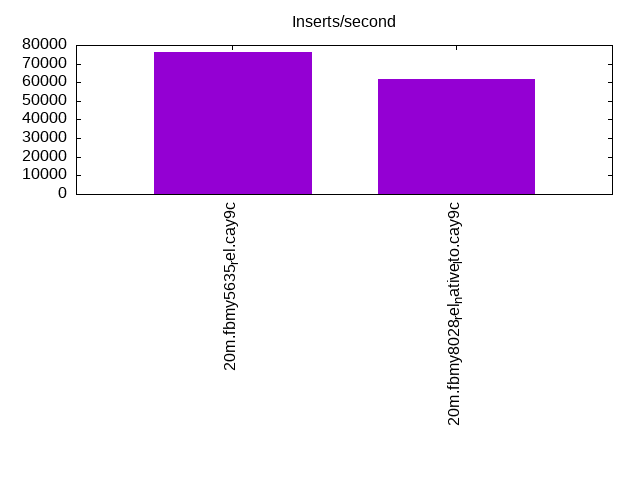
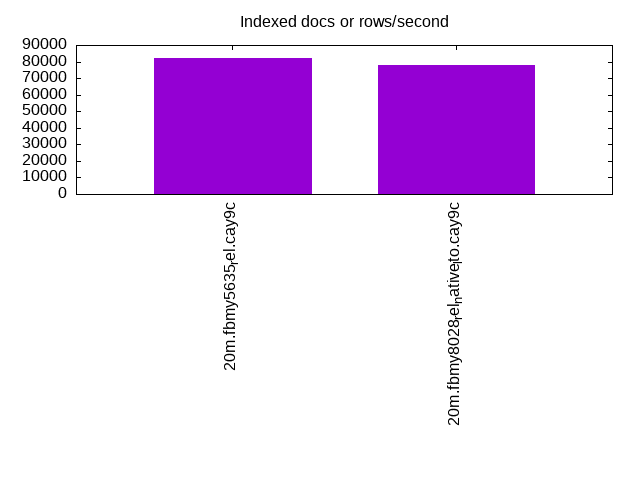
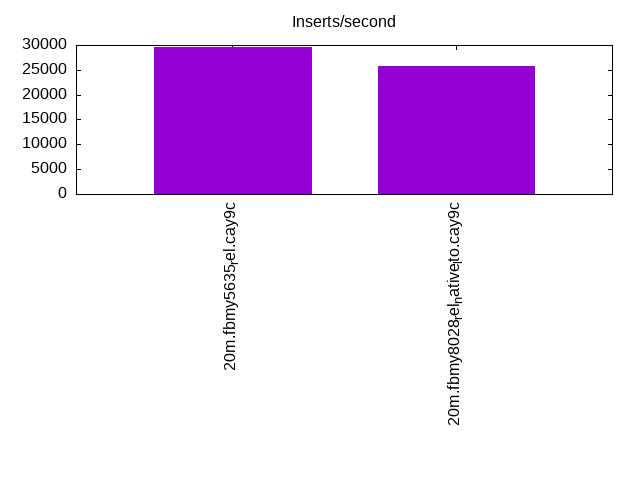
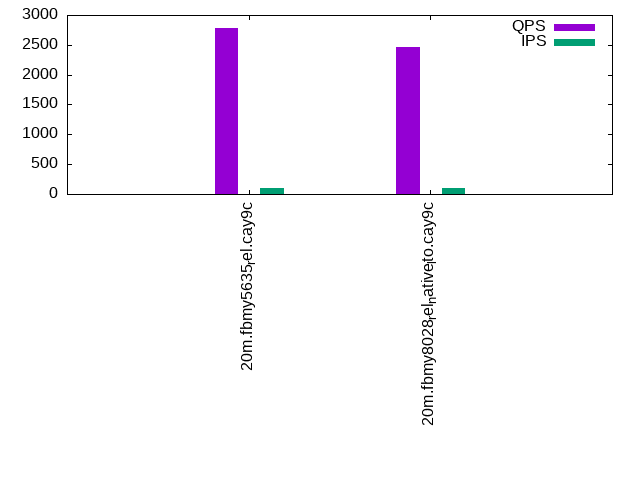
| 20m.fbmy5635_rel.cay9c | 76336 | 82377 | 29498 | 2779 | 2611 | 2559 |
| 20m.fbmy8028_rel_native_lto.cay9c | 61538 | 77907 | 25740 | 2459 | 2352 | 2348 |
This table has relative throughput, throughput for the DBMS relative to the DBMS in the first line, using the absolute throughput from the previous table.
| dbms | l.i0 | l.x | l.i1 | q100.1 | q500.1 | q1000.1 |
|---|---|---|---|---|---|---|
| 20m.fbmy5635_rel.cay9c | 1.00 | 1.00 | 1.00 | 1.00 | 1.00 | 1.00 |
| 20m.fbmy8028_rel_native_lto.cay9c | 0.81 | 0.95 | 0.87 | 0.88 | 0.90 | 0.92 |
This lists the average rate of inserts/s for the tests that do inserts concurrent with queries. For such tests the query rate is listed in the table above. The read+write tests are setup so that the insert rate should match the target rate every second. Cells that are not at least 95% of the target have a red background to indicate a failure to satisfy the target.
| dbms | q100.1 | q500.1 | q1000.1 |
|---|---|---|---|
| fbmy5635_rel.cay9c | 100 | 499 | 998 |
| fbmy8028_rel_native_lto.cay9c | 100 | 499 | 998 |
| target | 100 | 500 | 1000 |
l.i0
l.i0: load without secondary indexes. Graphs for performance per 1-second interval are here.
Average throughput:
Insert response time histogram: each cell has the percentage of responses that take <= the time in the header and max is the max response time in seconds. For the max column values in the top 25% of the range have a red background and in the bottom 25% of the range have a green background. The red background is not used when the min value is within 80% of the max value.
| dbms | 256us | 1ms | 4ms | 16ms | 64ms | 256ms | 1s | 4s | 16s | gt | max |
|---|---|---|---|---|---|---|---|---|---|---|---|
| fbmy5635_rel.cay9c | 99.866 | 0.130 | 0.004 | 0.001 | 0.071 | ||||||
| fbmy8028_rel_native_lto.cay9c | 99.734 | 0.194 | 0.069 | 0.003 | 0.078 |
Performance metrics for the DBMS listed above. Some are normalized by throughput, others are not. Legend for results is here.
ips	qps	rps	rmbps	wps	wmbps	rpq	rkbpq	wpi	wkbpi	csps	cpups	cspq	cpupq	dbgb1	dbgb2	rss	maxop	p50	p99	tag
76336	0	0	0.0	34.6	13.0	0.000	0.000	0.000	0.174	7523	22.7	0.099	24	0.7	1.8	0.2	0.071	77212	70422	20m.fbmy5635_rel.cay9c
61538	0	0	0.0	36.9	12.0	0.000	0.000	0.001	0.199	6369	22.7	0.104	30	0.7	1.9	0.6	0.078	62029	55439	20m.fbmy8028_rel_native_lto.cay9c
l.x
l.x: create secondary indexes.
Average throughput:
Performance metrics for the DBMS listed above. Some are normalized by throughput, others are not. Legend for results is here.
ips	qps	rps	rmbps	wps	wmbps	rpq	rkbpq	wpi	wkbpi	csps	cpups	cspq	cpupq	dbgb1	dbgb2	rss	maxop	p50	p99	tag
82377	0	0	0.0	31.6	12.5	0.000	0.000	0.000	0.155	254	12.7	0.003	12	1.5	2.5	1.3	0.008	NA	NA	20m.fbmy5635_rel.cay9c
77907	0	0	0.0	30.0	11.9	0.000	0.000	0.000	0.156	410	12.7	0.005	13	1.4	2.7	1.9	0.009	NA	NA	20m.fbmy8028_rel_native_lto.cay9c
l.i1
l.i1: continue load after secondary indexes created. Graphs for performance per 1-second interval are here.
Average throughput:
Insert response time histogram: each cell has the percentage of responses that take <= the time in the header and max is the max response time in seconds. For the max column values in the top 25% of the range have a red background and in the bottom 25% of the range have a green background. The red background is not used when the min value is within 80% of the max value.
| dbms | 256us | 1ms | 4ms | 16ms | 64ms | 256ms | 1s | 4s | 16s | gt | max |
|---|---|---|---|---|---|---|---|---|---|---|---|
| fbmy5635_rel.cay9c | 99.829 | 0.169 | 0.003 | nonzero | 0.064 | ||||||
| fbmy8028_rel_native_lto.cay9c | 99.751 | 0.211 | 0.037 | 0.001 | 0.074 |
Performance metrics for the DBMS listed above. Some are normalized by throughput, others are not. Legend for results is here.
ips	qps	rps	rmbps	wps	wmbps	rpq	rkbpq	wpi	wkbpi	csps	cpups	cspq	cpupq	dbgb1	dbgb2	rss	maxop	p50	p99	tag
29498	0	9	1.1	73.7	29.9	0.000	0.038	0.002	1.038	6179	28.9	0.209	78	2.8	4.6	1.9	0.064	29118	26182	20m.fbmy5635_rel.cay9c
25740	0	8	1.0	67.9	26.5	0.000	0.038	0.003	1.054	5712	27.2	0.222	85	3.0	4.9	2.6	0.074	25672	22525	20m.fbmy8028_rel_native_lto.cay9c
q100.1
q100.1: range queries with 100 insert/s per client. Graphs for performance per 1-second interval are here.
Average throughput:
Query response time histogram: each cell has the percentage of responses that take <= the time in the header and max is the max response time in seconds. For max values in the top 25% of the range have a red background and in the bottom 25% of the range have a green background. The red background is not used when the min value is within 80% of the max value.
| dbms | 256us | 1ms | 4ms | 16ms | 64ms | 256ms | 1s | 4s | 16s | gt | max |
|---|---|---|---|---|---|---|---|---|---|---|---|
| fbmy5635_rel.cay9c | 2.714 | 97.286 | nonzero | 0.002 | |||||||
| fbmy8028_rel_native_lto.cay9c | 1.647 | 98.353 | nonzero | 0.001 |
Insert response time histogram: each cell has the percentage of responses that take <= the time in the header and max is the max response time in seconds. For max values in the top 25% of the range have a red background and in the bottom 25% of the range have a green background. The red background is not used when the min value is within 80% of the max value.
| dbms | 256us | 1ms | 4ms | 16ms | 64ms | 256ms | 1s | 4s | 16s | gt | max |
|---|---|---|---|---|---|---|---|---|---|---|---|
| fbmy5635_rel.cay9c | 99.611 | 0.389 | 0.008 | ||||||||
| fbmy8028_rel_native_lto.cay9c | 99.556 | 0.417 | 0.028 | 0.018 |
Performance metrics for the DBMS listed above. Some are normalized by throughput, others are not. Legend for results is here.
ips	qps	rps	rmbps	wps	wmbps	rpq	rkbpq	wpi	wkbpi	csps	cpups	cspq	cpupq	dbgb1	dbgb2	rss	maxop	p50	p99	tag
100	2779	0	0.0	4.1	0.3	0.000	0.000	0.041	3.268	10725	12.9	3.860	371	2.8	4.6	3.8	0.002	2765	2541	20m.fbmy5635_rel.cay9c
100	2459	0	0.0	3.5	0.1	0.000	0.000	0.035	1.078	9656	13.4	3.926	436	2.8	4.8	4.4	0.001	2445	2221	20m.fbmy8028_rel_native_lto.cay9c
q500.1
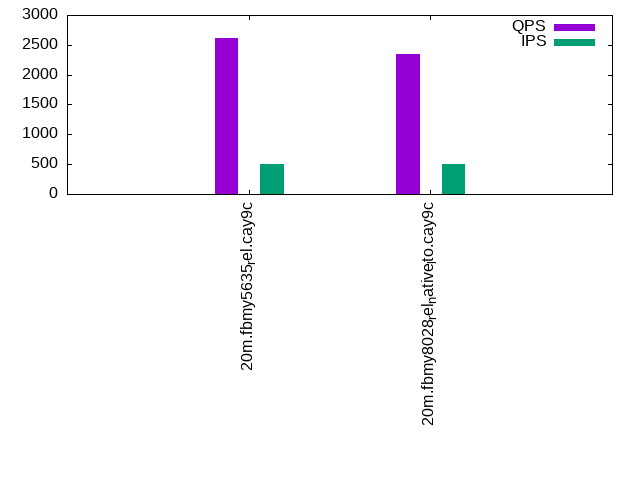
q500.1: range queries with 500 insert/s per client. Graphs for performance per 1-second interval are here.
Average throughput:
Query response time histogram: each cell has the percentage of responses that take <= the time in the header and max is the max response time in seconds. For max values in the top 25% of the range have a red background and in the bottom 25% of the range have a green background. The red background is not used when the min value is within 80% of the max value.
| dbms | 256us | 1ms | 4ms | 16ms | 64ms | 256ms | 1s | 4s | 16s | gt | max |
|---|---|---|---|---|---|---|---|---|---|---|---|
| fbmy5635_rel.cay9c | 2.054 | 97.946 | nonzero | 0.003 | |||||||
| fbmy8028_rel_native_lto.cay9c | 1.188 | 98.812 | nonzero | 0.003 |
Insert response time histogram: each cell has the percentage of responses that take <= the time in the header and max is the max response time in seconds. For max values in the top 25% of the range have a red background and in the bottom 25% of the range have a green background. The red background is not used when the min value is within 80% of the max value.
| dbms | 256us | 1ms | 4ms | 16ms | 64ms | 256ms | 1s | 4s | 16s | gt | max |
|---|---|---|---|---|---|---|---|---|---|---|---|
| fbmy5635_rel.cay9c | 99.717 | 0.283 | 0.009 | ||||||||
| fbmy8028_rel_native_lto.cay9c | 99.633 | 0.322 | 0.044 | 0.018 |
Performance metrics for the DBMS listed above. Some are normalized by throughput, others are not. Legend for results is here.
ips	qps	rps	rmbps	wps	wmbps	rpq	rkbpq	wpi	wkbpi	csps	cpups	cspq	cpupq	dbgb1	dbgb2	rss	maxop	p50	p99	tag
499	2611	0	0.0	3.5	0.2	0.000	0.000	0.007	0.407	10155	13.1	3.889	401	2.9	4.8	3.9	0.003	2605	2413	20m.fbmy5635_rel.cay9c
499	2352	0	0.0	3.7	0.2	0.000	0.000	0.007	0.509	9310	13.6	3.959	463	2.9	5.0	4.5	0.003	2318	2158	20m.fbmy8028_rel_native_lto.cay9c
q1000.1
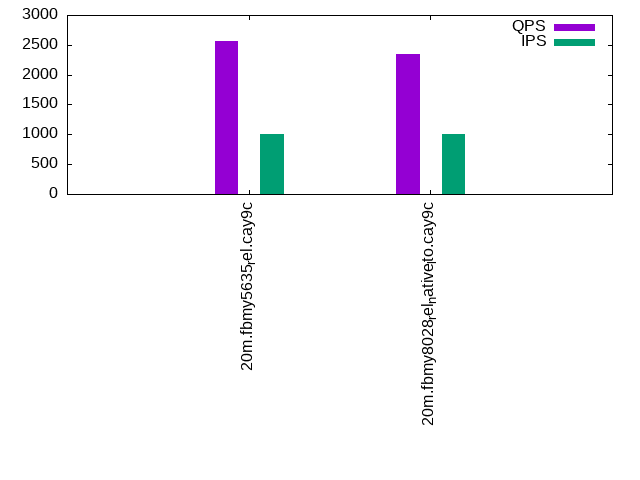
q1000.1: range queries with 1000 insert/s per client. Graphs for performance per 1-second interval are here.
Average throughput:
Query response time histogram: each cell has the percentage of responses that take <= the time in the header and max is the max response time in seconds. For max values in the top 25% of the range have a red background and in the bottom 25% of the range have a green background. The red background is not used when the min value is within 80% of the max value.
| dbms | 256us | 1ms | 4ms | 16ms | 64ms | 256ms | 1s | 4s | 16s | gt | max |
|---|---|---|---|---|---|---|---|---|---|---|---|
| fbmy5635_rel.cay9c | 1.162 | 98.838 | nonzero | 0.003 | |||||||
| fbmy8028_rel_native_lto.cay9c | 1.182 | 98.818 | 0.001 | nonzero | 0.005 |
Insert response time histogram: each cell has the percentage of responses that take <= the time in the header and max is the max response time in seconds. For max values in the top 25% of the range have a red background and in the bottom 25% of the range have a green background. The red background is not used when the min value is within 80% of the max value.
| dbms | 256us | 1ms | 4ms | 16ms | 64ms | 256ms | 1s | 4s | 16s | gt | max |
|---|---|---|---|---|---|---|---|---|---|---|---|
| fbmy5635_rel.cay9c | 99.742 | 0.258 | 0.015 | ||||||||
| fbmy8028_rel_native_lto.cay9c | 99.661 | 0.297 | 0.042 | 0.023 |
Performance metrics for the DBMS listed above. Some are normalized by throughput, others are not. Legend for results is here.
ips	qps	rps	rmbps	wps	wmbps	rpq	rkbpq	wpi	wkbpi	csps	cpups	cspq	cpupq	dbgb1	dbgb2	rss	maxop	p50	p99	tag
998	2559	0	0.0	5.4	1.0	0.000	0.000	0.005	1.010	10059	14.0	3.931	438	3.1	3.2	4.5	0.003	2541	2381	20m.fbmy5635_rel.cay9c
998	2348	0	0.0	6.1	1.2	0.000	0.000	0.006	1.275	9404	14.5	4.006	494	3.1	3.4	5.3	0.005	2318	2142	20m.fbmy8028_rel_native_lto.cay9c
l.i0
l.i0: load without secondary indexes
Performance metrics for all DBMS, not just the ones listed above. Some are normalized by throughput, others are not. Legend for results is here.
ips	qps	rps	rmbps	wps	wmbps	rpq	rkbpq	wpi	wkbpi	csps	cpups	cspq	cpupq	dbgb1	dbgb2	rss	maxop	p50	p99	tag
76336	0	0	0.0	34.6	13.0	0.000	0.000	0.000	0.174	7523	22.7	0.099	24	0.7	1.8	0.2	0.071	77212	70422	20m.fbmy5635_rel.cay9c
61538	0	0	0.0	36.9	12.0	0.000	0.000	0.001	0.199	6369	22.7	0.104	30	0.7	1.9	0.6	0.078	62029	55439	20m.fbmy8028_rel_native_lto.cay9c
l.x
l.x: create secondary indexes
Performance metrics for all DBMS, not just the ones listed above. Some are normalized by throughput, others are not. Legend for results is here.
ips	qps	rps	rmbps	wps	wmbps	rpq	rkbpq	wpi	wkbpi	csps	cpups	cspq	cpupq	dbgb1	dbgb2	rss	maxop	p50	p99	tag
82377	0	0	0.0	31.6	12.5	0.000	0.000	0.000	0.155	254	12.7	0.003	12	1.5	2.5	1.3	0.008	NA	NA	20m.fbmy5635_rel.cay9c
77907	0	0	0.0	30.0	11.9	0.000	0.000	0.000	0.156	410	12.7	0.005	13	1.4	2.7	1.9	0.009	NA	NA	20m.fbmy8028_rel_native_lto.cay9c
l.i1
l.i1: continue load after secondary indexes created
Performance metrics for all DBMS, not just the ones listed above. Some are normalized by throughput, others are not. Legend for results is here.
ips	qps	rps	rmbps	wps	wmbps	rpq	rkbpq	wpi	wkbpi	csps	cpups	cspq	cpupq	dbgb1	dbgb2	rss	maxop	p50	p99	tag
29498	0	9	1.1	73.7	29.9	0.000	0.038	0.002	1.038	6179	28.9	0.209	78	2.8	4.6	1.9	0.064	29118	26182	20m.fbmy5635_rel.cay9c
25740	0	8	1.0	67.9	26.5	0.000	0.038	0.003	1.054	5712	27.2	0.222	85	3.0	4.9	2.6	0.074	25672	22525	20m.fbmy8028_rel_native_lto.cay9c
q100.1
q100.1: range queries with 100 insert/s per client
Performance metrics for all DBMS, not just the ones listed above. Some are normalized by throughput, others are not. Legend for results is here.
ips	qps	rps	rmbps	wps	wmbps	rpq	rkbpq	wpi	wkbpi	csps	cpups	cspq	cpupq	dbgb1	dbgb2	rss	maxop	p50	p99	tag
100	2779	0	0.0	4.1	0.3	0.000	0.000	0.041	3.268	10725	12.9	3.860	371	2.8	4.6	3.8	0.002	2765	2541	20m.fbmy5635_rel.cay9c
100	2459	0	0.0	3.5	0.1	0.000	0.000	0.035	1.078	9656	13.4	3.926	436	2.8	4.8	4.4	0.001	2445	2221	20m.fbmy8028_rel_native_lto.cay9c
q500.1
q500.1: range queries with 500 insert/s per client
Performance metrics for all DBMS, not just the ones listed above. Some are normalized by throughput, others are not. Legend for results is here.
ips	qps	rps	rmbps	wps	wmbps	rpq	rkbpq	wpi	wkbpi	csps	cpups	cspq	cpupq	dbgb1	dbgb2	rss	maxop	p50	p99	tag
499	2611	0	0.0	3.5	0.2	0.000	0.000	0.007	0.407	10155	13.1	3.889	401	2.9	4.8	3.9	0.003	2605	2413	20m.fbmy5635_rel.cay9c
499	2352	0	0.0	3.7	0.2	0.000	0.000	0.007	0.509	9310	13.6	3.959	463	2.9	5.0	4.5	0.003	2318	2158	20m.fbmy8028_rel_native_lto.cay9c
q1000.1
q1000.1: range queries with 1000 insert/s per client
Performance metrics for all DBMS, not just the ones listed above. Some are normalized by throughput, others are not. Legend for results is here.
ips	qps	rps	rmbps	wps	wmbps	rpq	rkbpq	wpi	wkbpi	csps	cpups	cspq	cpupq	dbgb1	dbgb2	rss	maxop	p50	p99	tag
998	2559	0	0.0	5.4	1.0	0.000	0.000	0.005	1.010	10059	14.0	3.931	438	3.1	3.2	4.5	0.003	2541	2381	20m.fbmy5635_rel.cay9c
998	2348	0	0.0	6.1	1.2	0.000	0.000	0.006	1.275	9404	14.5	4.006	494	3.1	3.4	5.3	0.005	2318	2142	20m.fbmy8028_rel_native_lto.cay9c
l.i0
- l.i0: load without secondary indexes
- Legend for results is here.
- Each entry lists the percentage of responses that fit in that bucket (slower than max time for previous bucket, faster than min time for next bucket).
Insert response time histogram
256us	1ms	4ms	16ms	64ms	256ms	1s	4s	16s	gt	max	tag
0.000	0.000	99.866	0.130	0.004	0.001	0.000	0.000	0.000	0.000	0.071	fbmy5635_rel.cay9c
0.000	0.000	99.734	0.194	0.069	0.003	0.000	0.000	0.000	0.000	0.078	fbmy8028_rel_native_lto.cay9c
l.x
- l.x: create secondary indexes
- Legend for results is here.
- Each entry lists the percentage of responses that fit in that bucket (slower than max time for previous bucket, faster than min time for next bucket).
TODO - determine whether there is data for create index response time
l.i1
- l.i1: continue load after secondary indexes created
- Legend for results is here.
- Each entry lists the percentage of responses that fit in that bucket (slower than max time for previous bucket, faster than min time for next bucket).
Insert response time histogram
256us	1ms	4ms	16ms	64ms	256ms	1s	4s	16s	gt	max	tag
0.000	0.000	99.829	0.169	0.003	nonzero	0.000	0.000	0.000	0.000	0.064	fbmy5635_rel.cay9c
0.000	0.000	99.751	0.211	0.037	0.001	0.000	0.000	0.000	0.000	0.074	fbmy8028_rel_native_lto.cay9c
q100.1
- q100.1: range queries with 100 insert/s per client
- Legend for results is here.
- Each entry lists the percentage of responses that fit in that bucket (slower than max time for previous bucket, faster than min time for next bucket).
Query response time histogram
256us	1ms	4ms	16ms	64ms	256ms	1s	4s	16s	gt	max	tag
2.714	97.286	nonzero	0.000	0.000	0.000	0.000	0.000	0.000	0.000	0.002	fbmy5635_rel.cay9c
1.647	98.353	nonzero	0.000	0.000	0.000	0.000	0.000	0.000	0.000	0.001	fbmy8028_rel_native_lto.cay9c
Insert response time histogram
256us	1ms	4ms	16ms	64ms	256ms	1s	4s	16s	gt	max	tag
0.000	0.000	99.611	0.389	0.000	0.000	0.000	0.000	0.000	0.000	0.008	fbmy5635_rel.cay9c
0.000	0.000	99.556	0.417	0.028	0.000	0.000	0.000	0.000	0.000	0.018	fbmy8028_rel_native_lto.cay9c
q500.1
- q500.1: range queries with 500 insert/s per client
- Legend for results is here.
- Each entry lists the percentage of responses that fit in that bucket (slower than max time for previous bucket, faster than min time for next bucket).
Query response time histogram
256us	1ms	4ms	16ms	64ms	256ms	1s	4s	16s	gt	max	tag
2.054	97.946	nonzero	0.000	0.000	0.000	0.000	0.000	0.000	0.000	0.003	fbmy5635_rel.cay9c
1.188	98.812	nonzero	0.000	0.000	0.000	0.000	0.000	0.000	0.000	0.003	fbmy8028_rel_native_lto.cay9c
Insert response time histogram
256us	1ms	4ms	16ms	64ms	256ms	1s	4s	16s	gt	max	tag
0.000	0.000	99.717	0.283	0.000	0.000	0.000	0.000	0.000	0.000	0.009	fbmy5635_rel.cay9c
0.000	0.000	99.633	0.322	0.044	0.000	0.000	0.000	0.000	0.000	0.018	fbmy8028_rel_native_lto.cay9c
q1000.1
- q1000.1: range queries with 1000 insert/s per client
- Legend for results is here.
- Each entry lists the percentage of responses that fit in that bucket (slower than max time for previous bucket, faster than min time for next bucket).
Query response time histogram
256us	1ms	4ms	16ms	64ms	256ms	1s	4s	16s	gt	max	tag
1.162	98.838	nonzero	0.000	0.000	0.000	0.000	0.000	0.000	0.000	0.003	fbmy5635_rel.cay9c
1.182	98.818	0.001	nonzero	0.000	0.000	0.000	0.000	0.000	0.000	0.005	fbmy8028_rel_native_lto.cay9c
Insert response time histogram
256us	1ms	4ms	16ms	64ms	256ms	1s	4s	16s	gt	max	tag
0.000	0.000	99.742	0.258	0.000	0.000	0.000	0.000	0.000	0.000	0.015	fbmy5635_rel.cay9c
0.000	0.000	99.661	0.297	0.042	0.000	0.000	0.000	0.000	0.000	0.023	fbmy8028_rel_native_lto.cay9c