Introduction
This is a report for the insert benchmark with 20M docs and 1 client(s). It is generated by scripts (bash, awk, sed) and Tufte might not be impressed. An overview of the insert benchmark is here and a short update is here. Below, by DBMS, I mean DBMS+version.config. An example is my8020.c10b40 where my means MySQL, 8020 is version 8.0.20 and c10b40 is the name for the configuration file.
The test server has 8 AMD cores, 16G RAM and an NVMe SSD. It is described here as the Beelink. The benchmark was run with 1 client and there were 1 or 2 connections per client (1 for queries, 1 for inserts). The benchmark loads 20M rows without secondary indexes, creates secondary indexes, loads another 20M rows then does 3 read+write tests for one hour each that do queries as fast as possible with 100, 500 and then 1000 writes/second/client concurrent with the queries. There is one table per client. The database is cached by the OS page cache but not by the storage engine. Clients and the DBMS share one server. The per-database configs are in the per-database subdirectories here.
The tested DBMS are:
- fbmy8028_rel_withdbg.cay9c1g - MyRocks 8.0.28, the cay9c1g config and compiled with CMAKE_BUILD_TYPE=RelWithDebInfo and -O2
- fbmy8028_rel.cay9c1g - MyRocks 8.0.28, the cay9c1g config and compiled with CMAKE_BUILD_TYPE=Release and -O3
- fbmy8028_rel_o2.cay9c1g - MyRocks 8.0.28, the cay9c1g config and compiled with CMAKE_BUILD_TYPE=Release and -O2
- fbmy8028_rel_native.cay9c1g - MyRocks 8.0.28, the cay9c1g config and compiled with CMAKE_BUILD_TYPE=Release and -O3 -march=native -mtune=native
- fbmy8028_rel_o2_lto.cay9c1g - MyRocks 8.0.28, the cay9c1g config and compiled with CMAKE_BUILD_TYPE=Release and -O2 -flto
- fbmy8028_rel_lto.cay9c1g - MyRocks 8.0.28, the cay9c1g config and compiled with CMAKE_BUILD_TYPE=Release and -O3 -flto
- fbmy8028_rel_native_lto.cay9c1g - MyRocks 8.0.28, the cay9c1g config and compiled with CMAKE_BUILD_TYPE=Release and -O3 -flto -march=native -mtune=native
Contents
- Summary
- l.i0: load without secondary indexes
- l.x: create secondary indexes
- l.i1: continue load after secondary indexes created
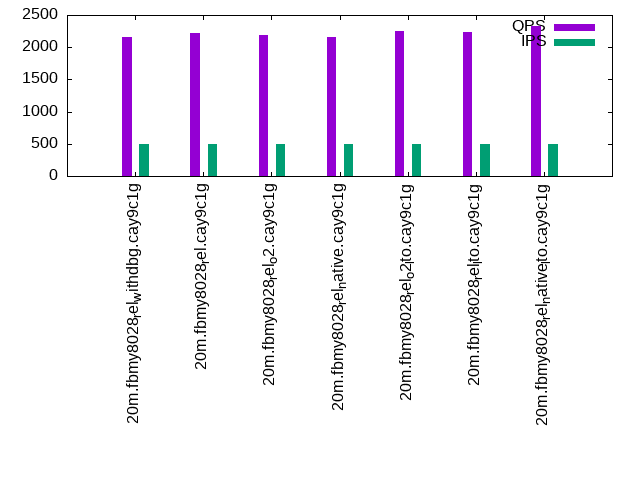
- q100.1: range queries with 100 insert/s per client
- q500.1: range queries with 500 insert/s per client
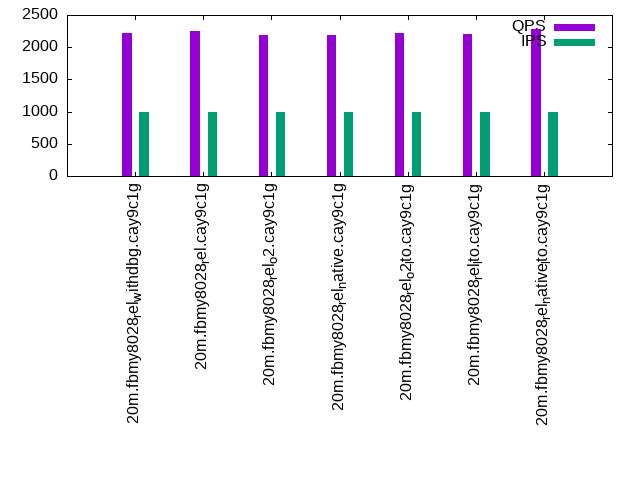
- q1000.1: range queries with 1000 insert/s per client
Summary
The numbers are inserts/s for l.i0 and l.i1, indexed docs (or rows) /s for l.x and queries/s for q*.2. The values are the average rate over the entire test for inserts (IPS) and queries (QPS). The range of values for IPS and QPS is split into 3 parts: bottom 25%, middle 50%, top 25%. Values in the bottom 25% have a red background, values in the top 25% have a green background and values in the middle have no color. A gray background is used for values that can be ignored because the DBMS did not sustain the target insert rate. Red backgrounds are not used when the minimum value is within 80% of the max value.
| dbms | l.i0 | l.x | l.i1 | q100.1 | q500.1 | q1000.1 |
|---|---|---|---|---|---|---|
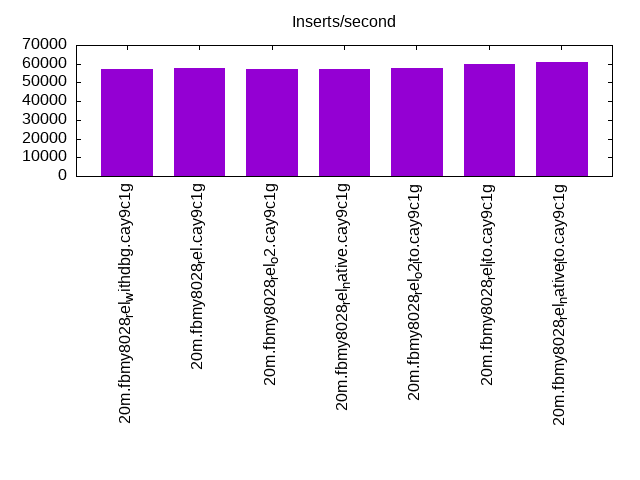
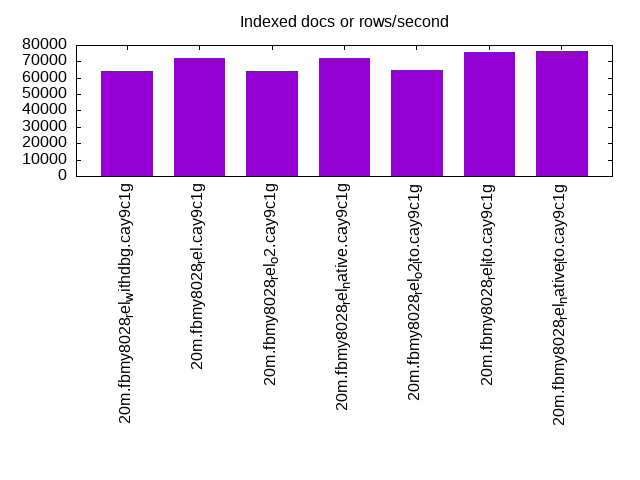
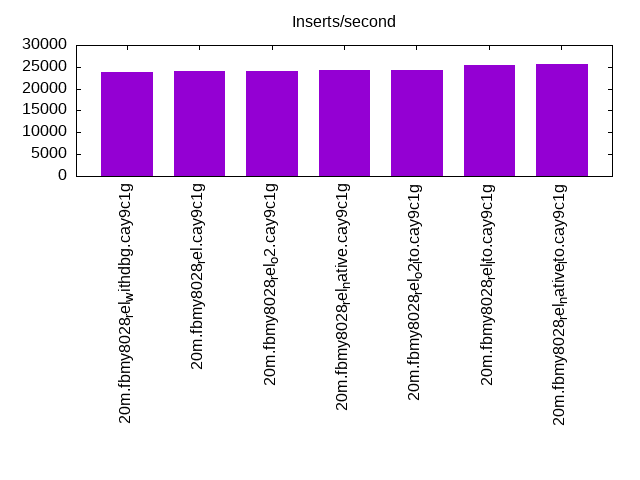
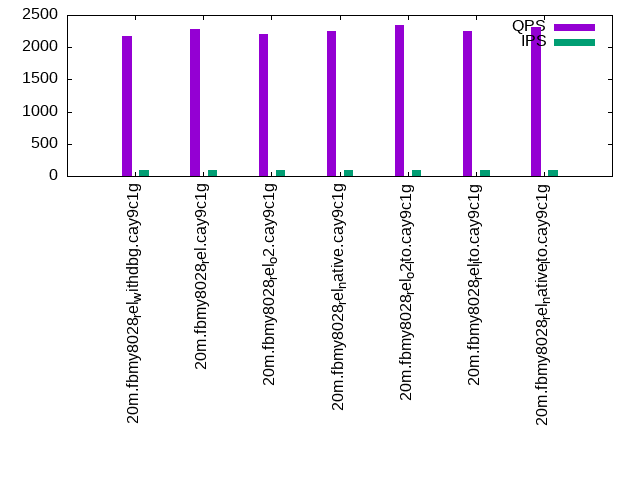
| 20m.fbmy8028_rel_withdbg.cay9c1g | 57143 | 64423 | 23923 | 2178 | 2162 | 2228 |
| 20m.fbmy8028_rel.cay9c1g | 57471 | 72043 | 24067 | 2275 | 2213 | 2252 |
| 20m.fbmy8028_rel_o2.cay9c1g | 57143 | 64217 | 23981 | 2210 | 2191 | 2185 |
| 20m.fbmy8028_rel_native.cay9c1g | 57306 | 71786 | 24213 | 2258 | 2157 | 2186 |
| 20m.fbmy8028_rel_o2_lto.cay9c1g | 57803 | 64630 | 24301 | 2345 | 2250 | 2222 |
| 20m.fbmy8028_rel_lto.cay9c1g | 59880 | 75849 | 25413 | 2252 | 2232 | 2198 |
| 20m.fbmy8028_rel_native_lto.cay9c1g | 60790 | 76426 | 25543 | 2312 | 2331 | 2276 |
This table has relative throughput, throughput for the DBMS relative to the DBMS in the first line, using the absolute throughput from the previous table.
| dbms | l.i0 | l.x | l.i1 | q100.1 | q500.1 | q1000.1 |
|---|---|---|---|---|---|---|
| 20m.fbmy8028_rel_withdbg.cay9c1g | 1.00 | 1.00 | 1.00 | 1.00 | 1.00 | 1.00 |
| 20m.fbmy8028_rel.cay9c1g | 1.01 | 1.12 | 1.01 | 1.04 | 1.02 | 1.01 |
| 20m.fbmy8028_rel_o2.cay9c1g | 1.00 | 1.00 | 1.00 | 1.01 | 1.01 | 0.98 |
| 20m.fbmy8028_rel_native.cay9c1g | 1.00 | 1.11 | 1.01 | 1.04 | 1.00 | 0.98 |
| 20m.fbmy8028_rel_o2_lto.cay9c1g | 1.01 | 1.00 | 1.02 | 1.08 | 1.04 | 1.00 |
| 20m.fbmy8028_rel_lto.cay9c1g | 1.05 | 1.18 | 1.06 | 1.03 | 1.03 | 0.99 |
| 20m.fbmy8028_rel_native_lto.cay9c1g | 1.06 | 1.19 | 1.07 | 1.06 | 1.08 | 1.02 |
This lists the average rate of inserts/s for the tests that do inserts concurrent with queries. For such tests the query rate is listed in the table above. The read+write tests are setup so that the insert rate should match the target rate every second. Cells that are not at least 95% of the target have a red background to indicate a failure to satisfy the target.
| dbms | q100.1 | q500.1 | q1000.1 |
|---|---|---|---|
| fbmy8028_rel_withdbg.cay9c1g | 100 | 499 | 998 |
| fbmy8028_rel.cay9c1g | 100 | 499 | 998 |
| fbmy8028_rel_o2.cay9c1g | 100 | 499 | 998 |
| fbmy8028_rel_native.cay9c1g | 100 | 499 | 998 |
| fbmy8028_rel_o2_lto.cay9c1g | 100 | 499 | 998 |
| fbmy8028_rel_lto.cay9c1g | 100 | 499 | 998 |
| fbmy8028_rel_native_lto.cay9c1g | 100 | 499 | 998 |
| target | 100 | 500 | 1000 |
l.i0
l.i0: load without secondary indexes. Graphs for performance per 1-second interval are here.
Average throughput:
Insert response time histogram: each cell has the percentage of responses that take <= the time in the header and max is the max response time in seconds. For the max column values in the top 25% of the range have a red background and in the bottom 25% of the range have a green background. The red background is not used when the min value is within 80% of the max value.
| dbms | 256us | 1ms | 4ms | 16ms | 64ms | 256ms | 1s | 4s | 16s | gt | max |
|---|---|---|---|---|---|---|---|---|---|---|---|
| fbmy8028_rel_withdbg.cay9c1g | 99.721 | 0.205 | 0.072 | 0.003 | 0.083 | ||||||
| fbmy8028_rel.cay9c1g | 99.721 | 0.198 | 0.078 | 0.003 | 0.075 | ||||||
| fbmy8028_rel_o2.cay9c1g | 99.720 | 0.204 | 0.073 | 0.003 | 0.082 | ||||||
| fbmy8028_rel_native.cay9c1g | 99.721 | 0.203 | 0.072 | 0.003 | 0.103 | ||||||
| fbmy8028_rel_o2_lto.cay9c1g | 99.723 | 0.202 | 0.072 | 0.002 | 0.076 | ||||||
| fbmy8028_rel_lto.cay9c1g | 99.727 | 0.200 | 0.071 | 0.002 | 0.080 | ||||||
| fbmy8028_rel_native_lto.cay9c1g | 99.733 | 0.192 | 0.073 | 0.003 | 0.074 |
Performance metrics for the DBMS listed above. Some are normalized by throughput, others are not. Legend for results is here.
ips	qps	rps	rmbps	wps	wmbps	rpq	rkbpq	wpi	wkbpi	csps	cpups	cspq	cpupq	dbgb1	dbgb2	rss	maxop	p50	p99	tag
57143	0	0	0.0	35.8	11.1	0.000	0.000	0.001	0.199	5942	22.2	0.104	31	0.7	1.9	0.6	0.083	57337	51342	20m.fbmy8028_rel_withdbg.cay9c1g
57471	0	0	0.0	35.9	11.2	0.000	0.000	0.001	0.200	5992	22.4	0.104	31	0.7	1.9	0.6	0.075	57736	51442	20m.fbmy8028_rel.cay9c1g
57143	0	0	0.0	35.6	11.1	0.000	0.000	0.001	0.200	5933	22.2	0.104	31	0.7	1.9	0.6	0.082	57237	50781	20m.fbmy8028_rel_o2.cay9c1g
57306	0	0	0.0	35.5	11.1	0.000	0.000	0.001	0.199	5977	22.3	0.104	31	0.7	1.9	0.6	0.103	57635	49957	20m.fbmy8028_rel_native.cay9c1g
57803	0	0	0.0	36.4	11.3	0.000	0.000	0.001	0.200	6003	22.5	0.104	31	0.7	1.9	0.6	0.076	58134	51841	20m.fbmy8028_rel_o2_lto.cay9c1g
59880	0	0	0.0	37.0	11.6	0.000	0.000	0.001	0.199	6185	22.7	0.103	30	0.7	1.9	0.6	0.080	59932	53540	20m.fbmy8028_rel_lto.cay9c1g
60790	0	0	0.0	38.0	11.8	0.000	0.000	0.001	0.199	6291	23.2	0.103	31	0.7	1.9	0.6	0.074	61328	54338	20m.fbmy8028_rel_native_lto.cay9c1g
l.x
l.x: create secondary indexes.
Average throughput:
Performance metrics for the DBMS listed above. Some are normalized by throughput, others are not. Legend for results is here.
ips	qps	rps	rmbps	wps	wmbps	rpq	rkbpq	wpi	wkbpi	csps	cpups	cspq	cpupq	dbgb1	dbgb2	rss	maxop	p50	p99	tag
64423	0	0	0.0	25.2	9.8	0.000	0.000	0.000	0.155	383	12.8	0.006	16	1.4	2.7	1.8	0.008	NA	NA	20m.fbmy8028_rel_withdbg.cay9c1g
72043	0	0	0.0	27.9	10.9	0.000	0.000	0.000	0.155	381	12.8	0.005	14	1.4	2.7	1.9	0.007	NA	NA	20m.fbmy8028_rel.cay9c1g
64217	0	0	0.0	25.2	9.8	0.000	0.000	0.000	0.156	383	12.8	0.006	16	1.4	2.7	1.9	0.012	NA	NA	20m.fbmy8028_rel_o2.cay9c1g
71786	0	0	0.0	28.2	10.9	0.000	0.000	0.000	0.156	401	12.7	0.006	14	1.4	2.7	1.9	0.011	NA	NA	20m.fbmy8028_rel_native.cay9c1g
64630	0	0	0.0	25.6	9.8	0.000	0.000	0.000	0.156	372	12.8	0.006	16	1.4	2.7	1.9	0.022	NA	NA	20m.fbmy8028_rel_o2_lto.cay9c1g
75849	0	0	0.0	29.1	11.5	0.000	0.000	0.000	0.155	369	12.7	0.005	13	1.4	2.7	1.9	0.013	NA	NA	20m.fbmy8028_rel_lto.cay9c1g
76426	0	0	0.0	29.8	11.6	0.000	0.000	0.000	0.155	402	13.4	0.005	14	1.4	2.7	1.9	0.008	NA	NA	20m.fbmy8028_rel_native_lto.cay9c1g
l.i1
l.i1: continue load after secondary indexes created. Graphs for performance per 1-second interval are here.
Average throughput:
Insert response time histogram: each cell has the percentage of responses that take <= the time in the header and max is the max response time in seconds. For the max column values in the top 25% of the range have a red background and in the bottom 25% of the range have a green background. The red background is not used when the min value is within 80% of the max value.
| dbms | 256us | 1ms | 4ms | 16ms | 64ms | 256ms | 1s | 4s | 16s | gt | max |
|---|---|---|---|---|---|---|---|---|---|---|---|
| fbmy8028_rel_withdbg.cay9c1g | 99.735 | 0.226 | 0.040 | nonzero | 0.065 | ||||||
| fbmy8028_rel.cay9c1g | 99.738 | 0.226 | 0.036 | 0.063 | |||||||
| fbmy8028_rel_o2.cay9c1g | 99.736 | 0.225 | 0.039 | nonzero | 0.069 | ||||||
| fbmy8028_rel_native.cay9c1g | 99.736 | 0.225 | 0.039 | 0.063 | |||||||
| fbmy8028_rel_o2_lto.cay9c1g | 99.739 | 0.223 | 0.038 | 0.001 | 0.074 | ||||||
| fbmy8028_rel_lto.cay9c1g | 99.749 | 0.211 | 0.040 | nonzero | 0.072 | ||||||
| fbmy8028_rel_native_lto.cay9c1g | 99.749 | 0.214 | 0.036 | nonzero | 0.073 |
Performance metrics for the DBMS listed above. Some are normalized by throughput, others are not. Legend for results is here.
ips	qps	rps	rmbps	wps	wmbps	rpq	rkbpq	wpi	wkbpi	csps	cpups	cspq	cpupq	dbgb1	dbgb2	rss	maxop	p50	p99	tag
23923	0	7	0.9	64.3	24.7	0.000	0.038	0.003	1.056	5356	27.2	0.224	91	2.8	4.7	1.6	0.065	23722	21027	20m.fbmy8028_rel_withdbg.cay9c1g
24067	0	7	0.9	63.0	24.6	0.000	0.038	0.003	1.046	5337	26.8	0.222	89	3.0	5.0	1.7	0.063	23874	21327	20m.fbmy8028_rel.cay9c1g
23981	0	7	0.9	64.4	24.8	0.000	0.038	0.003	1.059	5353	27.2	0.223	91	3.1	5.0	1.6	0.069	23823	21176	20m.fbmy8028_rel_o2.cay9c1g
24213	0	7	0.9	64.6	25.0	0.000	0.038	0.003	1.055	5382	26.9	0.222	89	2.8	4.7	1.7	0.063	24024	21425	20m.fbmy8028_rel_native.cay9c1g
24301	0	7	0.9	63.8	24.4	0.000	0.038	0.003	1.030	5367	27.5	0.221	91	3.0	4.9	1.6	0.074	24074	21426	20m.fbmy8028_rel_o2_lto.cay9c1g
25413	0	8	0.9	66.9	26.1	0.000	0.038	0.003	1.050	5624	27.0	0.221	85	2.9	4.8	1.7	0.072	25272	22176	20m.fbmy8028_rel_lto.cay9c1g
25543	0	8	0.9	68.5	26.5	0.000	0.038	0.003	1.062	5669	27.8	0.222	87	2.8	4.7	1.7	0.073	25422	22624	20m.fbmy8028_rel_native_lto.cay9c1g
q100.1
q100.1: range queries with 100 insert/s per client. Graphs for performance per 1-second interval are here.
Average throughput:
Query response time histogram: each cell has the percentage of responses that take <= the time in the header and max is the max response time in seconds. For max values in the top 25% of the range have a red background and in the bottom 25% of the range have a green background. The red background is not used when the min value is within 80% of the max value.
| dbms | 256us | 1ms | 4ms | 16ms | 64ms | 256ms | 1s | 4s | 16s | gt | max |
|---|---|---|---|---|---|---|---|---|---|---|---|
| fbmy8028_rel_withdbg.cay9c1g | 0.220 | 99.779 | 0.001 | 0.003 | |||||||
| fbmy8028_rel.cay9c1g | 0.527 | 99.472 | 0.001 | 0.003 | |||||||
| fbmy8028_rel_o2.cay9c1g | 0.320 | 99.679 | 0.001 | 0.003 | |||||||
| fbmy8028_rel_native.cay9c1g | 0.407 | 99.592 | 0.001 | 0.003 | |||||||
| fbmy8028_rel_o2_lto.cay9c1g | 0.994 | 99.005 | 0.001 | 0.003 | |||||||
| fbmy8028_rel_lto.cay9c1g | 0.591 | 99.407 | 0.001 | 0.003 | |||||||
| fbmy8028_rel_native_lto.cay9c1g | 0.929 | 99.070 | 0.001 | 0.003 |
Insert response time histogram: each cell has the percentage of responses that take <= the time in the header and max is the max response time in seconds. For max values in the top 25% of the range have a red background and in the bottom 25% of the range have a green background. The red background is not used when the min value is within 80% of the max value.
| dbms | 256us | 1ms | 4ms | 16ms | 64ms | 256ms | 1s | 4s | 16s | gt | max |
|---|---|---|---|---|---|---|---|---|---|---|---|
| fbmy8028_rel_withdbg.cay9c1g | 99.611 | 0.361 | 0.028 | 0.024 | |||||||
| fbmy8028_rel.cay9c1g | 99.556 | 0.444 | 0.009 | ||||||||
| fbmy8028_rel_o2.cay9c1g | 99.528 | 0.444 | 0.028 | 0.018 | |||||||
| fbmy8028_rel_native.cay9c1g | 99.500 | 0.472 | 0.028 | 0.018 | |||||||
| fbmy8028_rel_o2_lto.cay9c1g | 99.556 | 0.417 | 0.028 | 0.018 | |||||||
| fbmy8028_rel_lto.cay9c1g | 99.583 | 0.417 | 0.009 | ||||||||
| fbmy8028_rel_native_lto.cay9c1g | 99.639 | 0.333 | 0.028 | 0.017 |
Performance metrics for the DBMS listed above. Some are normalized by throughput, others are not. Legend for results is here.
ips	qps	rps	rmbps	wps	wmbps	rpq	rkbpq	wpi	wkbpi	csps	cpups	cspq	cpupq	dbgb1	dbgb2	rss	maxop	p50	p99	tag
100	2178	0	0.0	3.5	0.1	0.000	0.000	0.035	0.874	8580	13.4	3.940	492	2.8	4.8	2.1	0.003	2110	2029	20m.fbmy8028_rel_withdbg.cay9c1g
100	2275	0	0.0	3.6	0.2	0.000	0.000	0.036	1.611	8947	13.5	3.933	475	2.8	4.8	2.0	0.003	2206	2062	20m.fbmy8028_rel.cay9c1g
100	2210	0	0.0	3.6	0.1	0.000	0.000	0.036	1.265	8710	13.5	3.942	489	2.8	4.8	2.1	0.003	2142	2029	20m.fbmy8028_rel_o2.cay9c1g
100	2258	0	0.0	3.4	0.1	0.000	0.000	0.034	0.870	8878	13.4	3.931	475	2.8	4.8	2.1	0.003	2221	2029	20m.fbmy8028_rel_native.cay9c1g
100	2345	0	0.0	4.4	0.4	0.000	0.000	0.044	4.554	9217	13.6	3.931	464	2.8	4.7	2.0	0.003	2317	2157	20m.fbmy8028_rel_o2_lto.cay9c1g
100	2252	0	0.0	3.6	0.1	0.000	0.000	0.036	1.449	8868	13.4	3.937	476	2.8	4.8	2.0	0.003	2190	2046	20m.fbmy8028_rel_lto.cay9c1g
100	2312	0	0.0	3.5	0.1	0.000	0.000	0.035	1.239	9103	14.1	3.937	488	2.8	4.7	2.0	0.003	2253	2110	20m.fbmy8028_rel_native_lto.cay9c1g
q500.1
q500.1: range queries with 500 insert/s per client. Graphs for performance per 1-second interval are here.
Average throughput:
Query response time histogram: each cell has the percentage of responses that take <= the time in the header and max is the max response time in seconds. For max values in the top 25% of the range have a red background and in the bottom 25% of the range have a green background. The red background is not used when the min value is within 80% of the max value.
| dbms | 256us | 1ms | 4ms | 16ms | 64ms | 256ms | 1s | 4s | 16s | gt | max |
|---|---|---|---|---|---|---|---|---|---|---|---|
| fbmy8028_rel_withdbg.cay9c1g | 0.053 | 99.947 | nonzero | nonzero | 0.004 | ||||||
| fbmy8028_rel.cay9c1g | 0.088 | 99.911 | nonzero | 0.002 | |||||||
| fbmy8028_rel_o2.cay9c1g | 0.093 | 99.907 | nonzero | 0.002 | |||||||
| fbmy8028_rel_native.cay9c1g | 0.117 | 99.882 | 0.001 | 0.003 | |||||||
| fbmy8028_rel_o2_lto.cay9c1g | 0.360 | 99.640 | nonzero | 0.003 | |||||||
| fbmy8028_rel_lto.cay9c1g | 0.258 | 99.742 | nonzero | 0.001 | |||||||
| fbmy8028_rel_native_lto.cay9c1g | 0.831 | 99.168 | 0.001 | 0.003 |
Insert response time histogram: each cell has the percentage of responses that take <= the time in the header and max is the max response time in seconds. For max values in the top 25% of the range have a red background and in the bottom 25% of the range have a green background. The red background is not used when the min value is within 80% of the max value.
| dbms | 256us | 1ms | 4ms | 16ms | 64ms | 256ms | 1s | 4s | 16s | gt | max |
|---|---|---|---|---|---|---|---|---|---|---|---|
| fbmy8028_rel_withdbg.cay9c1g | 99.606 | 0.356 | 0.039 | 0.018 | |||||||
| fbmy8028_rel.cay9c1g | 99.639 | 0.322 | 0.039 | 0.023 | |||||||
| fbmy8028_rel_o2.cay9c1g | 99.639 | 0.317 | 0.044 | 0.024 | |||||||
| fbmy8028_rel_native.cay9c1g | 99.606 | 0.356 | 0.039 | 0.018 | |||||||
| fbmy8028_rel_o2_lto.cay9c1g | 99.644 | 0.322 | 0.033 | 0.018 | |||||||
| fbmy8028_rel_lto.cay9c1g | 99.639 | 0.317 | 0.044 | 0.023 | |||||||
| fbmy8028_rel_native_lto.cay9c1g | 99.611 | 0.344 | 0.044 | 0.018 |
Performance metrics for the DBMS listed above. Some are normalized by throughput, others are not. Legend for results is here.
ips	qps	rps	rmbps	wps	wmbps	rpq	rkbpq	wpi	wkbpi	csps	cpups	cspq	cpupq	dbgb1	dbgb2	rss	maxop	p50	p99	tag
499	2162	0	0.0	3.8	0.2	0.000	0.000	0.008	0.509	8587	13.6	3.971	503	2.9	5.0	1.9	0.004	2158	1966	20m.fbmy8028_rel_withdbg.cay9c1g
499	2213	0	0.0	3.7	0.2	0.000	0.000	0.007	0.508	8772	13.5	3.964	488	2.9	5.0	1.9	0.002	2189	1982	20m.fbmy8028_rel.cay9c1g
499	2191	0	0.0	3.7	0.2	0.000	0.000	0.007	0.508	8692	13.5	3.968	493	2.9	5.0	2.0	0.002	2190	1982	20m.fbmy8028_rel_o2.cay9c1g
499	2157	0	0.0	3.8	0.2	0.000	0.000	0.008	0.509	8558	13.5	3.967	501	2.9	5.0	1.9	0.003	2142	1949	20m.fbmy8028_rel_native.cay9c1g
499	2250	0	0.0	3.6	0.2	0.000	0.000	0.007	0.409	8914	13.5	3.962	480	2.9	4.9	2.0	0.003	2206	2014	20m.fbmy8028_rel_o2_lto.cay9c1g
499	2232	0	0.0	3.8	0.3	0.000	0.000	0.008	0.571	8849	13.5	3.964	484	2.9	5.0	1.8	0.001	2205	2014	20m.fbmy8028_rel_lto.cay9c1g
499	2331	0	0.0	3.8	0.3	0.000	0.000	0.008	0.571	9238	13.9	3.964	477	2.9	5.0	1.9	0.003	2301	2062	20m.fbmy8028_rel_native_lto.cay9c1g
q1000.1
q1000.1: range queries with 1000 insert/s per client. Graphs for performance per 1-second interval are here.
Average throughput:
Query response time histogram: each cell has the percentage of responses that take <= the time in the header and max is the max response time in seconds. For max values in the top 25% of the range have a red background and in the bottom 25% of the range have a green background. The red background is not used when the min value is within 80% of the max value.
| dbms | 256us | 1ms | 4ms | 16ms | 64ms | 256ms | 1s | 4s | 16s | gt | max |
|---|---|---|---|---|---|---|---|---|---|---|---|
| fbmy8028_rel_withdbg.cay9c1g | 0.217 | 99.782 | 0.001 | 0.003 | |||||||
| fbmy8028_rel.cay9c1g | 0.333 | 99.666 | nonzero | nonzero | 0.005 | ||||||
| fbmy8028_rel_o2.cay9c1g | 0.149 | 99.851 | 0.001 | 0.004 | |||||||
| fbmy8028_rel_native.cay9c1g | 0.142 | 99.857 | 0.001 | nonzero | 0.006 | ||||||
| fbmy8028_rel_o2_lto.cay9c1g | 0.328 | 99.671 | 0.001 | 0.003 | |||||||
| fbmy8028_rel_lto.cay9c1g | 0.308 | 99.691 | 0.001 | nonzero | 0.004 | ||||||
| fbmy8028_rel_native_lto.cay9c1g | 0.678 | 99.321 | nonzero | nonzero | 0.004 |
Insert response time histogram: each cell has the percentage of responses that take <= the time in the header and max is the max response time in seconds. For max values in the top 25% of the range have a red background and in the bottom 25% of the range have a green background. The red background is not used when the min value is within 80% of the max value.
| dbms | 256us | 1ms | 4ms | 16ms | 64ms | 256ms | 1s | 4s | 16s | gt | max |
|---|---|---|---|---|---|---|---|---|---|---|---|
| fbmy8028_rel_withdbg.cay9c1g | 99.625 | 0.331 | 0.044 | 0.023 | |||||||
| fbmy8028_rel.cay9c1g | 99.617 | 0.344 | 0.039 | 0.023 | |||||||
| fbmy8028_rel_o2.cay9c1g | 99.614 | 0.339 | 0.047 | 0.023 | |||||||
| fbmy8028_rel_native.cay9c1g | 99.625 | 0.331 | 0.044 | 0.024 | |||||||
| fbmy8028_rel_o2_lto.cay9c1g | 99.650 | 0.311 | 0.039 | 0.023 | |||||||
| fbmy8028_rel_lto.cay9c1g | 99.617 | 0.344 | 0.039 | 0.018 | |||||||
| fbmy8028_rel_native_lto.cay9c1g | 99.619 | 0.342 | 0.039 | 0.018 |
Performance metrics for the DBMS listed above. Some are normalized by throughput, others are not. Legend for results is here.
ips	qps	rps	rmbps	wps	wmbps	rpq	rkbpq	wpi	wkbpi	csps	cpups	cspq	cpupq	dbgb1	dbgb2	rss	maxop	p50	p99	tag
998	2228	0	0.0	6.3	1.2	0.000	0.000	0.006	1.275	8956	14.6	4.019	524	3.1	3.3	1.8	0.003	2205	1966	20m.fbmy8028_rel_withdbg.cay9c1g
998	2252	0	0.0	6.5	1.3	0.000	0.000	0.006	1.333	9037	14.8	4.013	526	3.0	3.3	1.7	0.005	2222	1982	20m.fbmy8028_rel.cay9c1g
998	2185	0	0.0	5.7	1.0	0.000	0.000	0.006	1.056	8777	14.5	4.018	531	3.1	3.4	1.7	0.004	2142	1981	20m.fbmy8028_rel_o2.cay9c1g
998	2186	0	0.0	6.3	1.2	0.000	0.000	0.006	1.275	8778	14.6	4.016	534	3.1	3.3	1.7	0.006	2141	1950	20m.fbmy8028_rel_native.cay9c1g
998	2222	0	0.0	5.7	1.0	0.000	0.000	0.006	1.011	8917	14.5	4.014	522	3.0	3.3	1.8	0.003	2190	1998	20m.fbmy8028_rel_o2_lto.cay9c1g
998	2198	0	0.0	5.3	0.9	0.000	0.000	0.005	0.936	8828	14.4	4.016	524	3.1	3.4	1.7	0.004	2158	1982	20m.fbmy8028_rel_lto.cay9c1g
998	2276	0	0.0	5.0	0.8	0.000	0.000	0.005	0.793	9130	14.3	4.010	503	3.1	3.4	1.9	0.004	2253	2030	20m.fbmy8028_rel_native_lto.cay9c1g
l.i0
l.i0: load without secondary indexes
Performance metrics for all DBMS, not just the ones listed above. Some are normalized by throughput, others are not. Legend for results is here.
ips	qps	rps	rmbps	wps	wmbps	rpq	rkbpq	wpi	wkbpi	csps	cpups	cspq	cpupq	dbgb1	dbgb2	rss	maxop	p50	p99	tag
57143	0	0	0.0	35.8	11.1	0.000	0.000	0.001	0.199	5942	22.2	0.104	31	0.7	1.9	0.6	0.083	57337	51342	20m.fbmy8028_rel_withdbg.cay9c1g
57471	0	0	0.0	35.9	11.2	0.000	0.000	0.001	0.200	5992	22.4	0.104	31	0.7	1.9	0.6	0.075	57736	51442	20m.fbmy8028_rel.cay9c1g
57143	0	0	0.0	35.6	11.1	0.000	0.000	0.001	0.200	5933	22.2	0.104	31	0.7	1.9	0.6	0.082	57237	50781	20m.fbmy8028_rel_o2.cay9c1g
57306	0	0	0.0	35.5	11.1	0.000	0.000	0.001	0.199	5977	22.3	0.104	31	0.7	1.9	0.6	0.103	57635	49957	20m.fbmy8028_rel_native.cay9c1g
57803	0	0	0.0	36.4	11.3	0.000	0.000	0.001	0.200	6003	22.5	0.104	31	0.7	1.9	0.6	0.076	58134	51841	20m.fbmy8028_rel_o2_lto.cay9c1g
59880	0	0	0.0	37.0	11.6	0.000	0.000	0.001	0.199	6185	22.7	0.103	30	0.7	1.9	0.6	0.080	59932	53540	20m.fbmy8028_rel_lto.cay9c1g
60790	0	0	0.0	38.0	11.8	0.000	0.000	0.001	0.199	6291	23.2	0.103	31	0.7	1.9	0.6	0.074	61328	54338	20m.fbmy8028_rel_native_lto.cay9c1g
l.x
l.x: create secondary indexes
Performance metrics for all DBMS, not just the ones listed above. Some are normalized by throughput, others are not. Legend for results is here.
ips	qps	rps	rmbps	wps	wmbps	rpq	rkbpq	wpi	wkbpi	csps	cpups	cspq	cpupq	dbgb1	dbgb2	rss	maxop	p50	p99	tag
64423	0	0	0.0	25.2	9.8	0.000	0.000	0.000	0.155	383	12.8	0.006	16	1.4	2.7	1.8	0.008	NA	NA	20m.fbmy8028_rel_withdbg.cay9c1g
72043	0	0	0.0	27.9	10.9	0.000	0.000	0.000	0.155	381	12.8	0.005	14	1.4	2.7	1.9	0.007	NA	NA	20m.fbmy8028_rel.cay9c1g
64217	0	0	0.0	25.2	9.8	0.000	0.000	0.000	0.156	383	12.8	0.006	16	1.4	2.7	1.9	0.012	NA	NA	20m.fbmy8028_rel_o2.cay9c1g
71786	0	0	0.0	28.2	10.9	0.000	0.000	0.000	0.156	401	12.7	0.006	14	1.4	2.7	1.9	0.011	NA	NA	20m.fbmy8028_rel_native.cay9c1g
64630	0	0	0.0	25.6	9.8	0.000	0.000	0.000	0.156	372	12.8	0.006	16	1.4	2.7	1.9	0.022	NA	NA	20m.fbmy8028_rel_o2_lto.cay9c1g
75849	0	0	0.0	29.1	11.5	0.000	0.000	0.000	0.155	369	12.7	0.005	13	1.4	2.7	1.9	0.013	NA	NA	20m.fbmy8028_rel_lto.cay9c1g
76426	0	0	0.0	29.8	11.6	0.000	0.000	0.000	0.155	402	13.4	0.005	14	1.4	2.7	1.9	0.008	NA	NA	20m.fbmy8028_rel_native_lto.cay9c1g
l.i1
l.i1: continue load after secondary indexes created
Performance metrics for all DBMS, not just the ones listed above. Some are normalized by throughput, others are not. Legend for results is here.
ips	qps	rps	rmbps	wps	wmbps	rpq	rkbpq	wpi	wkbpi	csps	cpups	cspq	cpupq	dbgb1	dbgb2	rss	maxop	p50	p99	tag
23923	0	7	0.9	64.3	24.7	0.000	0.038	0.003	1.056	5356	27.2	0.224	91	2.8	4.7	1.6	0.065	23722	21027	20m.fbmy8028_rel_withdbg.cay9c1g
24067	0	7	0.9	63.0	24.6	0.000	0.038	0.003	1.046	5337	26.8	0.222	89	3.0	5.0	1.7	0.063	23874	21327	20m.fbmy8028_rel.cay9c1g
23981	0	7	0.9	64.4	24.8	0.000	0.038	0.003	1.059	5353	27.2	0.223	91	3.1	5.0	1.6	0.069	23823	21176	20m.fbmy8028_rel_o2.cay9c1g
24213	0	7	0.9	64.6	25.0	0.000	0.038	0.003	1.055	5382	26.9	0.222	89	2.8	4.7	1.7	0.063	24024	21425	20m.fbmy8028_rel_native.cay9c1g
24301	0	7	0.9	63.8	24.4	0.000	0.038	0.003	1.030	5367	27.5	0.221	91	3.0	4.9	1.6	0.074	24074	21426	20m.fbmy8028_rel_o2_lto.cay9c1g
25413	0	8	0.9	66.9	26.1	0.000	0.038	0.003	1.050	5624	27.0	0.221	85	2.9	4.8	1.7	0.072	25272	22176	20m.fbmy8028_rel_lto.cay9c1g
25543	0	8	0.9	68.5	26.5	0.000	0.038	0.003	1.062	5669	27.8	0.222	87	2.8	4.7	1.7	0.073	25422	22624	20m.fbmy8028_rel_native_lto.cay9c1g
q100.1
q100.1: range queries with 100 insert/s per client
Performance metrics for all DBMS, not just the ones listed above. Some are normalized by throughput, others are not. Legend for results is here.
ips	qps	rps	rmbps	wps	wmbps	rpq	rkbpq	wpi	wkbpi	csps	cpups	cspq	cpupq	dbgb1	dbgb2	rss	maxop	p50	p99	tag
100	2178	0	0.0	3.5	0.1	0.000	0.000	0.035	0.874	8580	13.4	3.940	492	2.8	4.8	2.1	0.003	2110	2029	20m.fbmy8028_rel_withdbg.cay9c1g
100	2275	0	0.0	3.6	0.2	0.000	0.000	0.036	1.611	8947	13.5	3.933	475	2.8	4.8	2.0	0.003	2206	2062	20m.fbmy8028_rel.cay9c1g
100	2210	0	0.0	3.6	0.1	0.000	0.000	0.036	1.265	8710	13.5	3.942	489	2.8	4.8	2.1	0.003	2142	2029	20m.fbmy8028_rel_o2.cay9c1g
100	2258	0	0.0	3.4	0.1	0.000	0.000	0.034	0.870	8878	13.4	3.931	475	2.8	4.8	2.1	0.003	2221	2029	20m.fbmy8028_rel_native.cay9c1g
100	2345	0	0.0	4.4	0.4	0.000	0.000	0.044	4.554	9217	13.6	3.931	464	2.8	4.7	2.0	0.003	2317	2157	20m.fbmy8028_rel_o2_lto.cay9c1g
100	2252	0	0.0	3.6	0.1	0.000	0.000	0.036	1.449	8868	13.4	3.937	476	2.8	4.8	2.0	0.003	2190	2046	20m.fbmy8028_rel_lto.cay9c1g
100	2312	0	0.0	3.5	0.1	0.000	0.000	0.035	1.239	9103	14.1	3.937	488	2.8	4.7	2.0	0.003	2253	2110	20m.fbmy8028_rel_native_lto.cay9c1g
q500.1
q500.1: range queries with 500 insert/s per client
Performance metrics for all DBMS, not just the ones listed above. Some are normalized by throughput, others are not. Legend for results is here.
ips	qps	rps	rmbps	wps	wmbps	rpq	rkbpq	wpi	wkbpi	csps	cpups	cspq	cpupq	dbgb1	dbgb2	rss	maxop	p50	p99	tag
499	2162	0	0.0	3.8	0.2	0.000	0.000	0.008	0.509	8587	13.6	3.971	503	2.9	5.0	1.9	0.004	2158	1966	20m.fbmy8028_rel_withdbg.cay9c1g
499	2213	0	0.0	3.7	0.2	0.000	0.000	0.007	0.508	8772	13.5	3.964	488	2.9	5.0	1.9	0.002	2189	1982	20m.fbmy8028_rel.cay9c1g
499	2191	0	0.0	3.7	0.2	0.000	0.000	0.007	0.508	8692	13.5	3.968	493	2.9	5.0	2.0	0.002	2190	1982	20m.fbmy8028_rel_o2.cay9c1g
499	2157	0	0.0	3.8	0.2	0.000	0.000	0.008	0.509	8558	13.5	3.967	501	2.9	5.0	1.9	0.003	2142	1949	20m.fbmy8028_rel_native.cay9c1g
499	2250	0	0.0	3.6	0.2	0.000	0.000	0.007	0.409	8914	13.5	3.962	480	2.9	4.9	2.0	0.003	2206	2014	20m.fbmy8028_rel_o2_lto.cay9c1g
499	2232	0	0.0	3.8	0.3	0.000	0.000	0.008	0.571	8849	13.5	3.964	484	2.9	5.0	1.8	0.001	2205	2014	20m.fbmy8028_rel_lto.cay9c1g
499	2331	0	0.0	3.8	0.3	0.000	0.000	0.008	0.571	9238	13.9	3.964	477	2.9	5.0	1.9	0.003	2301	2062	20m.fbmy8028_rel_native_lto.cay9c1g
q1000.1
q1000.1: range queries with 1000 insert/s per client
Performance metrics for all DBMS, not just the ones listed above. Some are normalized by throughput, others are not. Legend for results is here.
ips	qps	rps	rmbps	wps	wmbps	rpq	rkbpq	wpi	wkbpi	csps	cpups	cspq	cpupq	dbgb1	dbgb2	rss	maxop	p50	p99	tag
998	2228	0	0.0	6.3	1.2	0.000	0.000	0.006	1.275	8956	14.6	4.019	524	3.1	3.3	1.8	0.003	2205	1966	20m.fbmy8028_rel_withdbg.cay9c1g
998	2252	0	0.0	6.5	1.3	0.000	0.000	0.006	1.333	9037	14.8	4.013	526	3.0	3.3	1.7	0.005	2222	1982	20m.fbmy8028_rel.cay9c1g
998	2185	0	0.0	5.7	1.0	0.000	0.000	0.006	1.056	8777	14.5	4.018	531	3.1	3.4	1.7	0.004	2142	1981	20m.fbmy8028_rel_o2.cay9c1g
998	2186	0	0.0	6.3	1.2	0.000	0.000	0.006	1.275	8778	14.6	4.016	534	3.1	3.3	1.7	0.006	2141	1950	20m.fbmy8028_rel_native.cay9c1g
998	2222	0	0.0	5.7	1.0	0.000	0.000	0.006	1.011	8917	14.5	4.014	522	3.0	3.3	1.8	0.003	2190	1998	20m.fbmy8028_rel_o2_lto.cay9c1g
998	2198	0	0.0	5.3	0.9	0.000	0.000	0.005	0.936	8828	14.4	4.016	524	3.1	3.4	1.7	0.004	2158	1982	20m.fbmy8028_rel_lto.cay9c1g
998	2276	0	0.0	5.0	0.8	0.000	0.000	0.005	0.793	9130	14.3	4.010	503	3.1	3.4	1.9	0.004	2253	2030	20m.fbmy8028_rel_native_lto.cay9c1g
l.i0
- l.i0: load without secondary indexes
- Legend for results is here.
- Each entry lists the percentage of responses that fit in that bucket (slower than max time for previous bucket, faster than min time for next bucket).
Insert response time histogram
256us	1ms	4ms	16ms	64ms	256ms	1s	4s	16s	gt	max	tag
0.000	0.000	99.721	0.205	0.072	0.003	0.000	0.000	0.000	0.000	0.083	fbmy8028_rel_withdbg.cay9c1g
0.000	0.000	99.721	0.198	0.078	0.003	0.000	0.000	0.000	0.000	0.075	fbmy8028_rel.cay9c1g
0.000	0.000	99.720	0.204	0.073	0.003	0.000	0.000	0.000	0.000	0.082	fbmy8028_rel_o2.cay9c1g
0.000	0.000	99.721	0.203	0.072	0.003	0.000	0.000	0.000	0.000	0.103	fbmy8028_rel_native.cay9c1g
0.000	0.000	99.723	0.202	0.072	0.002	0.000	0.000	0.000	0.000	0.076	fbmy8028_rel_o2_lto.cay9c1g
0.000	0.000	99.727	0.200	0.071	0.002	0.000	0.000	0.000	0.000	0.080	fbmy8028_rel_lto.cay9c1g
0.000	0.000	99.733	0.192	0.073	0.003	0.000	0.000	0.000	0.000	0.074	fbmy8028_rel_native_lto.cay9c1g
l.x
- l.x: create secondary indexes
- Legend for results is here.
- Each entry lists the percentage of responses that fit in that bucket (slower than max time for previous bucket, faster than min time for next bucket).
TODO - determine whether there is data for create index response time
l.i1
- l.i1: continue load after secondary indexes created
- Legend for results is here.
- Each entry lists the percentage of responses that fit in that bucket (slower than max time for previous bucket, faster than min time for next bucket).
Insert response time histogram
256us	1ms	4ms	16ms	64ms	256ms	1s	4s	16s	gt	max	tag
0.000	0.000	99.735	0.226	0.040	nonzero	0.000	0.000	0.000	0.000	0.065	fbmy8028_rel_withdbg.cay9c1g
0.000	0.000	99.738	0.226	0.036	0.000	0.000	0.000	0.000	0.000	0.063	fbmy8028_rel.cay9c1g
0.000	0.000	99.736	0.225	0.039	nonzero	0.000	0.000	0.000	0.000	0.069	fbmy8028_rel_o2.cay9c1g
0.000	0.000	99.736	0.225	0.039	0.000	0.000	0.000	0.000	0.000	0.063	fbmy8028_rel_native.cay9c1g
0.000	0.000	99.739	0.223	0.038	0.001	0.000	0.000	0.000	0.000	0.074	fbmy8028_rel_o2_lto.cay9c1g
0.000	0.000	99.749	0.211	0.040	nonzero	0.000	0.000	0.000	0.000	0.072	fbmy8028_rel_lto.cay9c1g
0.000	0.000	99.749	0.214	0.036	nonzero	0.000	0.000	0.000	0.000	0.073	fbmy8028_rel_native_lto.cay9c1g
q100.1
- q100.1: range queries with 100 insert/s per client
- Legend for results is here.
- Each entry lists the percentage of responses that fit in that bucket (slower than max time for previous bucket, faster than min time for next bucket).
Query response time histogram
256us	1ms	4ms	16ms	64ms	256ms	1s	4s	16s	gt	max	tag
0.220	99.779	0.001	0.000	0.000	0.000	0.000	0.000	0.000	0.000	0.003	fbmy8028_rel_withdbg.cay9c1g
0.527	99.472	0.001	0.000	0.000	0.000	0.000	0.000	0.000	0.000	0.003	fbmy8028_rel.cay9c1g
0.320	99.679	0.001	0.000	0.000	0.000	0.000	0.000	0.000	0.000	0.003	fbmy8028_rel_o2.cay9c1g
0.407	99.592	0.001	0.000	0.000	0.000	0.000	0.000	0.000	0.000	0.003	fbmy8028_rel_native.cay9c1g
0.994	99.005	0.001	0.000	0.000	0.000	0.000	0.000	0.000	0.000	0.003	fbmy8028_rel_o2_lto.cay9c1g
0.591	99.407	0.001	0.000	0.000	0.000	0.000	0.000	0.000	0.000	0.003	fbmy8028_rel_lto.cay9c1g
0.929	99.070	0.001	0.000	0.000	0.000	0.000	0.000	0.000	0.000	0.003	fbmy8028_rel_native_lto.cay9c1g
Insert response time histogram
256us	1ms	4ms	16ms	64ms	256ms	1s	4s	16s	gt	max	tag
0.000	0.000	99.611	0.361	0.028	0.000	0.000	0.000	0.000	0.000	0.024	fbmy8028_rel_withdbg.cay9c1g
0.000	0.000	99.556	0.444	0.000	0.000	0.000	0.000	0.000	0.000	0.009	fbmy8028_rel.cay9c1g
0.000	0.000	99.528	0.444	0.028	0.000	0.000	0.000	0.000	0.000	0.018	fbmy8028_rel_o2.cay9c1g
0.000	0.000	99.500	0.472	0.028	0.000	0.000	0.000	0.000	0.000	0.018	fbmy8028_rel_native.cay9c1g
0.000	0.000	99.556	0.417	0.028	0.000	0.000	0.000	0.000	0.000	0.018	fbmy8028_rel_o2_lto.cay9c1g
0.000	0.000	99.583	0.417	0.000	0.000	0.000	0.000	0.000	0.000	0.009	fbmy8028_rel_lto.cay9c1g
0.000	0.000	99.639	0.333	0.028	0.000	0.000	0.000	0.000	0.000	0.017	fbmy8028_rel_native_lto.cay9c1g
q500.1
- q500.1: range queries with 500 insert/s per client
- Legend for results is here.
- Each entry lists the percentage of responses that fit in that bucket (slower than max time for previous bucket, faster than min time for next bucket).
Query response time histogram
256us	1ms	4ms	16ms	64ms	256ms	1s	4s	16s	gt	max	tag
0.053	99.947	nonzero	nonzero	0.000	0.000	0.000	0.000	0.000	0.000	0.004	fbmy8028_rel_withdbg.cay9c1g
0.088	99.911	nonzero	0.000	0.000	0.000	0.000	0.000	0.000	0.000	0.002	fbmy8028_rel.cay9c1g
0.093	99.907	nonzero	0.000	0.000	0.000	0.000	0.000	0.000	0.000	0.002	fbmy8028_rel_o2.cay9c1g
0.117	99.882	0.001	0.000	0.000	0.000	0.000	0.000	0.000	0.000	0.003	fbmy8028_rel_native.cay9c1g
0.360	99.640	nonzero	0.000	0.000	0.000	0.000	0.000	0.000	0.000	0.003	fbmy8028_rel_o2_lto.cay9c1g
0.258	99.742	nonzero	0.000	0.000	0.000	0.000	0.000	0.000	0.000	0.001	fbmy8028_rel_lto.cay9c1g
0.831	99.168	0.001	0.000	0.000	0.000	0.000	0.000	0.000	0.000	0.003	fbmy8028_rel_native_lto.cay9c1g
Insert response time histogram
256us	1ms	4ms	16ms	64ms	256ms	1s	4s	16s	gt	max	tag
0.000	0.000	99.606	0.356	0.039	0.000	0.000	0.000	0.000	0.000	0.018	fbmy8028_rel_withdbg.cay9c1g
0.000	0.000	99.639	0.322	0.039	0.000	0.000	0.000	0.000	0.000	0.023	fbmy8028_rel.cay9c1g
0.000	0.000	99.639	0.317	0.044	0.000	0.000	0.000	0.000	0.000	0.024	fbmy8028_rel_o2.cay9c1g
0.000	0.000	99.606	0.356	0.039	0.000	0.000	0.000	0.000	0.000	0.018	fbmy8028_rel_native.cay9c1g
0.000	0.000	99.644	0.322	0.033	0.000	0.000	0.000	0.000	0.000	0.018	fbmy8028_rel_o2_lto.cay9c1g
0.000	0.000	99.639	0.317	0.044	0.000	0.000	0.000	0.000	0.000	0.023	fbmy8028_rel_lto.cay9c1g
0.000	0.000	99.611	0.344	0.044	0.000	0.000	0.000	0.000	0.000	0.018	fbmy8028_rel_native_lto.cay9c1g
q1000.1
- q1000.1: range queries with 1000 insert/s per client
- Legend for results is here.
- Each entry lists the percentage of responses that fit in that bucket (slower than max time for previous bucket, faster than min time for next bucket).
Query response time histogram
256us	1ms	4ms	16ms	64ms	256ms	1s	4s	16s	gt	max	tag
0.217	99.782	0.001	0.000	0.000	0.000	0.000	0.000	0.000	0.000	0.003	fbmy8028_rel_withdbg.cay9c1g
0.333	99.666	nonzero	nonzero	0.000	0.000	0.000	0.000	0.000	0.000	0.005	fbmy8028_rel.cay9c1g
0.149	99.851	0.001	0.000	0.000	0.000	0.000	0.000	0.000	0.000	0.004	fbmy8028_rel_o2.cay9c1g
0.142	99.857	0.001	nonzero	0.000	0.000	0.000	0.000	0.000	0.000	0.006	fbmy8028_rel_native.cay9c1g
0.328	99.671	0.001	0.000	0.000	0.000	0.000	0.000	0.000	0.000	0.003	fbmy8028_rel_o2_lto.cay9c1g
0.308	99.691	0.001	nonzero	0.000	0.000	0.000	0.000	0.000	0.000	0.004	fbmy8028_rel_lto.cay9c1g
0.678	99.321	nonzero	nonzero	0.000	0.000	0.000	0.000	0.000	0.000	0.004	fbmy8028_rel_native_lto.cay9c1g
Insert response time histogram
256us	1ms	4ms	16ms	64ms	256ms	1s	4s	16s	gt	max	tag
0.000	0.000	99.625	0.331	0.044	0.000	0.000	0.000	0.000	0.000	0.023	fbmy8028_rel_withdbg.cay9c1g
0.000	0.000	99.617	0.344	0.039	0.000	0.000	0.000	0.000	0.000	0.023	fbmy8028_rel.cay9c1g
0.000	0.000	99.614	0.339	0.047	0.000	0.000	0.000	0.000	0.000	0.023	fbmy8028_rel_o2.cay9c1g
0.000	0.000	99.625	0.331	0.044	0.000	0.000	0.000	0.000	0.000	0.024	fbmy8028_rel_native.cay9c1g
0.000	0.000	99.650	0.311	0.039	0.000	0.000	0.000	0.000	0.000	0.023	fbmy8028_rel_o2_lto.cay9c1g
0.000	0.000	99.617	0.344	0.039	0.000	0.000	0.000	0.000	0.000	0.018	fbmy8028_rel_lto.cay9c1g
0.000	0.000	99.619	0.342	0.039	0.000	0.000	0.000	0.000	0.000	0.018	fbmy8028_rel_native_lto.cay9c1g