Introduction
This is a report for the insert benchmark with 20M docs and 1 client(s). It is generated by scripts (bash, awk, sed) and Tufte might not be impressed. An overview of the insert benchmark is here and a short update is here. Below, by DBMS, I mean DBMS+version.config. An example is my8020.c10b40 where my means MySQL, 8020 is version 8.0.20 and c10b40 is the name for the configuration file.
The test server has 8 AMD cores, 16G RAM and an NVMe SSD. It is described here as the Beelink. The benchmark was run with 1 client and there were 1 or 2 connections per client (1 for queries, 1 for inserts). The benchmark loads 20M rows without secondary indexes, creates secondary indexes, loads another 20M rows then does 3 read+write tests for one hour each that do queries as fast as possible with 100, 500 and then 1000 writes/second/client concurrent with the queries. There is one table per client. The database is cached by the OS page cache but not by the storage engine. Clients and the DBMS share one server. The per-database configs are in the per-database subdirectories here.
The tested DBMS are:
- fbmy5635_rel.cay9c1g - MyRocks 5.6.35, the cay9c1g config and compiled with CMAKE_BUILD_TYPE=Release: -O3
- fbmy8028_rel_native_lto.cay9c1g - MyRocks 8.0.28, the cay9c1g config and compiled with CMAKE_BUILD_TYPE=Release: -O3 -flto -march=native -mtune=native
Contents
- Summary
- l.i0: load without secondary indexes
- l.x: create secondary indexes
- l.i1: continue load after secondary indexes created
- q100.1: range queries with 100 insert/s per client
- q500.1: range queries with 500 insert/s per client
- q1000.1: range queries with 1000 insert/s per client
Summary
The numbers are inserts/s for l.i0 and l.i1, indexed docs (or rows) /s for l.x and queries/s for q*.2. The values are the average rate over the entire test for inserts (IPS) and queries (QPS). The range of values for IPS and QPS is split into 3 parts: bottom 25%, middle 50%, top 25%. Values in the bottom 25% have a red background, values in the top 25% have a green background and values in the middle have no color. A gray background is used for values that can be ignored because the DBMS did not sustain the target insert rate. Red backgrounds are not used when the minimum value is within 80% of the max value.
| dbms | l.i0 | l.x | l.i1 | q100.1 | q500.1 | q1000.1 |
|---|---|---|---|---|---|---|
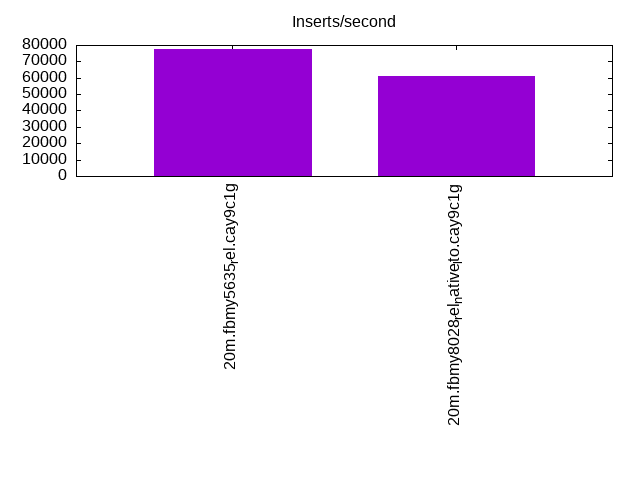
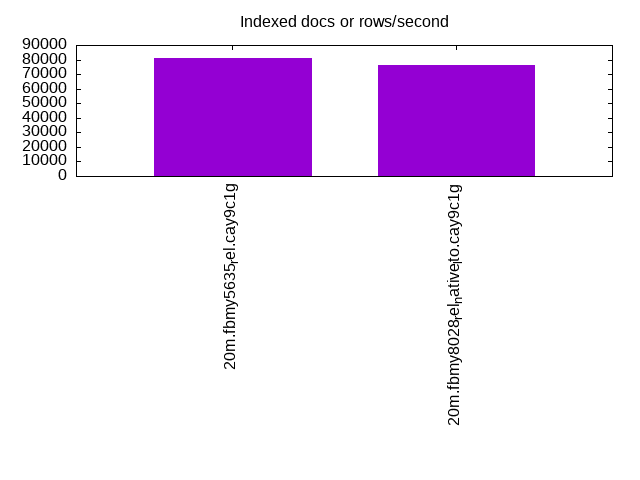
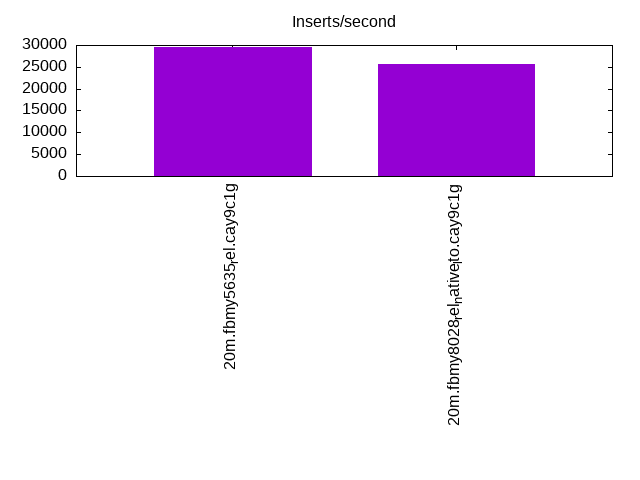
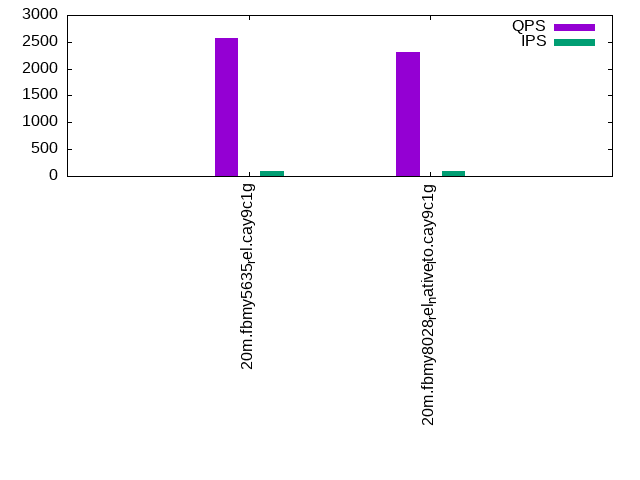
| 20m.fbmy5635_rel.cay9c1g | 77821 | 81376 | 29498 | 2566 | 2456 | 2465 |
| 20m.fbmy8028_rel_native_lto.cay9c1g | 60790 | 76426 | 25543 | 2312 | 2331 | 2276 |
This table has relative throughput, throughput for the DBMS relative to the DBMS in the first line, using the absolute throughput from the previous table.
| dbms | l.i0 | l.x | l.i1 | q100.1 | q500.1 | q1000.1 |
|---|---|---|---|---|---|---|
| 20m.fbmy5635_rel.cay9c1g | 1.00 | 1.00 | 1.00 | 1.00 | 1.00 | 1.00 |
| 20m.fbmy8028_rel_native_lto.cay9c1g | 0.78 | 0.94 | 0.87 | 0.90 | 0.95 | 0.92 |
This lists the average rate of inserts/s for the tests that do inserts concurrent with queries. For such tests the query rate is listed in the table above. The read+write tests are setup so that the insert rate should match the target rate every second. Cells that are not at least 95% of the target have a red background to indicate a failure to satisfy the target.
| dbms | q100.1 | q500.1 | q1000.1 |
|---|---|---|---|
| fbmy5635_rel.cay9c1g | 100 | 499 | 998 |
| fbmy8028_rel_native_lto.cay9c1g | 100 | 499 | 998 |
| target | 100 | 500 | 1000 |
l.i0
l.i0: load without secondary indexes. Graphs for performance per 1-second interval are here.
Average throughput:
Insert response time histogram: each cell has the percentage of responses that take <= the time in the header and max is the max response time in seconds. For the max column values in the top 25% of the range have a red background and in the bottom 25% of the range have a green background. The red background is not used when the min value is within 80% of the max value.
| dbms | 256us | 1ms | 4ms | 16ms | 64ms | 256ms | 1s | 4s | 16s | gt | max |
|---|---|---|---|---|---|---|---|---|---|---|---|
| fbmy5635_rel.cay9c1g | 99.869 | 0.128 | 0.003 | 0.001 | 0.065 | ||||||
| fbmy8028_rel_native_lto.cay9c1g | 99.733 | 0.192 | 0.073 | 0.003 | 0.074 |
Performance metrics for the DBMS listed above. Some are normalized by throughput, others are not. Legend for results is here.
ips	qps	rps	rmbps	wps	wmbps	rpq	rkbpq	wpi	wkbpi	csps	cpups	cspq	cpupq	dbgb1	dbgb2	rss	maxop	p50	p99	tag
77821	0	0	0.0	38.1	13.2	0.000	0.000	0.000	0.174	7656	23.3	0.098	24	0.7	1.8	0.2	0.065	78614	71619	20m.fbmy5635_rel.cay9c1g
60790	0	0	0.0	38.0	11.8	0.000	0.000	0.001	0.199	6291	23.2	0.103	31	0.7	1.9	0.6	0.074	61328	54338	20m.fbmy8028_rel_native_lto.cay9c1g
l.x
l.x: create secondary indexes.
Average throughput:
Performance metrics for the DBMS listed above. Some are normalized by throughput, others are not. Legend for results is here.
ips	qps	rps	rmbps	wps	wmbps	rpq	rkbpq	wpi	wkbpi	csps	cpups	cspq	cpupq	dbgb1	dbgb2	rss	maxop	p50	p99	tag
81376	0	0	0.0	32.1	12.4	0.000	0.000	0.000	0.156	244	12.7	0.003	12	1.5	2.5	1.2	0.007	NA	NA	20m.fbmy5635_rel.cay9c1g
76426	0	0	0.0	29.8	11.6	0.000	0.000	0.000	0.155	402	13.4	0.005	14	1.4	2.7	1.9	0.008	NA	NA	20m.fbmy8028_rel_native_lto.cay9c1g
l.i1
l.i1: continue load after secondary indexes created. Graphs for performance per 1-second interval are here.
Average throughput:
Insert response time histogram: each cell has the percentage of responses that take <= the time in the header and max is the max response time in seconds. For the max column values in the top 25% of the range have a red background and in the bottom 25% of the range have a green background. The red background is not used when the min value is within 80% of the max value.
| dbms | 256us | 1ms | 4ms | 16ms | 64ms | 256ms | 1s | 4s | 16s | gt | max |
|---|---|---|---|---|---|---|---|---|---|---|---|
| fbmy5635_rel.cay9c1g | 99.827 | 0.169 | 0.003 | nonzero | 0.081 | ||||||
| fbmy8028_rel_native_lto.cay9c1g | 99.749 | 0.214 | 0.036 | nonzero | 0.073 |
Performance metrics for the DBMS listed above. Some are normalized by throughput, others are not. Legend for results is here.
ips	qps	rps	rmbps	wps	wmbps	rpq	rkbpq	wpi	wkbpi	csps	cpups	cspq	cpupq	dbgb1	dbgb2	rss	maxop	p50	p99	tag
29498	0	9	1.1	75.0	29.6	0.000	0.038	0.003	1.027	6221	28.9	0.211	78	2.9	4.7	1.3	0.081	29233	26121	20m.fbmy5635_rel.cay9c1g
25543	0	8	0.9	68.5	26.5	0.000	0.038	0.003	1.062	5669	27.8	0.222	87	2.8	4.7	1.7	0.073	25422	22624	20m.fbmy8028_rel_native_lto.cay9c1g
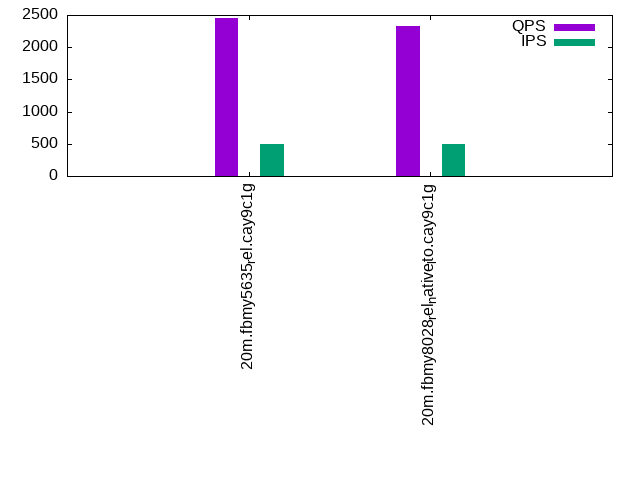
q100.1
q100.1: range queries with 100 insert/s per client. Graphs for performance per 1-second interval are here.
Average throughput:
Query response time histogram: each cell has the percentage of responses that take <= the time in the header and max is the max response time in seconds. For max values in the top 25% of the range have a red background and in the bottom 25% of the range have a green background. The red background is not used when the min value is within 80% of the max value.
| dbms | 256us | 1ms | 4ms | 16ms | 64ms | 256ms | 1s | 4s | 16s | gt | max |
|---|---|---|---|---|---|---|---|---|---|---|---|
| fbmy5635_rel.cay9c1g | 1.269 | 98.731 | 0.001 | 0.003 | |||||||
| fbmy8028_rel_native_lto.cay9c1g | 0.929 | 99.070 | 0.001 | 0.003 |
Insert response time histogram: each cell has the percentage of responses that take <= the time in the header and max is the max response time in seconds. For max values in the top 25% of the range have a red background and in the bottom 25% of the range have a green background. The red background is not used when the min value is within 80% of the max value.
| dbms | 256us | 1ms | 4ms | 16ms | 64ms | 256ms | 1s | 4s | 16s | gt | max |
|---|---|---|---|---|---|---|---|---|---|---|---|
| fbmy5635_rel.cay9c1g | 99.667 | 0.333 | 0.009 | ||||||||
| fbmy8028_rel_native_lto.cay9c1g | 99.639 | 0.333 | 0.028 | 0.017 |
Performance metrics for the DBMS listed above. Some are normalized by throughput, others are not. Legend for results is here.
ips	qps	rps	rmbps	wps	wmbps	rpq	rkbpq	wpi	wkbpi	csps	cpups	cspq	cpupq	dbgb1	dbgb2	rss	maxop	p50	p99	tag
100	2566	0	0.0	3.8	0.2	0.000	0.000	0.038	2.201	9911	13.3	3.862	415	2.8	4.6	1.6	0.003	2557	2429	20m.fbmy5635_rel.cay9c1g
100	2312	0	0.0	3.5	0.1	0.000	0.000	0.035	1.239	9103	14.1	3.937	488	2.8	4.7	2.0	0.003	2253	2110	20m.fbmy8028_rel_native_lto.cay9c1g
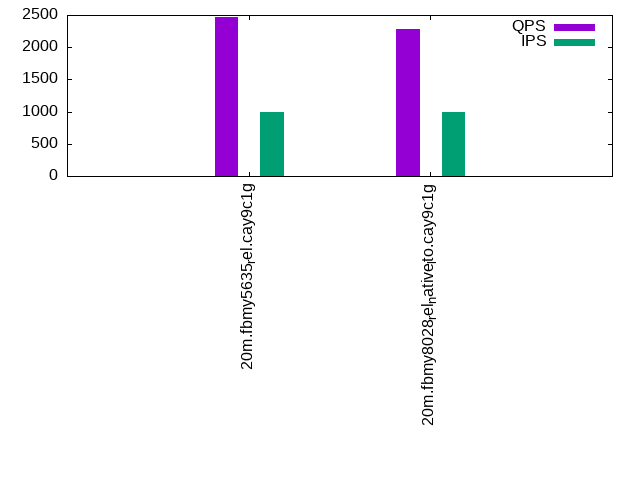
q500.1
q500.1: range queries with 500 insert/s per client. Graphs for performance per 1-second interval are here.
Average throughput:
Query response time histogram: each cell has the percentage of responses that take <= the time in the header and max is the max response time in seconds. For max values in the top 25% of the range have a red background and in the bottom 25% of the range have a green background. The red background is not used when the min value is within 80% of the max value.
| dbms | 256us | 1ms | 4ms | 16ms | 64ms | 256ms | 1s | 4s | 16s | gt | max |
|---|---|---|---|---|---|---|---|---|---|---|---|
| fbmy5635_rel.cay9c1g | 0.901 | 99.099 | nonzero | nonzero | 0.005 | ||||||
| fbmy8028_rel_native_lto.cay9c1g | 0.831 | 99.168 | 0.001 | 0.003 |
Insert response time histogram: each cell has the percentage of responses that take <= the time in the header and max is the max response time in seconds. For max values in the top 25% of the range have a red background and in the bottom 25% of the range have a green background. The red background is not used when the min value is within 80% of the max value.
| dbms | 256us | 1ms | 4ms | 16ms | 64ms | 256ms | 1s | 4s | 16s | gt | max |
|---|---|---|---|---|---|---|---|---|---|---|---|
| fbmy5635_rel.cay9c1g | 99.722 | 0.278 | 0.009 | ||||||||
| fbmy8028_rel_native_lto.cay9c1g | 99.611 | 0.344 | 0.044 | 0.018 |
Performance metrics for the DBMS listed above. Some are normalized by throughput, others are not. Legend for results is here.
ips	qps	rps	rmbps	wps	wmbps	rpq	rkbpq	wpi	wkbpi	csps	cpups	cspq	cpupq	dbgb1	dbgb2	rss	maxop	p50	p99	tag
499	2456	0	0.0	3.7	0.3	0.000	0.000	0.007	0.568	9561	13.3	3.892	433	2.9	4.8	1.4	0.005	2445	2301	20m.fbmy5635_rel.cay9c1g
499	2331	0	0.0	3.8	0.3	0.000	0.000	0.008	0.571	9238	13.9	3.964	477	2.9	5.0	1.9	0.003	2301	2062	20m.fbmy8028_rel_native_lto.cay9c1g
q1000.1
q1000.1: range queries with 1000 insert/s per client. Graphs for performance per 1-second interval are here.
Average throughput:
Query response time histogram: each cell has the percentage of responses that take <= the time in the header and max is the max response time in seconds. For max values in the top 25% of the range have a red background and in the bottom 25% of the range have a green background. The red background is not used when the min value is within 80% of the max value.
| dbms | 256us | 1ms | 4ms | 16ms | 64ms | 256ms | 1s | 4s | 16s | gt | max |
|---|---|---|---|---|---|---|---|---|---|---|---|
| fbmy5635_rel.cay9c1g | 1.117 | 98.883 | nonzero | 0.003 | |||||||
| fbmy8028_rel_native_lto.cay9c1g | 0.678 | 99.321 | nonzero | nonzero | 0.004 |
Insert response time histogram: each cell has the percentage of responses that take <= the time in the header and max is the max response time in seconds. For max values in the top 25% of the range have a red background and in the bottom 25% of the range have a green background. The red background is not used when the min value is within 80% of the max value.
| dbms | 256us | 1ms | 4ms | 16ms | 64ms | 256ms | 1s | 4s | 16s | gt | max |
|---|---|---|---|---|---|---|---|---|---|---|---|
| fbmy5635_rel.cay9c1g | 99.761 | 0.239 | 0.011 | ||||||||
| fbmy8028_rel_native_lto.cay9c1g | 99.619 | 0.342 | 0.039 | 0.018 |
Performance metrics for the DBMS listed above. Some are normalized by throughput, others are not. Legend for results is here.
ips	qps	rps	rmbps	wps	wmbps	rpq	rkbpq	wpi	wkbpi	csps	cpups	cspq	cpupq	dbgb1	dbgb2	rss	maxop	p50	p99	tag
998	2465	0	0.0	5.0	0.8	0.000	0.000	0.005	0.796	9697	14.1	3.934	458	3.1	3.2	1.3	0.003	2461	2301	20m.fbmy5635_rel.cay9c1g
998	2276	0	0.0	5.0	0.8	0.000	0.000	0.005	0.793	9130	14.3	4.010	503	3.1	3.4	1.9	0.004	2253	2030	20m.fbmy8028_rel_native_lto.cay9c1g
l.i0
l.i0: load without secondary indexes
Performance metrics for all DBMS, not just the ones listed above. Some are normalized by throughput, others are not. Legend for results is here.
ips	qps	rps	rmbps	wps	wmbps	rpq	rkbpq	wpi	wkbpi	csps	cpups	cspq	cpupq	dbgb1	dbgb2	rss	maxop	p50	p99	tag
77821	0	0	0.0	38.1	13.2	0.000	0.000	0.000	0.174	7656	23.3	0.098	24	0.7	1.8	0.2	0.065	78614	71619	20m.fbmy5635_rel.cay9c1g
60790	0	0	0.0	38.0	11.8	0.000	0.000	0.001	0.199	6291	23.2	0.103	31	0.7	1.9	0.6	0.074	61328	54338	20m.fbmy8028_rel_native_lto.cay9c1g
l.x
l.x: create secondary indexes
Performance metrics for all DBMS, not just the ones listed above. Some are normalized by throughput, others are not. Legend for results is here.
ips	qps	rps	rmbps	wps	wmbps	rpq	rkbpq	wpi	wkbpi	csps	cpups	cspq	cpupq	dbgb1	dbgb2	rss	maxop	p50	p99	tag
81376	0	0	0.0	32.1	12.4	0.000	0.000	0.000	0.156	244	12.7	0.003	12	1.5	2.5	1.2	0.007	NA	NA	20m.fbmy5635_rel.cay9c1g
76426	0	0	0.0	29.8	11.6	0.000	0.000	0.000	0.155	402	13.4	0.005	14	1.4	2.7	1.9	0.008	NA	NA	20m.fbmy8028_rel_native_lto.cay9c1g
l.i1
l.i1: continue load after secondary indexes created
Performance metrics for all DBMS, not just the ones listed above. Some are normalized by throughput, others are not. Legend for results is here.
ips	qps	rps	rmbps	wps	wmbps	rpq	rkbpq	wpi	wkbpi	csps	cpups	cspq	cpupq	dbgb1	dbgb2	rss	maxop	p50	p99	tag
29498	0	9	1.1	75.0	29.6	0.000	0.038	0.003	1.027	6221	28.9	0.211	78	2.9	4.7	1.3	0.081	29233	26121	20m.fbmy5635_rel.cay9c1g
25543	0	8	0.9	68.5	26.5	0.000	0.038	0.003	1.062	5669	27.8	0.222	87	2.8	4.7	1.7	0.073	25422	22624	20m.fbmy8028_rel_native_lto.cay9c1g
q100.1
q100.1: range queries with 100 insert/s per client
Performance metrics for all DBMS, not just the ones listed above. Some are normalized by throughput, others are not. Legend for results is here.
ips	qps	rps	rmbps	wps	wmbps	rpq	rkbpq	wpi	wkbpi	csps	cpups	cspq	cpupq	dbgb1	dbgb2	rss	maxop	p50	p99	tag
100	2566	0	0.0	3.8	0.2	0.000	0.000	0.038	2.201	9911	13.3	3.862	415	2.8	4.6	1.6	0.003	2557	2429	20m.fbmy5635_rel.cay9c1g
100	2312	0	0.0	3.5	0.1	0.000	0.000	0.035	1.239	9103	14.1	3.937	488	2.8	4.7	2.0	0.003	2253	2110	20m.fbmy8028_rel_native_lto.cay9c1g
q500.1
q500.1: range queries with 500 insert/s per client
Performance metrics for all DBMS, not just the ones listed above. Some are normalized by throughput, others are not. Legend for results is here.
ips	qps	rps	rmbps	wps	wmbps	rpq	rkbpq	wpi	wkbpi	csps	cpups	cspq	cpupq	dbgb1	dbgb2	rss	maxop	p50	p99	tag
499	2456	0	0.0	3.7	0.3	0.000	0.000	0.007	0.568	9561	13.3	3.892	433	2.9	4.8	1.4	0.005	2445	2301	20m.fbmy5635_rel.cay9c1g
499	2331	0	0.0	3.8	0.3	0.000	0.000	0.008	0.571	9238	13.9	3.964	477	2.9	5.0	1.9	0.003	2301	2062	20m.fbmy8028_rel_native_lto.cay9c1g
q1000.1
q1000.1: range queries with 1000 insert/s per client
Performance metrics for all DBMS, not just the ones listed above. Some are normalized by throughput, others are not. Legend for results is here.
ips	qps	rps	rmbps	wps	wmbps	rpq	rkbpq	wpi	wkbpi	csps	cpups	cspq	cpupq	dbgb1	dbgb2	rss	maxop	p50	p99	tag
998	2465	0	0.0	5.0	0.8	0.000	0.000	0.005	0.796	9697	14.1	3.934	458	3.1	3.2	1.3	0.003	2461	2301	20m.fbmy5635_rel.cay9c1g
998	2276	0	0.0	5.0	0.8	0.000	0.000	0.005	0.793	9130	14.3	4.010	503	3.1	3.4	1.9	0.004	2253	2030	20m.fbmy8028_rel_native_lto.cay9c1g
l.i0
- l.i0: load without secondary indexes
- Legend for results is here.
- Each entry lists the percentage of responses that fit in that bucket (slower than max time for previous bucket, faster than min time for next bucket).
Insert response time histogram
256us	1ms	4ms	16ms	64ms	256ms	1s	4s	16s	gt	max	tag
0.000	0.000	99.869	0.128	0.003	0.001	0.000	0.000	0.000	0.000	0.065	fbmy5635_rel.cay9c1g
0.000	0.000	99.733	0.192	0.073	0.003	0.000	0.000	0.000	0.000	0.074	fbmy8028_rel_native_lto.cay9c1g
l.x
- l.x: create secondary indexes
- Legend for results is here.
- Each entry lists the percentage of responses that fit in that bucket (slower than max time for previous bucket, faster than min time for next bucket).
TODO - determine whether there is data for create index response time
l.i1
- l.i1: continue load after secondary indexes created
- Legend for results is here.
- Each entry lists the percentage of responses that fit in that bucket (slower than max time for previous bucket, faster than min time for next bucket).
Insert response time histogram
256us	1ms	4ms	16ms	64ms	256ms	1s	4s	16s	gt	max	tag
0.000	0.000	99.827	0.169	0.003	nonzero	0.000	0.000	0.000	0.000	0.081	fbmy5635_rel.cay9c1g
0.000	0.000	99.749	0.214	0.036	nonzero	0.000	0.000	0.000	0.000	0.073	fbmy8028_rel_native_lto.cay9c1g
q100.1
- q100.1: range queries with 100 insert/s per client
- Legend for results is here.
- Each entry lists the percentage of responses that fit in that bucket (slower than max time for previous bucket, faster than min time for next bucket).
Query response time histogram
256us	1ms	4ms	16ms	64ms	256ms	1s	4s	16s	gt	max	tag
1.269	98.731	0.001	0.000	0.000	0.000	0.000	0.000	0.000	0.000	0.003	fbmy5635_rel.cay9c1g
0.929	99.070	0.001	0.000	0.000	0.000	0.000	0.000	0.000	0.000	0.003	fbmy8028_rel_native_lto.cay9c1g
Insert response time histogram
256us	1ms	4ms	16ms	64ms	256ms	1s	4s	16s	gt	max	tag
0.000	0.000	99.667	0.333	0.000	0.000	0.000	0.000	0.000	0.000	0.009	fbmy5635_rel.cay9c1g
0.000	0.000	99.639	0.333	0.028	0.000	0.000	0.000	0.000	0.000	0.017	fbmy8028_rel_native_lto.cay9c1g
q500.1
- q500.1: range queries with 500 insert/s per client
- Legend for results is here.
- Each entry lists the percentage of responses that fit in that bucket (slower than max time for previous bucket, faster than min time for next bucket).
Query response time histogram
256us	1ms	4ms	16ms	64ms	256ms	1s	4s	16s	gt	max	tag
0.901	99.099	nonzero	nonzero	0.000	0.000	0.000	0.000	0.000	0.000	0.005	fbmy5635_rel.cay9c1g
0.831	99.168	0.001	0.000	0.000	0.000	0.000	0.000	0.000	0.000	0.003	fbmy8028_rel_native_lto.cay9c1g
Insert response time histogram
256us	1ms	4ms	16ms	64ms	256ms	1s	4s	16s	gt	max	tag
0.000	0.000	99.722	0.278	0.000	0.000	0.000	0.000	0.000	0.000	0.009	fbmy5635_rel.cay9c1g
0.000	0.000	99.611	0.344	0.044	0.000	0.000	0.000	0.000	0.000	0.018	fbmy8028_rel_native_lto.cay9c1g
q1000.1
- q1000.1: range queries with 1000 insert/s per client
- Legend for results is here.
- Each entry lists the percentage of responses that fit in that bucket (slower than max time for previous bucket, faster than min time for next bucket).
Query response time histogram
256us	1ms	4ms	16ms	64ms	256ms	1s	4s	16s	gt	max	tag
1.117	98.883	nonzero	0.000	0.000	0.000	0.000	0.000	0.000	0.000	0.003	fbmy5635_rel.cay9c1g
0.678	99.321	nonzero	nonzero	0.000	0.000	0.000	0.000	0.000	0.000	0.004	fbmy8028_rel_native_lto.cay9c1g
Insert response time histogram
256us	1ms	4ms	16ms	64ms	256ms	1s	4s	16s	gt	max	tag
0.000	0.000	99.761	0.239	0.000	0.000	0.000	0.000	0.000	0.000	0.011	fbmy5635_rel.cay9c1g
0.000	0.000	99.619	0.342	0.039	0.000	0.000	0.000	0.000	0.000	0.018	fbmy8028_rel_native_lto.cay9c1g