Introduction
This is a report for the insert benchmark with 400M docs and 20 client(s). It is generated by scripts (bash, awk, sed) and Tufte might not be impressed. An overview of the insert benchmark is here and a short update is here. Below, by DBMS, I mean DBMS+version.config. An example is my8020.c10b40 where my means MySQL, 8020 is version 8.0.20 and c10b40 is the name for the configuration file.
The test server is a c2-standard-60 from GCP with 30 cores, hyperthreading disabled, 240G RAM and 3T from XFS and SW RAID 0 striped over 8 local NVMe drives. The benchmark was run with 20 clients and there were 1 or 2 connections per client (1 for queries, 1 for inserts). The benchmark loads 400M rows without secondary indexes, creates secondary indexes, loads another 400M rows then does 3 read+write tests for one hour each that do queries as fast as possible with 100, 500 and then 1000 writes/second/client concurrent with the queries. Each read-write test runs for 1800 seconds. The test was configured to use a table per client. The database fits in the DBMS buffer pool. Clients and the DBMS share one server. The per-database configs are in the per-database subdirectories here.
The tested DBMS are:
- pg1119_o3_native_lto.cx7_gcp_c2s60 - Postgres 11.19, the cx7_gcp_c2s60 config and a build that uses -O3 -march=native -mtune=native -flto (link-time optimization)
- pg1214_o3_native_lto.cx7_gcp_c2s60 - Postgres 12.14, the cx7_gcp_c2s60 config and a build that uses -O3 -march=native -mtune=native -flto (link-time optimization)
- pg1310_o3_native_lto.cx7_gcp_c2s60 - Postgres 13.10, the cx7_gcp_c2s60 config and a build that uses -O3 -march=native -mtune=native -flto (link-time optimization)
- pg147_o3_native_lto.cx7_gcp_c2s60 - Postgres 14.7, the cx7_gcp_c2s60 config and a build that uses -O3 -march=native -mtune=native -flto (link-time optimization)
- pg151_o3_native_lto.cx7_gcp_c2s60 - Postgres 15.1, the cx7_gcp_c2s60 config and a build that uses -O3 -march=native -mtune=native -flto (link-time optimization)
- pg152_o3_native_lto.cx7_gcp_c2s60 - Postgres 15.2, the cx7_gcp_c2s60 config and a build that uses -O3 -march=native -mtune=native -flto (link-time optimization)
Contents
- Summary
- l.i0: load without secondary indexes
- l.x: create secondary indexes
- l.i1: continue load after secondary indexes created
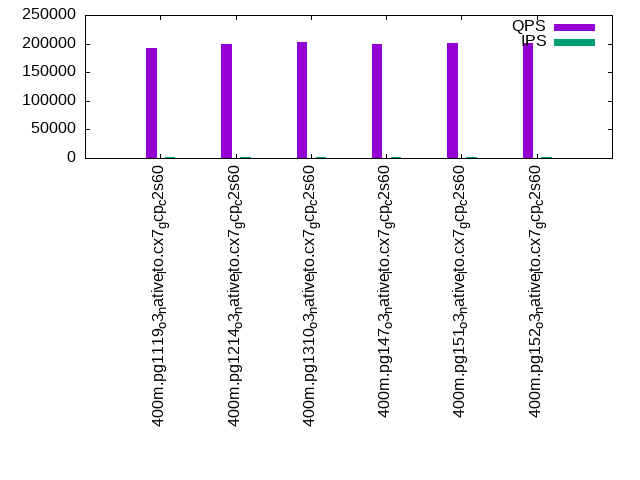
- q100.1: range queries with 100 insert/s per client
- q500.1: range queries with 500 insert/s per client
- q1000.1: range queries with 1000 insert/s per client
Summary
The numbers are inserts/s for l.i0 and l.i1, indexed docs (or rows) /s for l.x and queries/s for q*.2. The values are the average rate over the entire test for inserts (IPS) and queries (QPS). The range of values for IPS and QPS is split into 3 parts: bottom 25%, middle 50%, top 25%. Values in the bottom 25% have a red background, values in the top 25% have a green background and values in the middle have no color. A gray background is used for values that can be ignored because the DBMS did not sustain the target insert rate. Red backgrounds are not used when the minimum value is within 80% of the max value.
| dbms | l.i0 | l.x | l.i1 | q100.1 | q500.1 | q1000.1 |
|---|---|---|---|---|---|---|
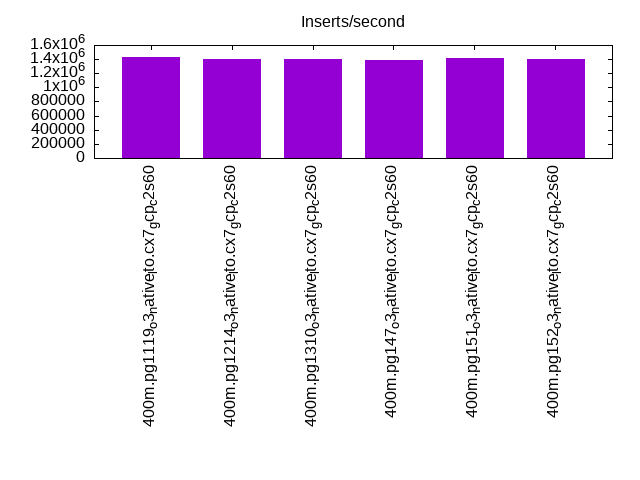
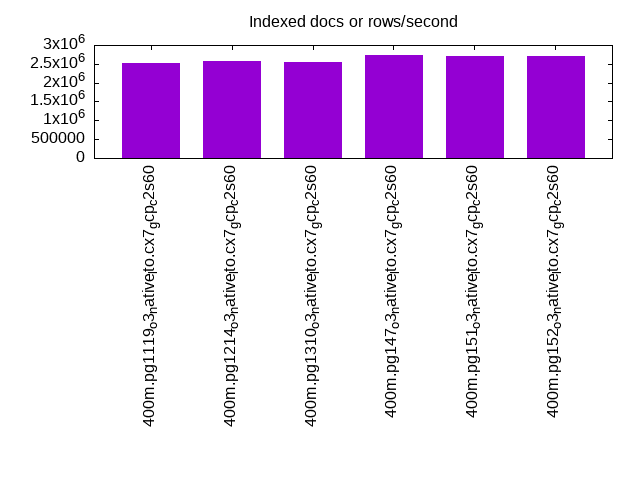
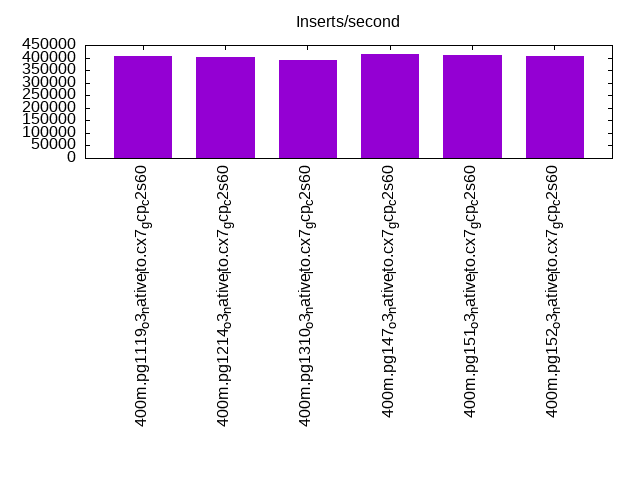
| 400m.pg1119_o3_native_lto.cx7_gcp_c2s60 | 1428571 | 2516352 | 406918 | 191643 | 193929 | 195925 |
| 400m.pg1214_o3_native_lto.cx7_gcp_c2s60 | 1403509 | 2564744 | 403226 | 198992 | 200609 | 204408 |
| 400m.pg1310_o3_native_lto.cx7_gcp_c2s60 | 1398601 | 2548408 | 391007 | 202283 | 202002 | 206280 |
| 400m.pg147_o3_native_lto.cx7_gcp_c2s60 | 1393728 | 2721769 | 413223 | 199384 | 201572 | 205260 |
| 400m.pg151_o3_native_lto.cx7_gcp_c2s60 | 1413428 | 2703378 | 411523 | 200643 | 202892 | 206586 |
| 400m.pg152_o3_native_lto.cx7_gcp_c2s60 | 1403509 | 2703378 | 408163 | 200679 | 201426 | 205134 |
This lists the average rate of inserts/s for the tests that do inserts concurrent with queries. For such tests the query rate is listed in the table above. The read+write tests are setup so that the insert rate should match the target rate every second. Cells that are not at least 95% of the target have a red background to indicate a failure to satisfy the target.
| dbms | q100.1 | q500.1 | q1000.1 |
|---|---|---|---|
| pg1119_o3_native_lto.cx7_gcp_c2s60 | 1976 | 9885 | 19748 |
| pg1214_o3_native_lto.cx7_gcp_c2s60 | 1976 | 9885 | 19769 |
| pg1310_o3_native_lto.cx7_gcp_c2s60 | 1976 | 9885 | 19769 |
| pg147_o3_native_lto.cx7_gcp_c2s60 | 1976 | 9885 | 19769 |
| pg151_o3_native_lto.cx7_gcp_c2s60 | 1976 | 9885 | 19769 |
| pg152_o3_native_lto.cx7_gcp_c2s60 | 1976 | 9885 | 19769 |
| target | 2000 | 10000 | 20000 |
l.i0
l.i0: load without secondary indexes. Graphs for performance per 1-second interval are here.
Average throughput:
Insert response time histogram: each cell has the percentage of responses that take <= the time in the header and max is the max response time in seconds. For the max column values in the top 25% of the range have a red background and in the bottom 25% of the range have a green background. The red background is not used when the min value is within 80% of the max value.
| dbms | 256us | 1ms | 4ms | 16ms | 64ms | 256ms | 1s | 4s | 16s | gt | max |
|---|---|---|---|---|---|---|---|---|---|---|---|
| pg1119_o3_native_lto.cx7_gcp_c2s60 | 60.984 | 38.162 | 0.805 | 0.013 | 0.024 | 0.013 | 0.756 | ||||
| pg1214_o3_native_lto.cx7_gcp_c2s60 | 59.796 | 39.346 | 0.799 | 0.026 | 0.020 | 0.014 | 0.913 | ||||
| pg1310_o3_native_lto.cx7_gcp_c2s60 | 58.623 | 40.556 | 0.776 | 0.012 | 0.019 | 0.013 | 0.780 | ||||
| pg147_o3_native_lto.cx7_gcp_c2s60 | 58.688 | 40.467 | 0.793 | 0.018 | 0.020 | 0.014 | 0.765 | ||||
| pg151_o3_native_lto.cx7_gcp_c2s60 | 59.717 | 39.458 | 0.775 | 0.014 | 0.023 | 0.014 | 0.637 | ||||
| pg152_o3_native_lto.cx7_gcp_c2s60 | 58.790 | 40.412 | 0.743 | 0.018 | 0.022 | 0.015 | 0.605 |
Performance metrics for the DBMS listed above. Some are normalized by throughput, others are not. Legend for results is here.
ips	qps	rps	rmbps	wps	wmbps	rpq	rkbpq	wpi	wkbpi	csps	cpups	cspq	cpupq	dbgb1	dbgb2	rss	maxop	p50	p99	tag
1428571	0	0	0.0	1878.0	470.4	0.000	0.000	0.001	0.337	236836	59.9	0.166	13	38.3	103.2	NA	0.756	81410	8391	400m.pg1119_o3_native_lto.cx7_gcp_c2s60
1403509	0	0	0.0	1842.3	466.1	0.000	0.000	0.001	0.340	232757	59.6	0.166	13	38.3	103.2	NA	0.913	79746	14484	400m.pg1214_o3_native_lto.cx7_gcp_c2s60
1398601	0	0	0.0	1880.2	466.2	0.000	0.000	0.001	0.341	252982	59.4	0.181	13	38.3	103.4	NA	0.780	79589	7392	400m.pg1310_o3_native_lto.cx7_gcp_c2s60
1393728	0	0	0.0	1837.9	462.7	0.000	0.000	0.001	0.340	242816	59.7	0.174	13	38.3	103.4	NA	0.765	78315	9689	400m.pg147_o3_native_lto.cx7_gcp_c2s60
1413428	0	0	0.0	1897.1	467.4	0.000	0.000	0.001	0.339	243763	59.8	0.172	13	38.3	103.4	0.0	0.637	80746	12685	400m.pg151_o3_native_lto.cx7_gcp_c2s60
1403509	0	0	0.0	1862.6	465.8	0.000	0.000	0.001	0.340	256157	59.0	0.183	13	38.3	103.4	0.0	0.605	79014	9590	400m.pg152_o3_native_lto.cx7_gcp_c2s60
l.x
l.x: create secondary indexes.
Average throughput:
Performance metrics for the DBMS listed above. Some are normalized by throughput, others are not. Legend for results is here.
ips	qps	rps	rmbps	wps	wmbps	rpq	rkbpq	wpi	wkbpi	csps	cpups	cspq	cpupq	dbgb1	dbgb2	rss	maxop	p50	p99	tag
2516352	0	7029	107.3	3445.1	849.0	0.003	0.044	0.001	0.345	102102	24.8	0.041	3	73.5	170.5	0.0	0.052	NA	NA	400m.pg1119_o3_native_lto.cx7_gcp_c2s60
2564744	0	8411	112.9	3484.0	856.2	0.003	0.045	0.001	0.342	101553	25.1	0.040	3	73.5	170.5	0.0	0.314	NA	NA	400m.pg1214_o3_native_lto.cx7_gcp_c2s60
2548408	0	9905	112.1	3471.0	851.8	0.004	0.045	0.001	0.342	103215	25.1	0.041	3	73.5	170.7	0.0	0.399	NA	NA	400m.pg1310_o3_native_lto.cx7_gcp_c2s60
2721769	0	5266	95.7	3202.6	801.5	0.002	0.036	0.001	0.302	106331	26.7	0.039	3	73.5	170.7	0.0	0.249	NA	NA	400m.pg147_o3_native_lto.cx7_gcp_c2s60
2703378	0	6568	99.7	3275.0	828.7	0.002	0.038	0.001	0.314	109170	26.1	0.040	3	73.5	171.7	0.0	0.103	NA	NA	400m.pg151_o3_native_lto.cx7_gcp_c2s60
2703378	0	9760	107.1	3243.2	830.7	0.004	0.041	0.001	0.315	108973	26.0	0.040	3	73.5	171.7	0.0	0.055	NA	NA	400m.pg152_o3_native_lto.cx7_gcp_c2s60
l.i1
l.i1: continue load after secondary indexes created. Graphs for performance per 1-second interval are here.
Average throughput:
Insert response time histogram: each cell has the percentage of responses that take <= the time in the header and max is the max response time in seconds. For the max column values in the top 25% of the range have a red background and in the bottom 25% of the range have a green background. The red background is not used when the min value is within 80% of the max value.
| dbms | 256us | 1ms | 4ms | 16ms | 64ms | 256ms | 1s | 4s | 16s | gt | max |
|---|---|---|---|---|---|---|---|---|---|---|---|
| pg1119_o3_native_lto.cx7_gcp_c2s60 | 0.010 | 96.127 | 2.179 | 1.641 | 0.033 | 0.010 | 0.796 | ||||
| pg1214_o3_native_lto.cx7_gcp_c2s60 | 0.004 | 96.022 | 2.295 | 1.631 | 0.040 | 0.008 | 0.819 | ||||
| pg1310_o3_native_lto.cx7_gcp_c2s60 | 0.035 | 95.889 | 2.323 | 1.704 | 0.038 | 0.012 | 0.969 | ||||
| pg147_o3_native_lto.cx7_gcp_c2s60 | 0.003 | 96.045 | 2.557 | 1.354 | 0.029 | 0.012 | nonzero | 1.058 | |||
| pg151_o3_native_lto.cx7_gcp_c2s60 | 0.003 | 95.882 | 2.722 | 1.350 | 0.028 | 0.014 | 0.802 | ||||
| pg152_o3_native_lto.cx7_gcp_c2s60 | 0.004 | 95.933 | 2.639 | 1.384 | 0.025 | 0.015 | nonzero | 1.073 |
Performance metrics for the DBMS listed above. Some are normalized by throughput, others are not. Legend for results is here.
ips	qps	rps	rmbps	wps	wmbps	rpq	rkbpq	wpi	wkbpi	csps	cpups	cspq	cpupq	dbgb1	dbgb2	rss	maxop	p50	p99	tag
406918	0	5063	45.3	3863.1	507.0	0.012	0.114	0.009	1.276	287873	50.4	0.707	37	165.8	323.6	NA	0.796	26421	1748	400m.pg1119_o3_native_lto.cx7_gcp_c2s60
403226	0	5405	44.7	3740.0	498.9	0.013	0.114	0.009	1.267	287816	50.4	0.714	37	163.1	318.3	0.0	0.819	26381	1798	400m.pg1214_o3_native_lto.cx7_gcp_c2s60
391007	0	4916	43.3	3570.6	495.2	0.013	0.113	0.009	1.297	308027	49.3	0.788	38	163.3	319.3	NA	0.969	25322	1798	400m.pg1310_o3_native_lto.cx7_gcp_c2s60
413223	0	5169	46.3	3193.8	527.4	0.013	0.115	0.008	1.307	305777	51.6	0.740	37	163.3	354.9	0.0	1.058	26332	1798	400m.pg147_o3_native_lto.cx7_gcp_c2s60
411523	0	5480	42.4	3249.1	533.4	0.013	0.106	0.008	1.327	301967	51.2	0.734	37	163.3	357.5	NA	0.802	26022	1748	400m.pg151_o3_native_lto.cx7_gcp_c2s60
408163	0	5261	45.3	3288.3	523.9	0.013	0.114	0.008	1.314	313851	50.9	0.769	37	163.3	356.5	0.0	1.073	26071	1848	400m.pg152_o3_native_lto.cx7_gcp_c2s60
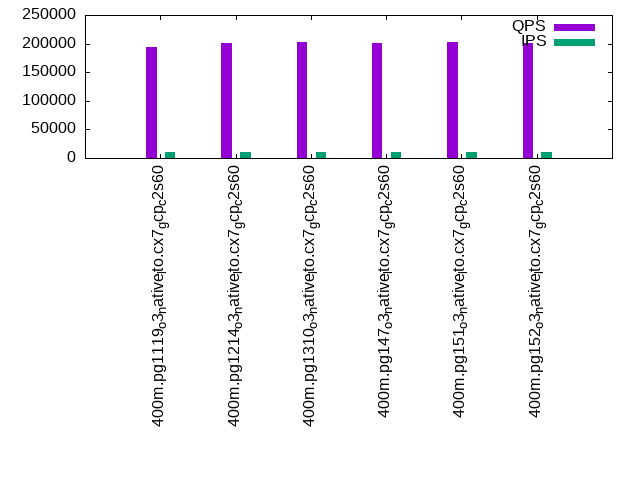
q100.1
q100.1: range queries with 100 insert/s per client. Graphs for performance per 1-second interval are here.
Average throughput:
Query response time histogram: each cell has the percentage of responses that take <= the time in the header and max is the max response time in seconds. For max values in the top 25% of the range have a red background and in the bottom 25% of the range have a green background. The red background is not used when the min value is within 80% of the max value.
| dbms | 256us | 1ms | 4ms | 16ms | 64ms | 256ms | 1s | 4s | 16s | gt | max |
|---|---|---|---|---|---|---|---|---|---|---|---|
| pg1119_o3_native_lto.cx7_gcp_c2s60 | 99.968 | 0.025 | 0.006 | 0.001 | nonzero | 0.024 | |||||
| pg1214_o3_native_lto.cx7_gcp_c2s60 | 99.974 | 0.019 | 0.006 | 0.001 | nonzero | 0.026 | |||||
| pg1310_o3_native_lto.cx7_gcp_c2s60 | 99.976 | 0.018 | 0.006 | 0.001 | nonzero | 0.024 | |||||
| pg147_o3_native_lto.cx7_gcp_c2s60 | 99.976 | 0.017 | 0.006 | 0.001 | nonzero | 0.034 | |||||
| pg151_o3_native_lto.cx7_gcp_c2s60 | 99.976 | 0.016 | 0.006 | 0.001 | nonzero | 0.026 | |||||
| pg152_o3_native_lto.cx7_gcp_c2s60 | 99.977 | 0.017 | 0.006 | 0.001 | nonzero | nonzero | 0.073 |
Insert response time histogram: each cell has the percentage of responses that take <= the time in the header and max is the max response time in seconds. For max values in the top 25% of the range have a red background and in the bottom 25% of the range have a green background. The red background is not used when the min value is within 80% of the max value.
| dbms | 256us | 1ms | 4ms | 16ms | 64ms | 256ms | 1s | 4s | 16s | gt | max |
|---|---|---|---|---|---|---|---|---|---|---|---|
| pg1119_o3_native_lto.cx7_gcp_c2s60 | 95.682 | 3.364 | 0.939 | 0.015 | 0.185 | ||||||
| pg1214_o3_native_lto.cx7_gcp_c2s60 | 92.583 | 5.903 | 1.514 | 0.051 | |||||||
| pg1310_o3_native_lto.cx7_gcp_c2s60 | 92.054 | 5.771 | 2.160 | 0.015 | 0.123 | ||||||
| pg147_o3_native_lto.cx7_gcp_c2s60 | 95.801 | 3.460 | 0.729 | 0.010 | 0.080 | ||||||
| pg151_o3_native_lto.cx7_gcp_c2s60 | 94.090 | 4.844 | 1.065 | 0.049 | |||||||
| pg152_o3_native_lto.cx7_gcp_c2s60 | 92.774 | 5.997 | 1.203 | 0.026 | 0.107 |
Performance metrics for the DBMS listed above. Some are normalized by throughput, others are not. Legend for results is here.
ips	qps	rps	rmbps	wps	wmbps	rpq	rkbpq	wpi	wkbpi	csps	cpups	cspq	cpupq	dbgb1	dbgb2	rss	maxop	p50	p99	tag
1976	191643	0	0.0	3998.1	98.2	0.000	0.000	2.024	50.878	679241	63.0	3.544	99	166.6	292.5	0.0	0.024	9541	9142	400m.pg1119_o3_native_lto.cx7_gcp_c2s60
1976	198992	0	0.0	3991.6	97.0	0.000	0.000	2.020	50.280	705444	62.9	3.545	95	163.6	286.7	0.0	0.026	9877	9429	400m.pg1214_o3_native_lto.cx7_gcp_c2s60
1976	202283	0	0.0	3707.8	88.8	0.000	0.000	1.877	46.009	716261	62.9	3.541	93	163.9	266.0	0.0	0.024	9962	9541	400m.pg1310_o3_native_lto.cx7_gcp_c2s60
1976	199384	0	0.0	3561.0	85.1	0.000	0.000	1.802	44.107	710578	62.6	3.564	94	163.9	323.4	0.0	0.034	9909	9509	400m.pg147_o3_native_lto.cx7_gcp_c2s60
1976	200643	0	0.0	3578.3	85.3	0.000	0.000	1.811	44.205	714355	62.8	3.560	94	163.9	326.0	0.0	0.026	9973	9605	400m.pg151_o3_native_lto.cx7_gcp_c2s60
1976	200679	0	0.0	3577.9	85.1	0.000	0.000	1.811	44.109	714310	62.7	3.559	94	163.9	325.0	0.0	0.073	10041	9653	400m.pg152_o3_native_lto.cx7_gcp_c2s60
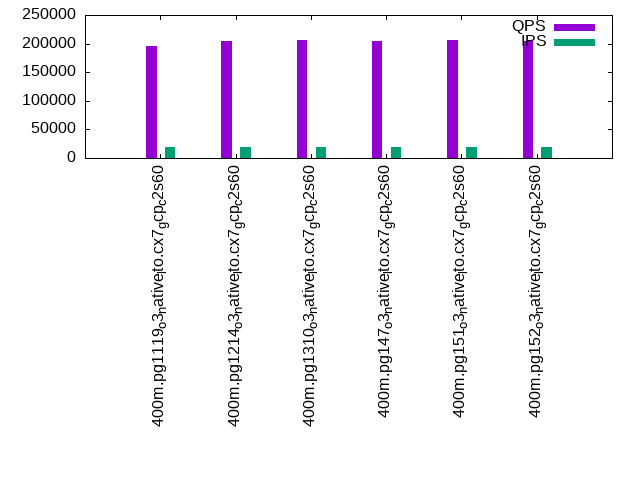
q500.1
q500.1: range queries with 500 insert/s per client. Graphs for performance per 1-second interval are here.
Average throughput:
Query response time histogram: each cell has the percentage of responses that take <= the time in the header and max is the max response time in seconds. For max values in the top 25% of the range have a red background and in the bottom 25% of the range have a green background. The red background is not used when the min value is within 80% of the max value.
| dbms | 256us | 1ms | 4ms | 16ms | 64ms | 256ms | 1s | 4s | 16s | gt | max |
|---|---|---|---|---|---|---|---|---|---|---|---|
| pg1119_o3_native_lto.cx7_gcp_c2s60 | 99.906 | 0.061 | 0.029 | 0.004 | nonzero | 0.053 | |||||
| pg1214_o3_native_lto.cx7_gcp_c2s60 | 99.913 | 0.055 | 0.029 | 0.003 | nonzero | 0.060 | |||||
| pg1310_o3_native_lto.cx7_gcp_c2s60 | 99.915 | 0.054 | 0.028 | 0.003 | nonzero | 0.063 | |||||
| pg147_o3_native_lto.cx7_gcp_c2s60 | 99.915 | 0.053 | 0.028 | 0.004 | nonzero | 0.059 | |||||
| pg151_o3_native_lto.cx7_gcp_c2s60 | 99.917 | 0.052 | 0.028 | 0.004 | nonzero | 0.056 | |||||
| pg152_o3_native_lto.cx7_gcp_c2s60 | 99.916 | 0.053 | 0.028 | 0.004 | nonzero | nonzero | 0.067 |
Insert response time histogram: each cell has the percentage of responses that take <= the time in the header and max is the max response time in seconds. For max values in the top 25% of the range have a red background and in the bottom 25% of the range have a green background. The red background is not used when the min value is within 80% of the max value.
| dbms | 256us | 1ms | 4ms | 16ms | 64ms | 256ms | 1s | 4s | 16s | gt | max |
|---|---|---|---|---|---|---|---|---|---|---|---|
| pg1119_o3_native_lto.cx7_gcp_c2s60 | 43.888 | 25.996 | 28.537 | 1.577 | 0.002 | 0.326 | |||||
| pg1214_o3_native_lto.cx7_gcp_c2s60 | 43.562 | 26.406 | 28.512 | 1.521 | 0.001 | 0.327 | |||||
| pg1310_o3_native_lto.cx7_gcp_c2s60 | 44.383 | 25.768 | 28.405 | 1.444 | 0.236 | ||||||
| pg147_o3_native_lto.cx7_gcp_c2s60 | 44.914 | 24.447 | 29.331 | 1.308 | 0.207 | ||||||
| pg151_o3_native_lto.cx7_gcp_c2s60 | 45.407 | 24.647 | 28.690 | 1.255 | 0.002 | 0.357 | |||||
| pg152_o3_native_lto.cx7_gcp_c2s60 | 45.207 | 24.648 | 28.909 | 1.235 | 0.187 |
Performance metrics for the DBMS listed above. Some are normalized by throughput, others are not. Legend for results is here.
ips	qps	rps	rmbps	wps	wmbps	rpq	rkbpq	wpi	wkbpi	csps	cpups	cspq	cpupq	dbgb1	dbgb2	rss	maxop	p50	p99	tag
9885	193929	0	0.0	6879.7	212.6	0.000	0.000	0.696	22.025	672766	64.1	3.469	99	171.6	260.9	0.0	0.053	9625	9110	400m.pg1119_o3_native_lto.cx7_gcp_c2s60
9885	200609	0	0.0	6441.9	210.8	0.000	0.000	0.652	21.833	698168	63.9	3.480	96	167.2	255.0	0.0	0.060	9909	9365	400m.pg1214_o3_native_lto.cx7_gcp_c2s60
9885	202002	0	0.0	6179.4	204.8	0.000	0.000	0.625	21.217	703278	63.9	3.482	95	167.5	244.9	0.0	0.063	10053	9510	400m.pg1310_o3_native_lto.cx7_gcp_c2s60
9885	201572	0	0.0	6390.1	196.8	0.000	0.000	0.646	20.389	705063	63.7	3.498	95	167.4	271.7	0.0	0.059	9989	9446	400m.pg147_o3_native_lto.cx7_gcp_c2s60
9885	202892	0	0.0	6350.4	195.9	0.000	0.000	0.642	20.294	708623	63.8	3.493	94	167.4	272.3	0.0	0.056	10069	9530	400m.pg151_o3_native_lto.cx7_gcp_c2s60
9885	201426	0	0.0	6271.8	194.8	0.000	0.000	0.634	20.180	704068	63.8	3.495	95	167.5	270.9	0.0	0.067	10005	9494	400m.pg152_o3_native_lto.cx7_gcp_c2s60
q1000.1
q1000.1: range queries with 1000 insert/s per client. Graphs for performance per 1-second interval are here.
Average throughput:
Query response time histogram: each cell has the percentage of responses that take <= the time in the header and max is the max response time in seconds. For max values in the top 25% of the range have a red background and in the bottom 25% of the range have a green background. The red background is not used when the min value is within 80% of the max value.
| dbms | 256us | 1ms | 4ms | 16ms | 64ms | 256ms | 1s | 4s | 16s | gt | max |
|---|---|---|---|---|---|---|---|---|---|---|---|
| pg1119_o3_native_lto.cx7_gcp_c2s60 | 99.842 | 0.108 | 0.043 | 0.007 | nonzero | nonzero | nonzero | 0.420 | |||
| pg1214_o3_native_lto.cx7_gcp_c2s60 | 99.855 | 0.095 | 0.042 | 0.007 | 0.001 | nonzero | 0.083 | ||||
| pg1310_o3_native_lto.cx7_gcp_c2s60 | 99.855 | 0.095 | 0.042 | 0.007 | 0.001 | nonzero | 0.093 | ||||
| pg147_o3_native_lto.cx7_gcp_c2s60 | 99.860 | 0.092 | 0.041 | 0.007 | nonzero | nonzero | 0.086 | ||||
| pg151_o3_native_lto.cx7_gcp_c2s60 | 99.863 | 0.089 | 0.041 | 0.007 | nonzero | 0.060 | |||||
| pg152_o3_native_lto.cx7_gcp_c2s60 | 99.860 | 0.092 | 0.041 | 0.007 | nonzero | nonzero | 0.092 |
Insert response time histogram: each cell has the percentage of responses that take <= the time in the header and max is the max response time in seconds. For max values in the top 25% of the range have a red background and in the bottom 25% of the range have a green background. The red background is not used when the min value is within 80% of the max value.
| dbms | 256us | 1ms | 4ms | 16ms | 64ms | 256ms | 1s | 4s | 16s | gt | max |
|---|---|---|---|---|---|---|---|---|---|---|---|
| pg1119_o3_native_lto.cx7_gcp_c2s60 | 66.971 | 17.617 | 14.687 | 0.716 | 0.005 | 0.004 | 2.446 | ||||
| pg1214_o3_native_lto.cx7_gcp_c2s60 | 56.757 | 22.223 | 19.875 | 1.146 | 0.231 | ||||||
| pg1310_o3_native_lto.cx7_gcp_c2s60 | 56.539 | 21.159 | 20.734 | 1.567 | 0.001 | 0.278 | |||||
| pg147_o3_native_lto.cx7_gcp_c2s60 | 58.709 | 21.450 | 18.923 | 0.918 | 0.218 | ||||||
| pg151_o3_native_lto.cx7_gcp_c2s60 | 59.319 | 21.184 | 18.631 | 0.866 | 0.209 | ||||||
| pg152_o3_native_lto.cx7_gcp_c2s60 | 58.283 | 21.704 | 19.109 | 0.904 | 0.208 |
Performance metrics for the DBMS listed above. Some are normalized by throughput, others are not. Legend for results is here.
ips	qps	rps	rmbps	wps	wmbps	rpq	rkbpq	wpi	wkbpi	csps	cpups	cspq	cpupq	dbgb1	dbgb2	rss	maxop	p50	p99	tag
19748	195925	63	0.5	6516.3	297.0	0.000	0.003	0.330	15.399	663899	65.4	3.389	100	185.4	268.1	0.0	0.420	9749	8966	400m.pg1119_o3_native_lto.cx7_gcp_c2s60
19769	204408	0	0.0	5542.4	296.4	0.000	0.000	0.280	15.351	690868	65.2	3.380	96	179.3	262.7	0.0	0.083	10149	9257	400m.pg1214_o3_native_lto.cx7_gcp_c2s60
19769	206280	0	0.0	5634.1	306.4	0.000	0.000	0.285	15.872	697095	65.1	3.379	95	179.6	259.6	0.0	0.093	10249	9302	400m.pg1310_o3_native_lto.cx7_gcp_c2s60
19769	205260	0	0.0	6299.3	265.5	0.000	0.000	0.319	13.751	697236	64.9	3.397	95	179.6	280.4	0.0	0.086	10216	9398	400m.pg147_o3_native_lto.cx7_gcp_c2s60
19769	206586	0	0.0	6302.9	266.1	0.000	0.000	0.319	13.783	701415	64.9	3.395	94	179.6	280.7	0.0	0.060	10293	9382	400m.pg151_o3_native_lto.cx7_gcp_c2s60
19769	205134	0	0.0	6333.6	267.9	0.000	0.000	0.320	13.876	696688	64.9	3.396	95	179.6	279.8	0.0	0.092	10153	9238	400m.pg152_o3_native_lto.cx7_gcp_c2s60
l.i0
l.i0: load without secondary indexes
Performance metrics for all DBMS, not just the ones listed above. Some are normalized by throughput, others are not. Legend for results is here.
ips	qps	rps	rmbps	wps	wmbps	rpq	rkbpq	wpi	wkbpi	csps	cpups	cspq	cpupq	dbgb1	dbgb2	rss	maxop	p50	p99	tag
1428571	0	0	0.0	1878.0	470.4	0.000	0.000	0.001	0.337	236836	59.9	0.166	13	38.3	103.2	NA	0.756	81410	8391	400m.pg1119_o3_native_lto.cx7_gcp_c2s60
1403509	0	0	0.0	1842.3	466.1	0.000	0.000	0.001	0.340	232757	59.6	0.166	13	38.3	103.2	NA	0.913	79746	14484	400m.pg1214_o3_native_lto.cx7_gcp_c2s60
1398601	0	0	0.0	1880.2	466.2	0.000	0.000	0.001	0.341	252982	59.4	0.181	13	38.3	103.4	NA	0.780	79589	7392	400m.pg1310_o3_native_lto.cx7_gcp_c2s60
1393728	0	0	0.0	1837.9	462.7	0.000	0.000	0.001	0.340	242816	59.7	0.174	13	38.3	103.4	NA	0.765	78315	9689	400m.pg147_o3_native_lto.cx7_gcp_c2s60
1413428	0	0	0.0	1897.1	467.4	0.000	0.000	0.001	0.339	243763	59.8	0.172	13	38.3	103.4	0.0	0.637	80746	12685	400m.pg151_o3_native_lto.cx7_gcp_c2s60
1403509	0	0	0.0	1862.6	465.8	0.000	0.000	0.001	0.340	256157	59.0	0.183	13	38.3	103.4	0.0	0.605	79014	9590	400m.pg152_o3_native_lto.cx7_gcp_c2s60
l.x
l.x: create secondary indexes
Performance metrics for all DBMS, not just the ones listed above. Some are normalized by throughput, others are not. Legend for results is here.
ips	qps	rps	rmbps	wps	wmbps	rpq	rkbpq	wpi	wkbpi	csps	cpups	cspq	cpupq	dbgb1	dbgb2	rss	maxop	p50	p99	tag
2516352	0	7029	107.3	3445.1	849.0	0.003	0.044	0.001	0.345	102102	24.8	0.041	3	73.5	170.5	0.0	0.052	NA	NA	400m.pg1119_o3_native_lto.cx7_gcp_c2s60
2564744	0	8411	112.9	3484.0	856.2	0.003	0.045	0.001	0.342	101553	25.1	0.040	3	73.5	170.5	0.0	0.314	NA	NA	400m.pg1214_o3_native_lto.cx7_gcp_c2s60
2548408	0	9905	112.1	3471.0	851.8	0.004	0.045	0.001	0.342	103215	25.1	0.041	3	73.5	170.7	0.0	0.399	NA	NA	400m.pg1310_o3_native_lto.cx7_gcp_c2s60
2721769	0	5266	95.7	3202.6	801.5	0.002	0.036	0.001	0.302	106331	26.7	0.039	3	73.5	170.7	0.0	0.249	NA	NA	400m.pg147_o3_native_lto.cx7_gcp_c2s60
2703378	0	6568	99.7	3275.0	828.7	0.002	0.038	0.001	0.314	109170	26.1	0.040	3	73.5	171.7	0.0	0.103	NA	NA	400m.pg151_o3_native_lto.cx7_gcp_c2s60
2703378	0	9760	107.1	3243.2	830.7	0.004	0.041	0.001	0.315	108973	26.0	0.040	3	73.5	171.7	0.0	0.055	NA	NA	400m.pg152_o3_native_lto.cx7_gcp_c2s60
l.i1
l.i1: continue load after secondary indexes created
Performance metrics for all DBMS, not just the ones listed above. Some are normalized by throughput, others are not. Legend for results is here.
ips	qps	rps	rmbps	wps	wmbps	rpq	rkbpq	wpi	wkbpi	csps	cpups	cspq	cpupq	dbgb1	dbgb2	rss	maxop	p50	p99	tag
406918	0	5063	45.3	3863.1	507.0	0.012	0.114	0.009	1.276	287873	50.4	0.707	37	165.8	323.6	NA	0.796	26421	1748	400m.pg1119_o3_native_lto.cx7_gcp_c2s60
403226	0	5405	44.7	3740.0	498.9	0.013	0.114	0.009	1.267	287816	50.4	0.714	37	163.1	318.3	0.0	0.819	26381	1798	400m.pg1214_o3_native_lto.cx7_gcp_c2s60
391007	0	4916	43.3	3570.6	495.2	0.013	0.113	0.009	1.297	308027	49.3	0.788	38	163.3	319.3	NA	0.969	25322	1798	400m.pg1310_o3_native_lto.cx7_gcp_c2s60
413223	0	5169	46.3	3193.8	527.4	0.013	0.115	0.008	1.307	305777	51.6	0.740	37	163.3	354.9	0.0	1.058	26332	1798	400m.pg147_o3_native_lto.cx7_gcp_c2s60
411523	0	5480	42.4	3249.1	533.4	0.013	0.106	0.008	1.327	301967	51.2	0.734	37	163.3	357.5	NA	0.802	26022	1748	400m.pg151_o3_native_lto.cx7_gcp_c2s60
408163	0	5261	45.3	3288.3	523.9	0.013	0.114	0.008	1.314	313851	50.9	0.769	37	163.3	356.5	0.0	1.073	26071	1848	400m.pg152_o3_native_lto.cx7_gcp_c2s60
q100.1
q100.1: range queries with 100 insert/s per client
Performance metrics for all DBMS, not just the ones listed above. Some are normalized by throughput, others are not. Legend for results is here.
ips	qps	rps	rmbps	wps	wmbps	rpq	rkbpq	wpi	wkbpi	csps	cpups	cspq	cpupq	dbgb1	dbgb2	rss	maxop	p50	p99	tag
1976	191643	0	0.0	3998.1	98.2	0.000	0.000	2.024	50.878	679241	63.0	3.544	99	166.6	292.5	0.0	0.024	9541	9142	400m.pg1119_o3_native_lto.cx7_gcp_c2s60
1976	198992	0	0.0	3991.6	97.0	0.000	0.000	2.020	50.280	705444	62.9	3.545	95	163.6	286.7	0.0	0.026	9877	9429	400m.pg1214_o3_native_lto.cx7_gcp_c2s60
1976	202283	0	0.0	3707.8	88.8	0.000	0.000	1.877	46.009	716261	62.9	3.541	93	163.9	266.0	0.0	0.024	9962	9541	400m.pg1310_o3_native_lto.cx7_gcp_c2s60
1976	199384	0	0.0	3561.0	85.1	0.000	0.000	1.802	44.107	710578	62.6	3.564	94	163.9	323.4	0.0	0.034	9909	9509	400m.pg147_o3_native_lto.cx7_gcp_c2s60
1976	200643	0	0.0	3578.3	85.3	0.000	0.000	1.811	44.205	714355	62.8	3.560	94	163.9	326.0	0.0	0.026	9973	9605	400m.pg151_o3_native_lto.cx7_gcp_c2s60
1976	200679	0	0.0	3577.9	85.1	0.000	0.000	1.811	44.109	714310	62.7	3.559	94	163.9	325.0	0.0	0.073	10041	9653	400m.pg152_o3_native_lto.cx7_gcp_c2s60
q500.1
q500.1: range queries with 500 insert/s per client
Performance metrics for all DBMS, not just the ones listed above. Some are normalized by throughput, others are not. Legend for results is here.
ips	qps	rps	rmbps	wps	wmbps	rpq	rkbpq	wpi	wkbpi	csps	cpups	cspq	cpupq	dbgb1	dbgb2	rss	maxop	p50	p99	tag
9885	193929	0	0.0	6879.7	212.6	0.000	0.000	0.696	22.025	672766	64.1	3.469	99	171.6	260.9	0.0	0.053	9625	9110	400m.pg1119_o3_native_lto.cx7_gcp_c2s60
9885	200609	0	0.0	6441.9	210.8	0.000	0.000	0.652	21.833	698168	63.9	3.480	96	167.2	255.0	0.0	0.060	9909	9365	400m.pg1214_o3_native_lto.cx7_gcp_c2s60
9885	202002	0	0.0	6179.4	204.8	0.000	0.000	0.625	21.217	703278	63.9	3.482	95	167.5	244.9	0.0	0.063	10053	9510	400m.pg1310_o3_native_lto.cx7_gcp_c2s60
9885	201572	0	0.0	6390.1	196.8	0.000	0.000	0.646	20.389	705063	63.7	3.498	95	167.4	271.7	0.0	0.059	9989	9446	400m.pg147_o3_native_lto.cx7_gcp_c2s60
9885	202892	0	0.0	6350.4	195.9	0.000	0.000	0.642	20.294	708623	63.8	3.493	94	167.4	272.3	0.0	0.056	10069	9530	400m.pg151_o3_native_lto.cx7_gcp_c2s60
9885	201426	0	0.0	6271.8	194.8	0.000	0.000	0.634	20.180	704068	63.8	3.495	95	167.5	270.9	0.0	0.067	10005	9494	400m.pg152_o3_native_lto.cx7_gcp_c2s60
q1000.1
q1000.1: range queries with 1000 insert/s per client
Performance metrics for all DBMS, not just the ones listed above. Some are normalized by throughput, others are not. Legend for results is here.
ips	qps	rps	rmbps	wps	wmbps	rpq	rkbpq	wpi	wkbpi	csps	cpups	cspq	cpupq	dbgb1	dbgb2	rss	maxop	p50	p99	tag
19748	195925	63	0.5	6516.3	297.0	0.000	0.003	0.330	15.399	663899	65.4	3.389	100	185.4	268.1	0.0	0.420	9749	8966	400m.pg1119_o3_native_lto.cx7_gcp_c2s60
19769	204408	0	0.0	5542.4	296.4	0.000	0.000	0.280	15.351	690868	65.2	3.380	96	179.3	262.7	0.0	0.083	10149	9257	400m.pg1214_o3_native_lto.cx7_gcp_c2s60
19769	206280	0	0.0	5634.1	306.4	0.000	0.000	0.285	15.872	697095	65.1	3.379	95	179.6	259.6	0.0	0.093	10249	9302	400m.pg1310_o3_native_lto.cx7_gcp_c2s60
19769	205260	0	0.0	6299.3	265.5	0.000	0.000	0.319	13.751	697236	64.9	3.397	95	179.6	280.4	0.0	0.086	10216	9398	400m.pg147_o3_native_lto.cx7_gcp_c2s60
19769	206586	0	0.0	6302.9	266.1	0.000	0.000	0.319	13.783	701415	64.9	3.395	94	179.6	280.7	0.0	0.060	10293	9382	400m.pg151_o3_native_lto.cx7_gcp_c2s60
19769	205134	0	0.0	6333.6	267.9	0.000	0.000	0.320	13.876	696688	64.9	3.396	95	179.6	279.8	0.0	0.092	10153	9238	400m.pg152_o3_native_lto.cx7_gcp_c2s60
l.i0
- l.i0: load without secondary indexes
- Legend for results is here.
- Each entry lists the percentage of responses that fit in that bucket (slower than max time for previous bucket, faster than min time for next bucket).
Insert response time histogram
256us	1ms	4ms	16ms	64ms	256ms	1s	4s	16s	gt	max	tag
0.000	60.984	38.162	0.805	0.013	0.024	0.013	0.000	0.000	0.000	0.756	pg1119_o3_native_lto.cx7_gcp_c2s60
0.000	59.796	39.346	0.799	0.026	0.020	0.014	0.000	0.000	0.000	0.913	pg1214_o3_native_lto.cx7_gcp_c2s60
0.000	58.623	40.556	0.776	0.012	0.019	0.013	0.000	0.000	0.000	0.780	pg1310_o3_native_lto.cx7_gcp_c2s60
0.000	58.688	40.467	0.793	0.018	0.020	0.014	0.000	0.000	0.000	0.765	pg147_o3_native_lto.cx7_gcp_c2s60
0.000	59.717	39.458	0.775	0.014	0.023	0.014	0.000	0.000	0.000	0.637	pg151_o3_native_lto.cx7_gcp_c2s60
0.000	58.790	40.412	0.743	0.018	0.022	0.015	0.000	0.000	0.000	0.605	pg152_o3_native_lto.cx7_gcp_c2s60
l.x
- l.x: create secondary indexes
- Legend for results is here.
- Each entry lists the percentage of responses that fit in that bucket (slower than max time for previous bucket, faster than min time for next bucket).
TODO - determine whether there is data for create index response time
l.i1
- l.i1: continue load after secondary indexes created
- Legend for results is here.
- Each entry lists the percentage of responses that fit in that bucket (slower than max time for previous bucket, faster than min time for next bucket).
Insert response time histogram
256us	1ms	4ms	16ms	64ms	256ms	1s	4s	16s	gt	max	tag
0.000	0.010	96.127	2.179	1.641	0.033	0.010	0.000	0.000	0.000	0.796	pg1119_o3_native_lto.cx7_gcp_c2s60
0.000	0.004	96.022	2.295	1.631	0.040	0.008	0.000	0.000	0.000	0.819	pg1214_o3_native_lto.cx7_gcp_c2s60
0.000	0.035	95.889	2.323	1.704	0.038	0.012	0.000	0.000	0.000	0.969	pg1310_o3_native_lto.cx7_gcp_c2s60
0.000	0.003	96.045	2.557	1.354	0.029	0.012	nonzero	0.000	0.000	1.058	pg147_o3_native_lto.cx7_gcp_c2s60
0.000	0.003	95.882	2.722	1.350	0.028	0.014	0.000	0.000	0.000	0.802	pg151_o3_native_lto.cx7_gcp_c2s60
0.000	0.004	95.933	2.639	1.384	0.025	0.015	nonzero	0.000	0.000	1.073	pg152_o3_native_lto.cx7_gcp_c2s60
q100.1
- q100.1: range queries with 100 insert/s per client
- Legend for results is here.
- Each entry lists the percentage of responses that fit in that bucket (slower than max time for previous bucket, faster than min time for next bucket).
Query response time histogram
256us	1ms	4ms	16ms	64ms	256ms	1s	4s	16s	gt	max	tag
99.968	0.025	0.006	0.001	nonzero	0.000	0.000	0.000	0.000	0.000	0.024	pg1119_o3_native_lto.cx7_gcp_c2s60
99.974	0.019	0.006	0.001	nonzero	0.000	0.000	0.000	0.000	0.000	0.026	pg1214_o3_native_lto.cx7_gcp_c2s60
99.976	0.018	0.006	0.001	nonzero	0.000	0.000	0.000	0.000	0.000	0.024	pg1310_o3_native_lto.cx7_gcp_c2s60
99.976	0.017	0.006	0.001	nonzero	0.000	0.000	0.000	0.000	0.000	0.034	pg147_o3_native_lto.cx7_gcp_c2s60
99.976	0.016	0.006	0.001	nonzero	0.000	0.000	0.000	0.000	0.000	0.026	pg151_o3_native_lto.cx7_gcp_c2s60
99.977	0.017	0.006	0.001	nonzero	nonzero	0.000	0.000	0.000	0.000	0.073	pg152_o3_native_lto.cx7_gcp_c2s60
Insert response time histogram
256us	1ms	4ms	16ms	64ms	256ms	1s	4s	16s	gt	max	tag
0.000	0.000	95.682	3.364	0.939	0.015	0.000	0.000	0.000	0.000	0.185	pg1119_o3_native_lto.cx7_gcp_c2s60
0.000	0.000	92.583	5.903	1.514	0.000	0.000	0.000	0.000	0.000	0.051	pg1214_o3_native_lto.cx7_gcp_c2s60
0.000	0.000	92.054	5.771	2.160	0.015	0.000	0.000	0.000	0.000	0.123	pg1310_o3_native_lto.cx7_gcp_c2s60
0.000	0.000	95.801	3.460	0.729	0.010	0.000	0.000	0.000	0.000	0.080	pg147_o3_native_lto.cx7_gcp_c2s60
0.000	0.000	94.090	4.844	1.065	0.000	0.000	0.000	0.000	0.000	0.049	pg151_o3_native_lto.cx7_gcp_c2s60
0.000	0.000	92.774	5.997	1.203	0.026	0.000	0.000	0.000	0.000	0.107	pg152_o3_native_lto.cx7_gcp_c2s60
q500.1
- q500.1: range queries with 500 insert/s per client
- Legend for results is here.
- Each entry lists the percentage of responses that fit in that bucket (slower than max time for previous bucket, faster than min time for next bucket).
Query response time histogram
256us	1ms	4ms	16ms	64ms	256ms	1s	4s	16s	gt	max	tag
99.906	0.061	0.029	0.004	nonzero	0.000	0.000	0.000	0.000	0.000	0.053	pg1119_o3_native_lto.cx7_gcp_c2s60
99.913	0.055	0.029	0.003	nonzero	0.000	0.000	0.000	0.000	0.000	0.060	pg1214_o3_native_lto.cx7_gcp_c2s60
99.915	0.054	0.028	0.003	nonzero	0.000	0.000	0.000	0.000	0.000	0.063	pg1310_o3_native_lto.cx7_gcp_c2s60
99.915	0.053	0.028	0.004	nonzero	0.000	0.000	0.000	0.000	0.000	0.059	pg147_o3_native_lto.cx7_gcp_c2s60
99.917	0.052	0.028	0.004	nonzero	0.000	0.000	0.000	0.000	0.000	0.056	pg151_o3_native_lto.cx7_gcp_c2s60
99.916	0.053	0.028	0.004	nonzero	nonzero	0.000	0.000	0.000	0.000	0.067	pg152_o3_native_lto.cx7_gcp_c2s60
Insert response time histogram
256us	1ms	4ms	16ms	64ms	256ms	1s	4s	16s	gt	max	tag
0.000	0.000	43.888	25.996	28.537	1.577	0.002	0.000	0.000	0.000	0.326	pg1119_o3_native_lto.cx7_gcp_c2s60
0.000	0.000	43.562	26.406	28.512	1.521	0.001	0.000	0.000	0.000	0.327	pg1214_o3_native_lto.cx7_gcp_c2s60
0.000	0.000	44.383	25.768	28.405	1.444	0.000	0.000	0.000	0.000	0.236	pg1310_o3_native_lto.cx7_gcp_c2s60
0.000	0.000	44.914	24.447	29.331	1.308	0.000	0.000	0.000	0.000	0.207	pg147_o3_native_lto.cx7_gcp_c2s60
0.000	0.000	45.407	24.647	28.690	1.255	0.002	0.000	0.000	0.000	0.357	pg151_o3_native_lto.cx7_gcp_c2s60
0.000	0.000	45.207	24.648	28.909	1.235	0.000	0.000	0.000	0.000	0.187	pg152_o3_native_lto.cx7_gcp_c2s60
q1000.1
- q1000.1: range queries with 1000 insert/s per client
- Legend for results is here.
- Each entry lists the percentage of responses that fit in that bucket (slower than max time for previous bucket, faster than min time for next bucket).
Query response time histogram
256us	1ms	4ms	16ms	64ms	256ms	1s	4s	16s	gt	max	tag
99.842	0.108	0.043	0.007	nonzero	nonzero	nonzero	0.000	0.000	0.000	0.420	pg1119_o3_native_lto.cx7_gcp_c2s60
99.855	0.095	0.042	0.007	0.001	nonzero	0.000	0.000	0.000	0.000	0.083	pg1214_o3_native_lto.cx7_gcp_c2s60
99.855	0.095	0.042	0.007	0.001	nonzero	0.000	0.000	0.000	0.000	0.093	pg1310_o3_native_lto.cx7_gcp_c2s60
99.860	0.092	0.041	0.007	nonzero	nonzero	0.000	0.000	0.000	0.000	0.086	pg147_o3_native_lto.cx7_gcp_c2s60
99.863	0.089	0.041	0.007	nonzero	0.000	0.000	0.000	0.000	0.000	0.060	pg151_o3_native_lto.cx7_gcp_c2s60
99.860	0.092	0.041	0.007	nonzero	nonzero	0.000	0.000	0.000	0.000	0.092	pg152_o3_native_lto.cx7_gcp_c2s60
Insert response time histogram
256us	1ms	4ms	16ms	64ms	256ms	1s	4s	16s	gt	max	tag
0.000	0.000	66.971	17.617	14.687	0.716	0.005	0.004	0.000	0.000	2.446	pg1119_o3_native_lto.cx7_gcp_c2s60
0.000	0.000	56.757	22.223	19.875	1.146	0.000	0.000	0.000	0.000	0.231	pg1214_o3_native_lto.cx7_gcp_c2s60
0.000	0.000	56.539	21.159	20.734	1.567	0.001	0.000	0.000	0.000	0.278	pg1310_o3_native_lto.cx7_gcp_c2s60
0.000	0.000	58.709	21.450	18.923	0.918	0.000	0.000	0.000	0.000	0.218	pg147_o3_native_lto.cx7_gcp_c2s60
0.000	0.000	59.319	21.184	18.631	0.866	0.000	0.000	0.000	0.000	0.209	pg151_o3_native_lto.cx7_gcp_c2s60
0.000	0.000	58.283	21.704	19.109	0.904	0.000	0.000	0.000	0.000	0.208	pg152_o3_native_lto.cx7_gcp_c2s60