Introduction
This is a report for the insert benchmark with 400M docs and 20 client(s). It is generated by scripts (bash, awk, sed) and Tufte might not be impressed. An overview of the insert benchmark is here and a short update is here. Below, by DBMS, I mean DBMS+version.config. An example is my8020.c10b40 where my means MySQL, 8020 is version 8.0.20 and c10b40 is the name for the configuration file.
The test server is a c2-standard-60 from GCP with 30 cores, hyperthreading disabled, 240G RAM and 3T from XFS and SW RAID 0 striped over 8 local NVMe drives. The benchmark was run with 20 clients and there were 1 or 2 connections per client (1 for queries, 1 for inserts). The benchmark loads 400M rows without secondary indexes, creates secondary indexes, loads another 400M rows then does 3 read+write tests for one hour each that do queries as fast as possible with 100, 500 and then 1000 writes/second/client concurrent with the queries. Each read-write test runs for 1800 seconds. The test was configured to use one table. The database is cached by the storage engine and the only IO is for writes. Clients and the DBMS share one server. The per-database configs are in the per-database subdirectories here.
The tested DBMS are:
- pg152_def.cx7_gcp_c2s60 - Postgres 15.2, the cx7_gcp_c2s60 config and a default build that used -O2
- pg152_o3_native_lto.cx7_gcp_c2s60 - Postgres 15.2, the cx7_gcp_c2s60 config and a build that uses -O3 -march=native -mtune=native -flto (link-time optimization)
Contents
- Summary
- l.i0: load without secondary indexes
- l.x: create secondary indexes
- l.i1: continue load after secondary indexes created
- q100.1: range queries with 100 insert/s per client
- q500.1: range queries with 500 insert/s per client
- q1000.1: range queries with 1000 insert/s per client
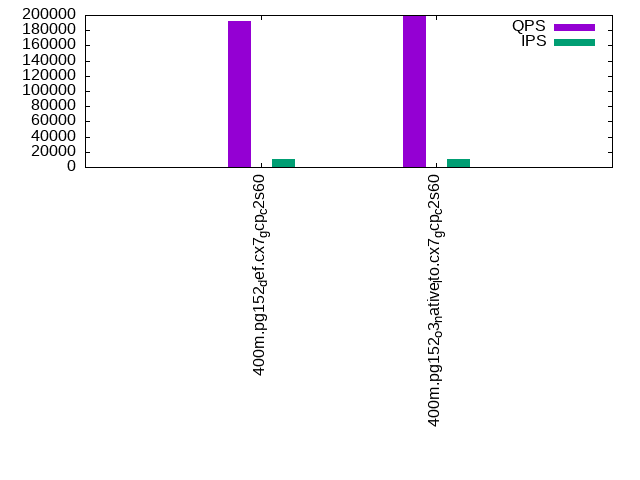
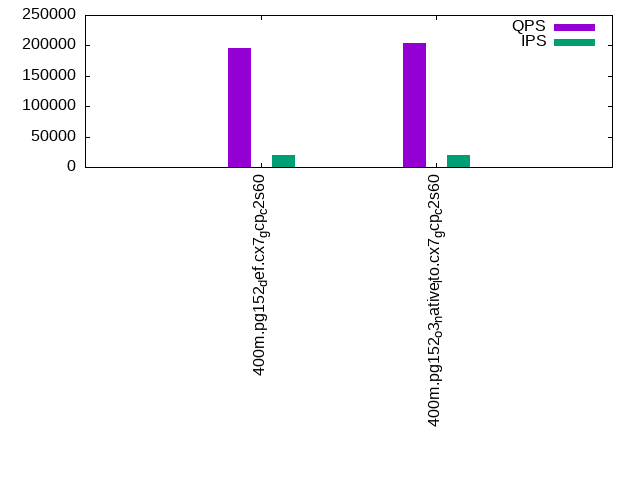
Summary
The numbers are inserts/s for l.i0 and l.i1, indexed docs (or rows) /s for l.x and queries/s for q*.2. The values are the average rate over the entire test for inserts (IPS) and queries (QPS). The range of values for IPS and QPS is split into 3 parts: bottom 25%, middle 50%, top 25%. Values in the bottom 25% have a red background, values in the top 25% have a green background and values in the middle have no color. A gray background is used for values that can be ignored because the DBMS did not sustain the target insert rate. Red backgrounds are not used when the minimum value is within 80% of the max value.
| dbms | l.i0 | l.x | l.i1 | q100.1 | q500.1 | q1000.1 |
|---|---|---|---|---|---|---|
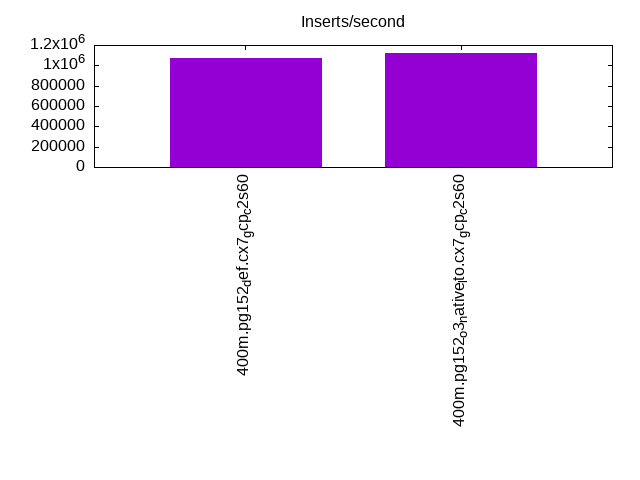
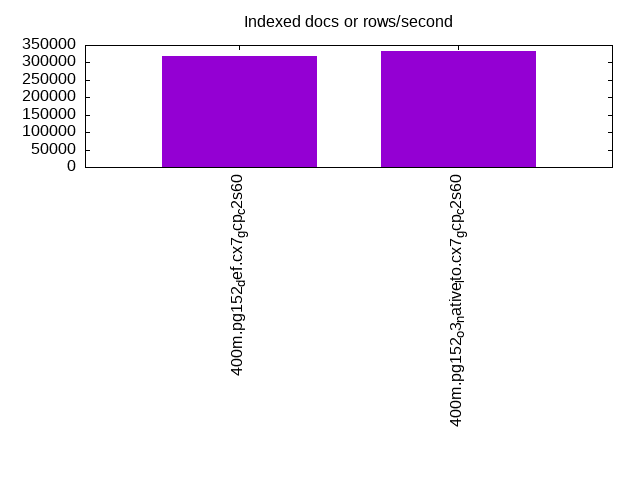
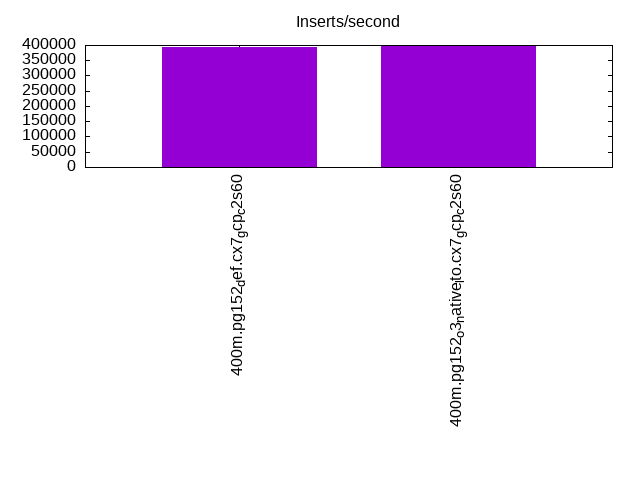
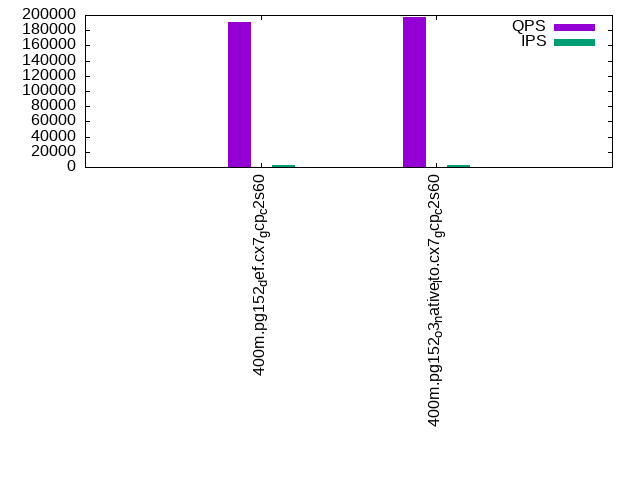
| 400m.pg152_def.cx7_gcp_c2s60 | 1075269 | 319059 | 393314 | 190651 | 191907 | 195727 |
| 400m.pg152_o3_native_lto.cx7_gcp_c2s60 | 1117318 | 331483 | 396040 | 197851 | 198846 | 203524 |
This lists the average rate of inserts/s for the tests that do inserts concurrent with queries. For such tests the query rate is listed in the table above. The read+write tests are setup so that the insert rate should match the target rate every second. Cells that are not at least 95% of the target have a red background to indicate a failure to satisfy the target.
| dbms | q100.1 | q500.1 | q1000.1 |
|---|---|---|---|
| pg152_def.cx7_gcp_c2s60 | 1976 | 9885 | 19769 |
| pg152_o3_native_lto.cx7_gcp_c2s60 | 1976 | 9885 | 19769 |
| target | 2000 | 10000 | 20000 |
l.i0
l.i0: load without secondary indexes. Graphs for performance per 1-second interval are here.
Average throughput:
Insert response time histogram: each cell has the percentage of responses that take <= the time in the header and max is the max response time in seconds. For the max column values in the top 25% of the range have a red background and in the bottom 25% of the range have a green background. The red background is not used when the min value is within 80% of the max value.
| dbms | 256us | 1ms | 4ms | 16ms | 64ms | 256ms | 1s | 4s | 16s | gt | max |
|---|---|---|---|---|---|---|---|---|---|---|---|
| pg152_def.cx7_gcp_c2s60 | 19.214 | 77.426 | 3.300 | 0.022 | 0.021 | 0.017 | 0.667 | ||||
| pg152_o3_native_lto.cx7_gcp_c2s60 | 27.447 | 69.365 | 3.137 | 0.015 | 0.024 | 0.012 | 0.001 | 1.151 |
Performance metrics for the DBMS listed above. Some are normalized by throughput, others are not. Legend for results is here.
ips	qps	rps	rmbps	wps	wmbps	rpq	rkbpq	wpi	wkbpi	csps	cpups	cspq	cpupq	dbgb1	dbgb2	rss	maxop	p50	p99	tag
1075269	0	0	0.0	1703.9	418.0	0.000	0.000	0.002	0.398	306044	57.6	0.285	16	43.0	116.1	NA	0.667	60234	8790	400m.pg152_def.cx7_gcp_c2s60
1117318	0	0	0.0	1662.9	414.6	0.000	0.000	0.001	0.380	327166	57.3	0.293	15	43.0	113.5	NA	1.151	61733	9190	400m.pg152_o3_native_lto.cx7_gcp_c2s60
l.x
l.x: create secondary indexes.
Average throughput:
Performance metrics for the DBMS listed above. Some are normalized by throughput, others are not. Legend for results is here.
ips	qps	rps	rmbps	wps	wmbps	rpq	rkbpq	wpi	wkbpi	csps	cpups	cspq	cpupq	dbgb1	dbgb2	rss	maxop	p50	p99	tag
319059	0	1527	15.0	421.2	100.4	0.005	0.048	0.001	0.322	728	3.0	0.002	3	78.3	152.0	0.0	0.027	NA	NA	400m.pg152_def.cx7_gcp_c2s60
331483	0	2487	17.2	469.2	108.7	0.008	0.053	0.001	0.336	1395	3.1	0.004	3	78.3	152.7	0.0	0.010	NA	NA	400m.pg152_o3_native_lto.cx7_gcp_c2s60
l.i1
l.i1: continue load after secondary indexes created. Graphs for performance per 1-second interval are here.
Average throughput:
Insert response time histogram: each cell has the percentage of responses that take <= the time in the header and max is the max response time in seconds. For the max column values in the top 25% of the range have a red background and in the bottom 25% of the range have a green background. The red background is not used when the min value is within 80% of the max value.
| dbms | 256us | 1ms | 4ms | 16ms | 64ms | 256ms | 1s | 4s | 16s | gt | max |
|---|---|---|---|---|---|---|---|---|---|---|---|
| pg152_def.cx7_gcp_c2s60 | 94.444 | 4.661 | 0.855 | 0.025 | 0.015 | nonzero | 1.659 | ||||
| pg152_o3_native_lto.cx7_gcp_c2s60 | 94.562 | 4.391 | 1.005 | 0.026 | 0.016 | 0.959 |
Performance metrics for the DBMS listed above. Some are normalized by throughput, others are not. Legend for results is here.
ips	qps	rps	rmbps	wps	wmbps	rpq	rkbpq	wpi	wkbpi	csps	cpups	cspq	cpupq	dbgb1	dbgb2	rss	maxop	p50	p99	tag
393314	0	2975	27.4	2531.9	436.4	0.008	0.071	0.006	1.136	288167	54.3	0.733	41	170.2	337.0	NA	1.659	23674	1898	400m.pg152_def.cx7_gcp_c2s60
396040	0	3098	27.8	2399.0	433.7	0.008	0.072	0.006	1.121	282779	52.6	0.714	40	170.2	324.2	NA	0.959	24473	1648	400m.pg152_o3_native_lto.cx7_gcp_c2s60
q100.1
q100.1: range queries with 100 insert/s per client. Graphs for performance per 1-second interval are here.
Average throughput:
Query response time histogram: each cell has the percentage of responses that take <= the time in the header and max is the max response time in seconds. For max values in the top 25% of the range have a red background and in the bottom 25% of the range have a green background. The red background is not used when the min value is within 80% of the max value.
| dbms | 256us | 1ms | 4ms | 16ms | 64ms | 256ms | 1s | 4s | 16s | gt | max |
|---|---|---|---|---|---|---|---|---|---|---|---|
| pg152_def.cx7_gcp_c2s60 | 99.973 | 0.021 | 0.006 | 0.001 | nonzero | 0.027 | |||||
| pg152_o3_native_lto.cx7_gcp_c2s60 | 99.976 | 0.017 | 0.006 | 0.001 | nonzero | 0.024 |
Insert response time histogram: each cell has the percentage of responses that take <= the time in the header and max is the max response time in seconds. For max values in the top 25% of the range have a red background and in the bottom 25% of the range have a green background. The red background is not used when the min value is within 80% of the max value.
| dbms | 256us | 1ms | 4ms | 16ms | 64ms | 256ms | 1s | 4s | 16s | gt | max |
|---|---|---|---|---|---|---|---|---|---|---|---|
| pg152_def.cx7_gcp_c2s60 | 98.658 | 1.200 | 0.142 | 0.034 | |||||||
| pg152_o3_native_lto.cx7_gcp_c2s60 | 98.579 | 1.211 | 0.210 | 0.032 |
Performance metrics for the DBMS listed above. Some are normalized by throughput, others are not. Legend for results is here.
ips	qps	rps	rmbps	wps	wmbps	rpq	rkbpq	wpi	wkbpi	csps	cpups	cspq	cpupq	dbgb1	dbgb2	rss	maxop	p50	p99	tag
1976	190651	0	0.0	2478.5	71.6	0.000	0.000	1.254	37.116	680740	62.8	3.571	99	171.1	309.3	0.0	0.027	9434	9114	400m.pg152_def.cx7_gcp_c2s60
1976	197851	0	0.0	2538.2	69.5	0.000	0.000	1.285	36.005	705631	62.7	3.566	95	171.1	303.2	0.0	0.024	9813	9494	400m.pg152_o3_native_lto.cx7_gcp_c2s60
q500.1
q500.1: range queries with 500 insert/s per client. Graphs for performance per 1-second interval are here.
Average throughput:
Query response time histogram: each cell has the percentage of responses that take <= the time in the header and max is the max response time in seconds. For max values in the top 25% of the range have a red background and in the bottom 25% of the range have a green background. The red background is not used when the min value is within 80% of the max value.
| dbms | 256us | 1ms | 4ms | 16ms | 64ms | 256ms | 1s | 4s | 16s | gt | max |
|---|---|---|---|---|---|---|---|---|---|---|---|
| pg152_def.cx7_gcp_c2s60 | 99.913 | 0.056 | 0.027 | 0.003 | nonzero | 0.029 | |||||
| pg152_o3_native_lto.cx7_gcp_c2s60 | 99.919 | 0.052 | 0.026 | 0.003 | nonzero | 0.031 |
Insert response time histogram: each cell has the percentage of responses that take <= the time in the header and max is the max response time in seconds. For max values in the top 25% of the range have a red background and in the bottom 25% of the range have a green background. The red background is not used when the min value is within 80% of the max value.
| dbms | 256us | 1ms | 4ms | 16ms | 64ms | 256ms | 1s | 4s | 16s | gt | max |
|---|---|---|---|---|---|---|---|---|---|---|---|
| pg152_def.cx7_gcp_c2s60 | 52.465 | 27.302 | 19.929 | 0.304 | 0.173 | ||||||
| pg152_o3_native_lto.cx7_gcp_c2s60 | 52.730 | 27.138 | 19.853 | 0.279 | 0.174 |
Performance metrics for the DBMS listed above. Some are normalized by throughput, others are not. Legend for results is here.
ips	qps	rps	rmbps	wps	wmbps	rpq	rkbpq	wpi	wkbpi	csps	cpups	cspq	cpupq	dbgb1	dbgb2	rss	maxop	p50	p99	tag
9885	191907	0	0.0	4634.8	145.5	0.000	0.000	0.469	15.075	672579	64.0	3.505	100	176.0	262.7	0.0	0.029	9485	9062	400m.pg152_def.cx7_gcp_c2s60
9885	198846	0	0.0	4572.0	143.9	0.000	0.000	0.463	14.903	696337	63.5	3.502	96	176.0	259.8	0.0	0.031	9913	9478	400m.pg152_o3_native_lto.cx7_gcp_c2s60
q1000.1
q1000.1: range queries with 1000 insert/s per client. Graphs for performance per 1-second interval are here.
Average throughput:
Query response time histogram: each cell has the percentage of responses that take <= the time in the header and max is the max response time in seconds. For max values in the top 25% of the range have a red background and in the bottom 25% of the range have a green background. The red background is not used when the min value is within 80% of the max value.
| dbms | 256us | 1ms | 4ms | 16ms | 64ms | 256ms | 1s | 4s | 16s | gt | max |
|---|---|---|---|---|---|---|---|---|---|---|---|
| pg152_def.cx7_gcp_c2s60 | 99.859 | 0.099 | 0.038 | 0.004 | nonzero | 0.045 | |||||
| pg152_o3_native_lto.cx7_gcp_c2s60 | 99.867 | 0.092 | 0.037 | 0.004 | nonzero | 0.041 |
Insert response time histogram: each cell has the percentage of responses that take <= the time in the header and max is the max response time in seconds. For max values in the top 25% of the range have a red background and in the bottom 25% of the range have a green background. The red background is not used when the min value is within 80% of the max value.
| dbms | 256us | 1ms | 4ms | 16ms | 64ms | 256ms | 1s | 4s | 16s | gt | max |
|---|---|---|---|---|---|---|---|---|---|---|---|
| pg152_def.cx7_gcp_c2s60 | 59.798 | 27.268 | 12.682 | 0.252 | 0.175 | ||||||
| pg152_o3_native_lto.cx7_gcp_c2s60 | 60.347 | 26.725 | 12.675 | 0.252 | 0.174 |
Performance metrics for the DBMS listed above. Some are normalized by throughput, others are not. Legend for results is here.
ips	qps	rps	rmbps	wps	wmbps	rpq	rkbpq	wpi	wkbpi	csps	cpups	cspq	cpupq	dbgb1	dbgb2	rss	maxop	p50	p99	tag
19769	195727	0	0.0	4738.9	205.0	0.000	0.000	0.240	10.621	661521	65.2	3.380	100	189.4	270.0	0.0	0.045	9733	9126	400m.pg152_def.cx7_gcp_c2s60
19769	203524	0	0.0	4752.0	204.9	0.000	0.000	0.240	10.613	687289	65.0	3.377	96	189.4	268.6	0.0	0.041	10121	9382	400m.pg152_o3_native_lto.cx7_gcp_c2s60
l.i0
l.i0: load without secondary indexes
Performance metrics for all DBMS, not just the ones listed above. Some are normalized by throughput, others are not. Legend for results is here.
ips	qps	rps	rmbps	wps	wmbps	rpq	rkbpq	wpi	wkbpi	csps	cpups	cspq	cpupq	dbgb1	dbgb2	rss	maxop	p50	p99	tag
1075269	0	0	0.0	1703.9	418.0	0.000	0.000	0.002	0.398	306044	57.6	0.285	16	43.0	116.1	NA	0.667	60234	8790	400m.pg152_def.cx7_gcp_c2s60
1117318	0	0	0.0	1662.9	414.6	0.000	0.000	0.001	0.380	327166	57.3	0.293	15	43.0	113.5	NA	1.151	61733	9190	400m.pg152_o3_native_lto.cx7_gcp_c2s60
l.x
l.x: create secondary indexes
Performance metrics for all DBMS, not just the ones listed above. Some are normalized by throughput, others are not. Legend for results is here.
ips	qps	rps	rmbps	wps	wmbps	rpq	rkbpq	wpi	wkbpi	csps	cpups	cspq	cpupq	dbgb1	dbgb2	rss	maxop	p50	p99	tag
319059	0	1527	15.0	421.2	100.4	0.005	0.048	0.001	0.322	728	3.0	0.002	3	78.3	152.0	0.0	0.027	NA	NA	400m.pg152_def.cx7_gcp_c2s60
331483	0	2487	17.2	469.2	108.7	0.008	0.053	0.001	0.336	1395	3.1	0.004	3	78.3	152.7	0.0	0.010	NA	NA	400m.pg152_o3_native_lto.cx7_gcp_c2s60
l.i1
l.i1: continue load after secondary indexes created
Performance metrics for all DBMS, not just the ones listed above. Some are normalized by throughput, others are not. Legend for results is here.
ips	qps	rps	rmbps	wps	wmbps	rpq	rkbpq	wpi	wkbpi	csps	cpups	cspq	cpupq	dbgb1	dbgb2	rss	maxop	p50	p99	tag
393314	0	2975	27.4	2531.9	436.4	0.008	0.071	0.006	1.136	288167	54.3	0.733	41	170.2	337.0	NA	1.659	23674	1898	400m.pg152_def.cx7_gcp_c2s60
396040	0	3098	27.8	2399.0	433.7	0.008	0.072	0.006	1.121	282779	52.6	0.714	40	170.2	324.2	NA	0.959	24473	1648	400m.pg152_o3_native_lto.cx7_gcp_c2s60
q100.1
q100.1: range queries with 100 insert/s per client
Performance metrics for all DBMS, not just the ones listed above. Some are normalized by throughput, others are not. Legend for results is here.
ips	qps	rps	rmbps	wps	wmbps	rpq	rkbpq	wpi	wkbpi	csps	cpups	cspq	cpupq	dbgb1	dbgb2	rss	maxop	p50	p99	tag
1976	190651	0	0.0	2478.5	71.6	0.000	0.000	1.254	37.116	680740	62.8	3.571	99	171.1	309.3	0.0	0.027	9434	9114	400m.pg152_def.cx7_gcp_c2s60
1976	197851	0	0.0	2538.2	69.5	0.000	0.000	1.285	36.005	705631	62.7	3.566	95	171.1	303.2	0.0	0.024	9813	9494	400m.pg152_o3_native_lto.cx7_gcp_c2s60
q500.1
q500.1: range queries with 500 insert/s per client
Performance metrics for all DBMS, not just the ones listed above. Some are normalized by throughput, others are not. Legend for results is here.
ips	qps	rps	rmbps	wps	wmbps	rpq	rkbpq	wpi	wkbpi	csps	cpups	cspq	cpupq	dbgb1	dbgb2	rss	maxop	p50	p99	tag
9885	191907	0	0.0	4634.8	145.5	0.000	0.000	0.469	15.075	672579	64.0	3.505	100	176.0	262.7	0.0	0.029	9485	9062	400m.pg152_def.cx7_gcp_c2s60
9885	198846	0	0.0	4572.0	143.9	0.000	0.000	0.463	14.903	696337	63.5	3.502	96	176.0	259.8	0.0	0.031	9913	9478	400m.pg152_o3_native_lto.cx7_gcp_c2s60
q1000.1
q1000.1: range queries with 1000 insert/s per client
Performance metrics for all DBMS, not just the ones listed above. Some are normalized by throughput, others are not. Legend for results is here.
ips	qps	rps	rmbps	wps	wmbps	rpq	rkbpq	wpi	wkbpi	csps	cpups	cspq	cpupq	dbgb1	dbgb2	rss	maxop	p50	p99	tag
19769	195727	0	0.0	4738.9	205.0	0.000	0.000	0.240	10.621	661521	65.2	3.380	100	189.4	270.0	0.0	0.045	9733	9126	400m.pg152_def.cx7_gcp_c2s60
19769	203524	0	0.0	4752.0	204.9	0.000	0.000	0.240	10.613	687289	65.0	3.377	96	189.4	268.6	0.0	0.041	10121	9382	400m.pg152_o3_native_lto.cx7_gcp_c2s60
l.i0
- l.i0: load without secondary indexes
- Legend for results is here.
- Each entry lists the percentage of responses that fit in that bucket (slower than max time for previous bucket, faster than min time for next bucket).
Insert response time histogram
256us	1ms	4ms	16ms	64ms	256ms	1s	4s	16s	gt	max	tag
0.000	19.214	77.426	3.300	0.022	0.021	0.017	0.000	0.000	0.000	0.667	pg152_def.cx7_gcp_c2s60
0.000	27.447	69.365	3.137	0.015	0.024	0.012	0.001	0.000	0.000	1.151	pg152_o3_native_lto.cx7_gcp_c2s60
l.x
- l.x: create secondary indexes
- Legend for results is here.
- Each entry lists the percentage of responses that fit in that bucket (slower than max time for previous bucket, faster than min time for next bucket).
TODO - determine whether there is data for create index response time
l.i1
- l.i1: continue load after secondary indexes created
- Legend for results is here.
- Each entry lists the percentage of responses that fit in that bucket (slower than max time for previous bucket, faster than min time for next bucket).
Insert response time histogram
256us	1ms	4ms	16ms	64ms	256ms	1s	4s	16s	gt	max	tag
0.000	0.000	94.444	4.661	0.855	0.025	0.015	nonzero	0.000	0.000	1.659	pg152_def.cx7_gcp_c2s60
0.000	0.000	94.562	4.391	1.005	0.026	0.016	0.000	0.000	0.000	0.959	pg152_o3_native_lto.cx7_gcp_c2s60
q100.1
- q100.1: range queries with 100 insert/s per client
- Legend for results is here.
- Each entry lists the percentage of responses that fit in that bucket (slower than max time for previous bucket, faster than min time for next bucket).
Query response time histogram
256us	1ms	4ms	16ms	64ms	256ms	1s	4s	16s	gt	max	tag
99.973	0.021	0.006	0.001	nonzero	0.000	0.000	0.000	0.000	0.000	0.027	pg152_def.cx7_gcp_c2s60
99.976	0.017	0.006	0.001	nonzero	0.000	0.000	0.000	0.000	0.000	0.024	pg152_o3_native_lto.cx7_gcp_c2s60
Insert response time histogram
256us	1ms	4ms	16ms	64ms	256ms	1s	4s	16s	gt	max	tag
0.000	0.000	98.658	1.200	0.142	0.000	0.000	0.000	0.000	0.000	0.034	pg152_def.cx7_gcp_c2s60
0.000	0.000	98.579	1.211	0.210	0.000	0.000	0.000	0.000	0.000	0.032	pg152_o3_native_lto.cx7_gcp_c2s60
q500.1
- q500.1: range queries with 500 insert/s per client
- Legend for results is here.
- Each entry lists the percentage of responses that fit in that bucket (slower than max time for previous bucket, faster than min time for next bucket).
Query response time histogram
256us	1ms	4ms	16ms	64ms	256ms	1s	4s	16s	gt	max	tag
99.913	0.056	0.027	0.003	nonzero	0.000	0.000	0.000	0.000	0.000	0.029	pg152_def.cx7_gcp_c2s60
99.919	0.052	0.026	0.003	nonzero	0.000	0.000	0.000	0.000	0.000	0.031	pg152_o3_native_lto.cx7_gcp_c2s60
Insert response time histogram
256us	1ms	4ms	16ms	64ms	256ms	1s	4s	16s	gt	max	tag
0.000	0.000	52.465	27.302	19.929	0.304	0.000	0.000	0.000	0.000	0.173	pg152_def.cx7_gcp_c2s60
0.000	0.000	52.730	27.138	19.853	0.279	0.000	0.000	0.000	0.000	0.174	pg152_o3_native_lto.cx7_gcp_c2s60
q1000.1
- q1000.1: range queries with 1000 insert/s per client
- Legend for results is here.
- Each entry lists the percentage of responses that fit in that bucket (slower than max time for previous bucket, faster than min time for next bucket).
Query response time histogram
256us	1ms	4ms	16ms	64ms	256ms	1s	4s	16s	gt	max	tag
99.859	0.099	0.038	0.004	nonzero	0.000	0.000	0.000	0.000	0.000	0.045	pg152_def.cx7_gcp_c2s60
99.867	0.092	0.037	0.004	nonzero	0.000	0.000	0.000	0.000	0.000	0.041	pg152_o3_native_lto.cx7_gcp_c2s60
Insert response time histogram
256us	1ms	4ms	16ms	64ms	256ms	1s	4s	16s	gt	max	tag
0.000	0.000	59.798	27.268	12.682	0.252	0.000	0.000	0.000	0.000	0.175	pg152_def.cx7_gcp_c2s60
0.000	0.000	60.347	26.725	12.675	0.252	0.000	0.000	0.000	0.000	0.174	pg152_o3_native_lto.cx7_gcp_c2s60