Introduction
This is a report for the insert benchmark with 400M docs and 20 client(s). It is generated by scripts (bash, awk, sed) and Tufte might not be impressed. An overview of the insert benchmark is here and a short update is here. Below, by DBMS, I mean DBMS+version.config. An example is my8020.c10b40 where my means MySQL, 8020 is version 8.0.20 and c10b40 is the name for the configuration file.
The test server is a c2-standard-60 from GCP with 30 cores, hyperthreading disabled, 240G RAM and 3T from XFS and SW RAID 0 striped over 8 local NVMe drives. The benchmark was run with 20 clients and there were 1 or 2 connections per client (1 for queries, 1 for inserts). The benchmark loads 400M rows without secondary indexes, creates secondary indexes, loads another 400M rows then does 3 read+write tests for one hour each that do queries as fast as possible with 100, 500 and then 1000 writes/second/client concurrent with the queries. Each read-write test runs for 1800 seconds. The test was configured to use one table. The database fits in the OS page cache but not the DBMS buffer pool. Clients and the DBMS share one server. The per-database configs are in the per-database subdirectories here.
The tested DBMS are:
- pg152_def.cx7_gcp_c2s60_4g - Postgres 15.2, the cx7_gcp_c2s60_4g config and a default build that used -O2
- pg152_o3_native_lto.cx7_gcp_c2s60_4g - Postgres 15.2, the cx7_gcp_c2s60_4g config and a build that uses -O3 -march=native -mtune=native -flto (link-time optimization)
Contents
- Summary
- l.i0: load without secondary indexes
- l.x: create secondary indexes
- l.i1: continue load after secondary indexes created
- q100.1: range queries with 100 insert/s per client
- q500.1: range queries with 500 insert/s per client
- q1000.1: range queries with 1000 insert/s per client
Summary
The numbers are inserts/s for l.i0 and l.i1, indexed docs (or rows) /s for l.x and queries/s for q*.2. The values are the average rate over the entire test for inserts (IPS) and queries (QPS). The range of values for IPS and QPS is split into 3 parts: bottom 25%, middle 50%, top 25%. Values in the bottom 25% have a red background, values in the top 25% have a green background and values in the middle have no color. A gray background is used for values that can be ignored because the DBMS did not sustain the target insert rate. Red backgrounds are not used when the minimum value is within 80% of the max value.
| dbms | l.i0 | l.x | l.i1 | q100.1 | q500.1 | q1000.1 |
|---|---|---|---|---|---|---|
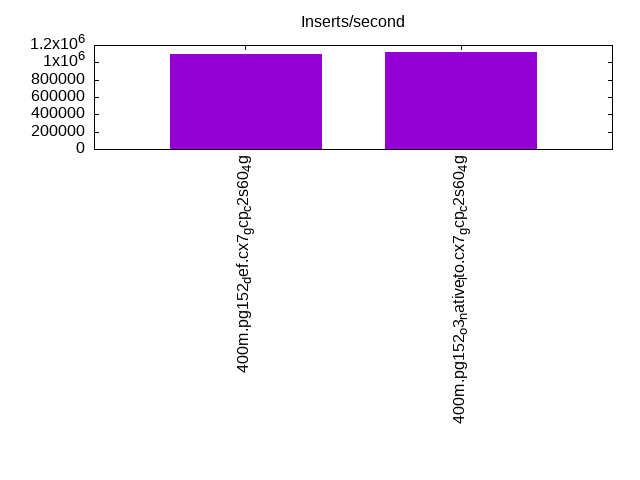
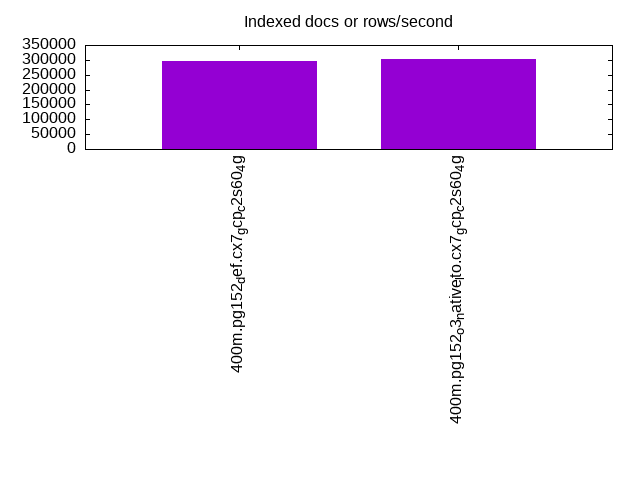
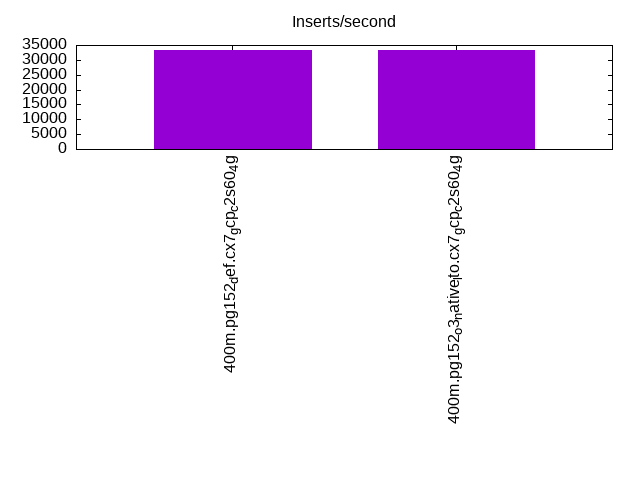
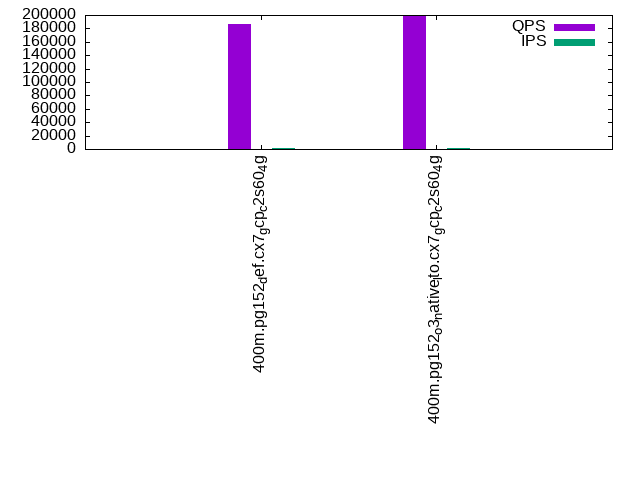
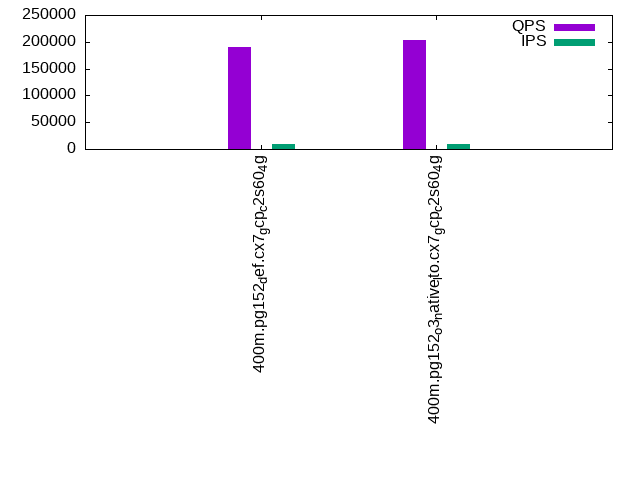
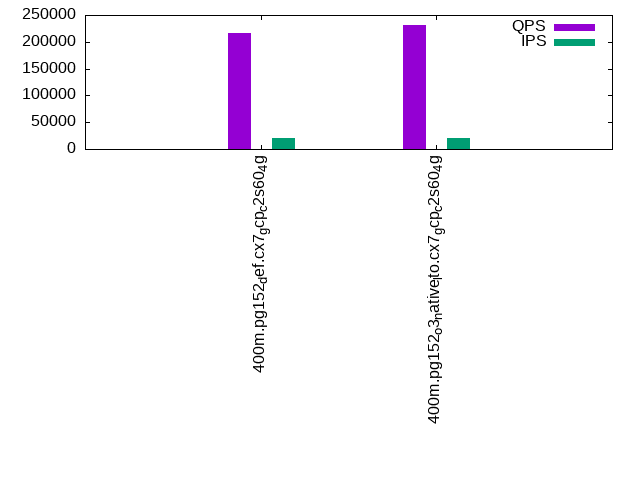
| 400m.pg152_def.cx7_gcp_c2s60_4g | 1095890 | 295713 | 33394 | 187282 | 189846 | 215549 |
| 400m.pg152_o3_native_lto.cx7_gcp_c2s60_4g | 1120448 | 301734 | 33484 | 199988 | 202582 | 231098 |
This lists the average rate of inserts/s for the tests that do inserts concurrent with queries. For such tests the query rate is listed in the table above. The read+write tests are setup so that the insert rate should match the target rate every second. Cells that are not at least 95% of the target have a red background to indicate a failure to satisfy the target.
| dbms | q100.1 | q500.1 | q1000.1 |
|---|---|---|---|
| pg152_def.cx7_gcp_c2s60_4g | 1976 | 9885 | 19672 |
| pg152_o3_native_lto.cx7_gcp_c2s60_4g | 1976 | 9885 | 19694 |
| target | 2000 | 10000 | 20000 |
l.i0
l.i0: load without secondary indexes. Graphs for performance per 1-second interval are here.
Average throughput:
Insert response time histogram: each cell has the percentage of responses that take <= the time in the header and max is the max response time in seconds. For the max column values in the top 25% of the range have a red background and in the bottom 25% of the range have a green background. The red background is not used when the min value is within 80% of the max value.
| dbms | 256us | 1ms | 4ms | 16ms | 64ms | 256ms | 1s | 4s | 16s | gt | max |
|---|---|---|---|---|---|---|---|---|---|---|---|
| pg152_def.cx7_gcp_c2s60_4g | 22.015 | 75.132 | 2.779 | 0.027 | 0.031 | 0.015 | 0.001 | 1.135 | |||
| pg152_o3_native_lto.cx7_gcp_c2s60_4g | 30.850 | 66.192 | 2.886 | 0.025 | 0.031 | 0.016 | 0.001 | 1.153 |
Performance metrics for the DBMS listed above. Some are normalized by throughput, others are not. Legend for results is here.
ips	qps	rps	rmbps	wps	wmbps	rpq	rkbpq	wpi	wkbpi	csps	cpups	cspq	cpupq	dbgb1	dbgb2	rss	maxop	p50	p99	tag
1095890	0	194	4.5	2232.8	462.8	0.000	0.004	0.002	0.432	289620	57.6	0.264	16	43.0	112.6	NA	1.135	61132	13091	400m.pg152_def.cx7_gcp_c2s60_4g
1120448	0	207	4.7	2271.6	476.3	0.000	0.004	0.002	0.435	323412	56.7	0.289	15	43.0	112.5	NA	1.153	62732	10189	400m.pg152_o3_native_lto.cx7_gcp_c2s60_4g
l.x
l.x: create secondary indexes.
Average throughput:
Performance metrics for the DBMS listed above. Some are normalized by throughput, others are not. Legend for results is here.
ips	qps	rps	rmbps	wps	wmbps	rpq	rkbpq	wpi	wkbpi	csps	cpups	cspq	cpupq	dbgb1	dbgb2	rss	maxop	p50	p99	tag
295713	0	2114	41.0	496.6	112.3	0.007	0.142	0.002	0.389	1957	3.3	0.007	3	78.3	161.9	0.0	0.002	NA	NA	400m.pg152_def.cx7_gcp_c2s60_4g
301734	0	2211	43.4	517.5	117.7	0.007	0.147	0.002	0.399	2043	3.3	0.007	3	78.3	162.9	0.0	0.002	NA	NA	400m.pg152_o3_native_lto.cx7_gcp_c2s60_4g
l.i1
l.i1: continue load after secondary indexes created. Graphs for performance per 1-second interval are here.
Average throughput:
Insert response time histogram: each cell has the percentage of responses that take <= the time in the header and max is the max response time in seconds. For the max column values in the top 25% of the range have a red background and in the bottom 25% of the range have a green background. The red background is not used when the min value is within 80% of the max value.
| dbms | 256us | 1ms | 4ms | 16ms | 64ms | 256ms | 1s | 4s | 16s | gt | max |
|---|---|---|---|---|---|---|---|---|---|---|---|
| pg152_def.cx7_gcp_c2s60_4g | 0.046 | 5.715 | 88.848 | 5.389 | 0.003 | 0.668 | |||||
| pg152_o3_native_lto.cx7_gcp_c2s60_4g | 0.059 | 5.799 | 88.801 | 5.339 | 0.003 | 0.415 |
Performance metrics for the DBMS listed above. Some are normalized by throughput, others are not. Legend for results is here.
ips	qps	rps	rmbps	wps	wmbps	rpq	rkbpq	wpi	wkbpi	csps	cpups	cspq	cpupq	dbgb1	dbgb2	rss	maxop	p50	p99	tag
33394	0	71268	660.4	60853.8	583.2	2.134	20.249	1.822	17.883	128815	12.8	3.857	115	170.2	250.3	0.0	0.668	1698	749	400m.pg152_def.cx7_gcp_c2s60_4g
33484	0	71454	663.1	60922.3	584.9	2.134	20.277	1.819	17.888	129359	12.5	3.863	112	170.2	252.0	0.0	0.415	1698	749	400m.pg152_o3_native_lto.cx7_gcp_c2s60_4g
q100.1
q100.1: range queries with 100 insert/s per client. Graphs for performance per 1-second interval are here.
Average throughput:
Query response time histogram: each cell has the percentage of responses that take <= the time in the header and max is the max response time in seconds. For max values in the top 25% of the range have a red background and in the bottom 25% of the range have a green background. The red background is not used when the min value is within 80% of the max value.
| dbms | 256us | 1ms | 4ms | 16ms | 64ms | 256ms | 1s | 4s | 16s | gt | max |
|---|---|---|---|---|---|---|---|---|---|---|---|
| pg152_def.cx7_gcp_c2s60_4g | 99.903 | 0.093 | 0.002 | 0.001 | nonzero | nonzero | 0.126 | ||||
| pg152_o3_native_lto.cx7_gcp_c2s60_4g | 99.927 | 0.070 | 0.002 | 0.001 | nonzero | 0.027 |
Insert response time histogram: each cell has the percentage of responses that take <= the time in the header and max is the max response time in seconds. For max values in the top 25% of the range have a red background and in the bottom 25% of the range have a green background. The red background is not used when the min value is within 80% of the max value.
| dbms | 256us | 1ms | 4ms | 16ms | 64ms | 256ms | 1s | 4s | 16s | gt | max |
|---|---|---|---|---|---|---|---|---|---|---|---|
| pg152_def.cx7_gcp_c2s60_4g | 0.800 | 99.094 | 0.044 | 0.061 | 0.385 | ||||||
| pg152_o3_native_lto.cx7_gcp_c2s60_4g | 0.690 | 99.239 | 0.036 | 0.035 | 0.479 |
Performance metrics for the DBMS listed above. Some are normalized by throughput, others are not. Legend for results is here.
ips	qps	rps	rmbps	wps	wmbps	rpq	rkbpq	wpi	wkbpi	csps	cpups	cspq	cpupq	dbgb1	dbgb2	rss	maxop	p50	p99	tag
1976	187282	3750	38.4	4121.4	50.9	0.020	0.210	2.086	26.375	670799	63.2	3.582	101	171.1	230.6	0.0	0.126	9302	8870	400m.pg152_def.cx7_gcp_c2s60_4g
1976	199988	3761	38.6	4124.0	51.0	0.019	0.198	2.087	26.427	713561	62.6	3.568	94	171.1	232.2	0.0	0.027	10021	9573	400m.pg152_o3_native_lto.cx7_gcp_c2s60_4g
q500.1
q500.1: range queries with 500 insert/s per client. Graphs for performance per 1-second interval are here.
Average throughput:
Query response time histogram: each cell has the percentage of responses that take <= the time in the header and max is the max response time in seconds. For max values in the top 25% of the range have a red background and in the bottom 25% of the range have a green background. The red background is not used when the min value is within 80% of the max value.
| dbms | 256us | 1ms | 4ms | 16ms | 64ms | 256ms | 1s | 4s | 16s | gt | max |
|---|---|---|---|---|---|---|---|---|---|---|---|
| pg152_def.cx7_gcp_c2s60_4g | 99.643 | 0.345 | 0.011 | 0.001 | nonzero | 0.028 | |||||
| pg152_o3_native_lto.cx7_gcp_c2s60_4g | 99.708 | 0.280 | 0.011 | 0.001 | nonzero | 0.030 |
Insert response time histogram: each cell has the percentage of responses that take <= the time in the header and max is the max response time in seconds. For max values in the top 25% of the range have a red background and in the bottom 25% of the range have a green background. The red background is not used when the min value is within 80% of the max value.
| dbms | 256us | 1ms | 4ms | 16ms | 64ms | 256ms | 1s | 4s | 16s | gt | max |
|---|---|---|---|---|---|---|---|---|---|---|---|
| pg152_def.cx7_gcp_c2s60_4g | 0.902 | 99.073 | 0.026 | 0.166 | |||||||
| pg152_o3_native_lto.cx7_gcp_c2s60_4g | 0.878 | 99.089 | 0.026 | 0.007 | 0.329 |
Performance metrics for the DBMS listed above. Some are normalized by throughput, others are not. Legend for results is here.
ips	qps	rps	rmbps	wps	wmbps	rpq	rkbpq	wpi	wkbpi	csps	cpups	cspq	cpupq	dbgb1	dbgb2	rss	maxop	p50	p99	tag
9885	189846	17426	183.1	19528.3	207.4	0.092	0.987	1.976	21.483	657913	65.7	3.466	104	176.0	231.1	0.0	0.028	9413	8778	400m.pg152_def.cx7_gcp_c2s60_4g
9885	202582	17609	183.8	19534.4	208.8	0.087	0.929	1.976	21.629	699796	65.4	3.454	97	176.0	229.8	0.0	0.030	10053	9338	400m.pg152_o3_native_lto.cx7_gcp_c2s60_4g
q1000.1
q1000.1: range queries with 1000 insert/s per client. Graphs for performance per 1-second interval are here.
Average throughput:
Query response time histogram: each cell has the percentage of responses that take <= the time in the header and max is the max response time in seconds. For max values in the top 25% of the range have a red background and in the bottom 25% of the range have a green background. The red background is not used when the min value is within 80% of the max value.
| dbms | 256us | 1ms | 4ms | 16ms | 64ms | 256ms | 1s | 4s | 16s | gt | max |
|---|---|---|---|---|---|---|---|---|---|---|---|
| pg152_def.cx7_gcp_c2s60_4g | 99.423 | 0.555 | 0.021 | 0.001 | nonzero | nonzero | 0.082 | ||||
| pg152_o3_native_lto.cx7_gcp_c2s60_4g | 99.512 | 0.470 | 0.017 | 0.001 | nonzero | nonzero | 0.069 |
Insert response time histogram: each cell has the percentage of responses that take <= the time in the header and max is the max response time in seconds. For max values in the top 25% of the range have a red background and in the bottom 25% of the range have a green background. The red background is not used when the min value is within 80% of the max value.
| dbms | 256us | 1ms | 4ms | 16ms | 64ms | 256ms | 1s | 4s | 16s | gt | max |
|---|---|---|---|---|---|---|---|---|---|---|---|
| pg152_def.cx7_gcp_c2s60_4g | 1.481 | 93.428 | 5.087 | 0.004 | 0.585 | ||||||
| pg152_o3_native_lto.cx7_gcp_c2s60_4g | 2.145 | 92.861 | 4.993 | 0.001 | 0.411 |
Performance metrics for the DBMS listed above. Some are normalized by throughput, others are not. Legend for results is here.
ips	qps	rps	rmbps	wps	wmbps	rpq	rkbpq	wpi	wkbpi	csps	cpups	cspq	cpupq	dbgb1	dbgb2	rss	maxop	p50	p99	tag
19672	215549	37684	381.7	37406.8	393.5	0.175	1.813	1.902	20.482	670476	69.7	3.111	97	189.4	261.2	0.0	0.082	10644	8027	400m.pg152_def.cx7_gcp_c2s60_4g
19694	231098	37974	384.3	37296.6	391.6	0.164	1.703	1.894	20.364	718858	69.6	3.111	90	189.4	261.2	0.0	0.069	11385	8602	400m.pg152_o3_native_lto.cx7_gcp_c2s60_4g
l.i0
l.i0: load without secondary indexes
Performance metrics for all DBMS, not just the ones listed above. Some are normalized by throughput, others are not. Legend for results is here.
ips	qps	rps	rmbps	wps	wmbps	rpq	rkbpq	wpi	wkbpi	csps	cpups	cspq	cpupq	dbgb1	dbgb2	rss	maxop	p50	p99	tag
1095890	0	194	4.5	2232.8	462.8	0.000	0.004	0.002	0.432	289620	57.6	0.264	16	43.0	112.6	NA	1.135	61132	13091	400m.pg152_def.cx7_gcp_c2s60_4g
1120448	0	207	4.7	2271.6	476.3	0.000	0.004	0.002	0.435	323412	56.7	0.289	15	43.0	112.5	NA	1.153	62732	10189	400m.pg152_o3_native_lto.cx7_gcp_c2s60_4g
l.x
l.x: create secondary indexes
Performance metrics for all DBMS, not just the ones listed above. Some are normalized by throughput, others are not. Legend for results is here.
ips	qps	rps	rmbps	wps	wmbps	rpq	rkbpq	wpi	wkbpi	csps	cpups	cspq	cpupq	dbgb1	dbgb2	rss	maxop	p50	p99	tag
295713	0	2114	41.0	496.6	112.3	0.007	0.142	0.002	0.389	1957	3.3	0.007	3	78.3	161.9	0.0	0.002	NA	NA	400m.pg152_def.cx7_gcp_c2s60_4g
301734	0	2211	43.4	517.5	117.7	0.007	0.147	0.002	0.399	2043	3.3	0.007	3	78.3	162.9	0.0	0.002	NA	NA	400m.pg152_o3_native_lto.cx7_gcp_c2s60_4g
l.i1
l.i1: continue load after secondary indexes created
Performance metrics for all DBMS, not just the ones listed above. Some are normalized by throughput, others are not. Legend for results is here.
ips	qps	rps	rmbps	wps	wmbps	rpq	rkbpq	wpi	wkbpi	csps	cpups	cspq	cpupq	dbgb1	dbgb2	rss	maxop	p50	p99	tag
33394	0	71268	660.4	60853.8	583.2	2.134	20.249	1.822	17.883	128815	12.8	3.857	115	170.2	250.3	0.0	0.668	1698	749	400m.pg152_def.cx7_gcp_c2s60_4g
33484	0	71454	663.1	60922.3	584.9	2.134	20.277	1.819	17.888	129359	12.5	3.863	112	170.2	252.0	0.0	0.415	1698	749	400m.pg152_o3_native_lto.cx7_gcp_c2s60_4g
q100.1
q100.1: range queries with 100 insert/s per client
Performance metrics for all DBMS, not just the ones listed above. Some are normalized by throughput, others are not. Legend for results is here.
ips	qps	rps	rmbps	wps	wmbps	rpq	rkbpq	wpi	wkbpi	csps	cpups	cspq	cpupq	dbgb1	dbgb2	rss	maxop	p50	p99	tag
1976	187282	3750	38.4	4121.4	50.9	0.020	0.210	2.086	26.375	670799	63.2	3.582	101	171.1	230.6	0.0	0.126	9302	8870	400m.pg152_def.cx7_gcp_c2s60_4g
1976	199988	3761	38.6	4124.0	51.0	0.019	0.198	2.087	26.427	713561	62.6	3.568	94	171.1	232.2	0.0	0.027	10021	9573	400m.pg152_o3_native_lto.cx7_gcp_c2s60_4g
q500.1
q500.1: range queries with 500 insert/s per client
Performance metrics for all DBMS, not just the ones listed above. Some are normalized by throughput, others are not. Legend for results is here.
ips	qps	rps	rmbps	wps	wmbps	rpq	rkbpq	wpi	wkbpi	csps	cpups	cspq	cpupq	dbgb1	dbgb2	rss	maxop	p50	p99	tag
9885	189846	17426	183.1	19528.3	207.4	0.092	0.987	1.976	21.483	657913	65.7	3.466	104	176.0	231.1	0.0	0.028	9413	8778	400m.pg152_def.cx7_gcp_c2s60_4g
9885	202582	17609	183.8	19534.4	208.8	0.087	0.929	1.976	21.629	699796	65.4	3.454	97	176.0	229.8	0.0	0.030	10053	9338	400m.pg152_o3_native_lto.cx7_gcp_c2s60_4g
q1000.1
q1000.1: range queries with 1000 insert/s per client
Performance metrics for all DBMS, not just the ones listed above. Some are normalized by throughput, others are not. Legend for results is here.
ips	qps	rps	rmbps	wps	wmbps	rpq	rkbpq	wpi	wkbpi	csps	cpups	cspq	cpupq	dbgb1	dbgb2	rss	maxop	p50	p99	tag
19672	215549	37684	381.7	37406.8	393.5	0.175	1.813	1.902	20.482	670476	69.7	3.111	97	189.4	261.2	0.0	0.082	10644	8027	400m.pg152_def.cx7_gcp_c2s60_4g
19694	231098	37974	384.3	37296.6	391.6	0.164	1.703	1.894	20.364	718858	69.6	3.111	90	189.4	261.2	0.0	0.069	11385	8602	400m.pg152_o3_native_lto.cx7_gcp_c2s60_4g
l.i0
- l.i0: load without secondary indexes
- Legend for results is here.
- Each entry lists the percentage of responses that fit in that bucket (slower than max time for previous bucket, faster than min time for next bucket).
Insert response time histogram
256us	1ms	4ms	16ms	64ms	256ms	1s	4s	16s	gt	max	tag
0.000	22.015	75.132	2.779	0.027	0.031	0.015	0.001	0.000	0.000	1.135	pg152_def.cx7_gcp_c2s60_4g
0.000	30.850	66.192	2.886	0.025	0.031	0.016	0.001	0.000	0.000	1.153	pg152_o3_native_lto.cx7_gcp_c2s60_4g
l.x
- l.x: create secondary indexes
- Legend for results is here.
- Each entry lists the percentage of responses that fit in that bucket (slower than max time for previous bucket, faster than min time for next bucket).
TODO - determine whether there is data for create index response time
l.i1
- l.i1: continue load after secondary indexes created
- Legend for results is here.
- Each entry lists the percentage of responses that fit in that bucket (slower than max time for previous bucket, faster than min time for next bucket).
Insert response time histogram
256us	1ms	4ms	16ms	64ms	256ms	1s	4s	16s	gt	max	tag
0.000	0.000	0.046	5.715	88.848	5.389	0.003	0.000	0.000	0.000	0.668	pg152_def.cx7_gcp_c2s60_4g
0.000	0.000	0.059	5.799	88.801	5.339	0.003	0.000	0.000	0.000	0.415	pg152_o3_native_lto.cx7_gcp_c2s60_4g
q100.1
- q100.1: range queries with 100 insert/s per client
- Legend for results is here.
- Each entry lists the percentage of responses that fit in that bucket (slower than max time for previous bucket, faster than min time for next bucket).
Query response time histogram
256us	1ms	4ms	16ms	64ms	256ms	1s	4s	16s	gt	max	tag
99.903	0.093	0.002	0.001	nonzero	nonzero	0.000	0.000	0.000	0.000	0.126	pg152_def.cx7_gcp_c2s60_4g
99.927	0.070	0.002	0.001	nonzero	0.000	0.000	0.000	0.000	0.000	0.027	pg152_o3_native_lto.cx7_gcp_c2s60_4g
Insert response time histogram
256us	1ms	4ms	16ms	64ms	256ms	1s	4s	16s	gt	max	tag
0.000	0.000	0.000	0.800	99.094	0.044	0.061	0.000	0.000	0.000	0.385	pg152_def.cx7_gcp_c2s60_4g
0.000	0.000	0.000	0.690	99.239	0.036	0.035	0.000	0.000	0.000	0.479	pg152_o3_native_lto.cx7_gcp_c2s60_4g
q500.1
- q500.1: range queries with 500 insert/s per client
- Legend for results is here.
- Each entry lists the percentage of responses that fit in that bucket (slower than max time for previous bucket, faster than min time for next bucket).
Query response time histogram
256us	1ms	4ms	16ms	64ms	256ms	1s	4s	16s	gt	max	tag
99.643	0.345	0.011	0.001	nonzero	0.000	0.000	0.000	0.000	0.000	0.028	pg152_def.cx7_gcp_c2s60_4g
99.708	0.280	0.011	0.001	nonzero	0.000	0.000	0.000	0.000	0.000	0.030	pg152_o3_native_lto.cx7_gcp_c2s60_4g
Insert response time histogram
256us	1ms	4ms	16ms	64ms	256ms	1s	4s	16s	gt	max	tag
0.000	0.000	0.000	0.902	99.073	0.026	0.000	0.000	0.000	0.000	0.166	pg152_def.cx7_gcp_c2s60_4g
0.000	0.000	0.000	0.878	99.089	0.026	0.007	0.000	0.000	0.000	0.329	pg152_o3_native_lto.cx7_gcp_c2s60_4g
q1000.1
- q1000.1: range queries with 1000 insert/s per client
- Legend for results is here.
- Each entry lists the percentage of responses that fit in that bucket (slower than max time for previous bucket, faster than min time for next bucket).
Query response time histogram
256us	1ms	4ms	16ms	64ms	256ms	1s	4s	16s	gt	max	tag
99.423	0.555	0.021	0.001	nonzero	nonzero	0.000	0.000	0.000	0.000	0.082	pg152_def.cx7_gcp_c2s60_4g
99.512	0.470	0.017	0.001	nonzero	nonzero	0.000	0.000	0.000	0.000	0.069	pg152_o3_native_lto.cx7_gcp_c2s60_4g
Insert response time histogram
256us	1ms	4ms	16ms	64ms	256ms	1s	4s	16s	gt	max	tag
0.000	0.000	0.000	1.481	93.428	5.087	0.004	0.000	0.000	0.000	0.585	pg152_def.cx7_gcp_c2s60_4g
0.000	0.000	0.000	2.145	92.861	4.993	0.001	0.000	0.000	0.000	0.411	pg152_o3_native_lto.cx7_gcp_c2s60_4g