Introduction
This is a report for the insert benchmark with 400M docs and 20 client(s). It is generated by scripts (bash, awk, sed) and Tufte might not be impressed. An overview of the insert benchmark is here and a short update is here. Below, by DBMS, I mean DBMS+version.config. An example is my8020.c10b40 where my means MySQL, 8020 is version 8.0.20 and c10b40 is the name for the configuration file.
The test server is a c2-standard-60 from GCP with 30 cores, hyperthreading disabled, 240G RAM and 3T from XFS and SW RAID 0 striped over 8 local NVMe drives. The benchmark was run with 20 clients and there were 1 or 2 connections per client (1 for queries, 1 for inserts). The benchmark loads 400M rows without secondary indexes, creates secondary indexes, loads another 400M rows then does 3 read+write tests for one hour each that do queries as fast as possible with 100, 500 and then 1000 writes/second/client concurrent with the queries. Each read-write test runs for 1800 seconds. The test was configured to use a table per client. The database is cached by the storage engine and the only IO is for writes. Clients and the DBMS share one server. The per-database configs are in the per-database subdirectories here.
The tested DBMS are:
- pg152_def.cx7_gcp_c2s60 - Postgres 15.2, the cx7_gcp_c2s60 config and a default build that used -O2
- pg152_o3_native_lto.cx7_gcp_c2s60 - Postgres 15.2, the cx7_gcp_c2s60 config and a build that uses -O3 -march=native -mtune=native -flto (link-time optimization)
Contents
- Summary
- l.i0: load without secondary indexes
- l.x: create secondary indexes
- l.i1: continue load after secondary indexes created
- q100.1: range queries with 100 insert/s per client
- q500.1: range queries with 500 insert/s per client
- q1000.1: range queries with 1000 insert/s per client
Summary
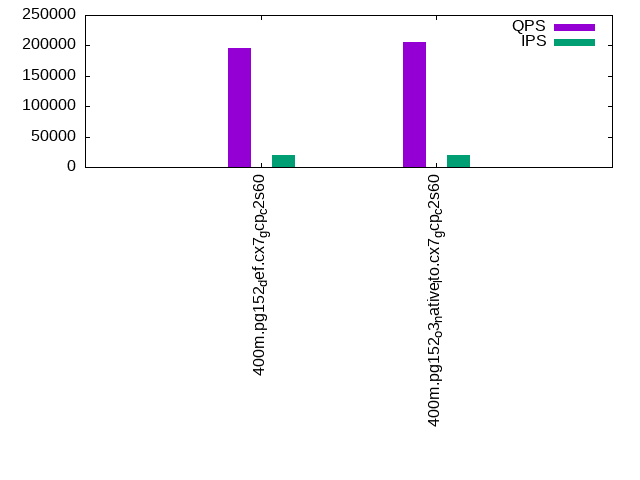
The numbers are inserts/s for l.i0 and l.i1, indexed docs (or rows) /s for l.x and queries/s for q*.2. The values are the average rate over the entire test for inserts (IPS) and queries (QPS). The range of values for IPS and QPS is split into 3 parts: bottom 25%, middle 50%, top 25%. Values in the bottom 25% have a red background, values in the top 25% have a green background and values in the middle have no color. A gray background is used for values that can be ignored because the DBMS did not sustain the target insert rate. Red backgrounds are not used when the minimum value is within 80% of the max value.
| dbms | l.i0 | l.x | l.i1 | q100.1 | q500.1 | q1000.1 |
|---|---|---|---|---|---|---|
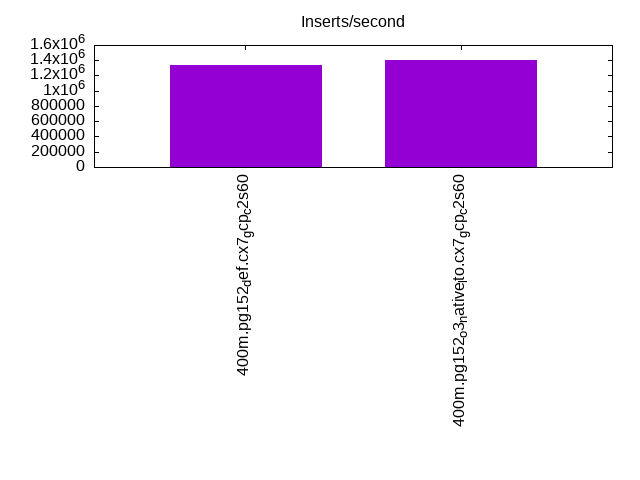
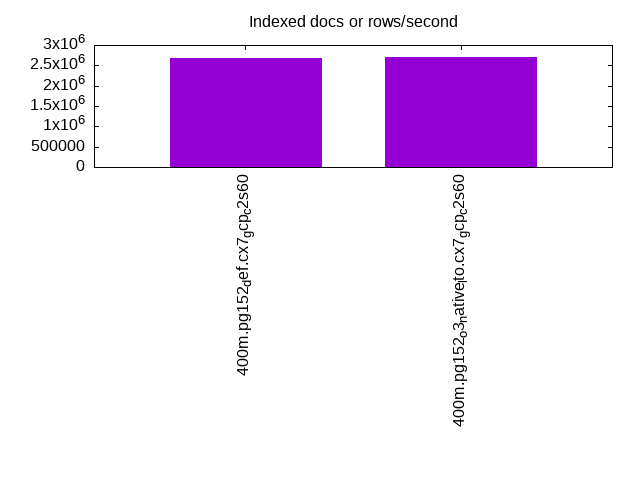
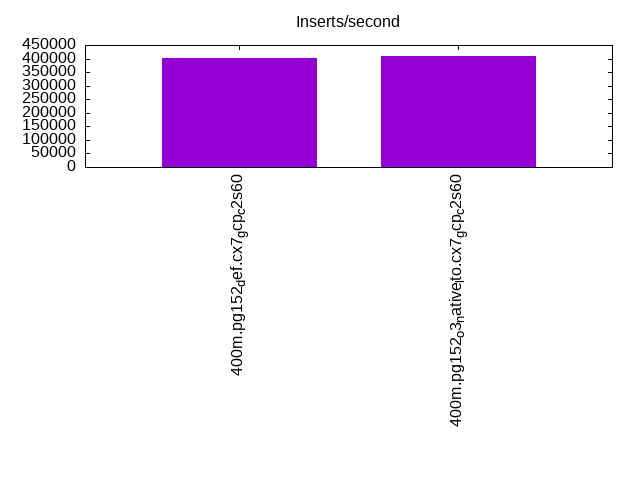
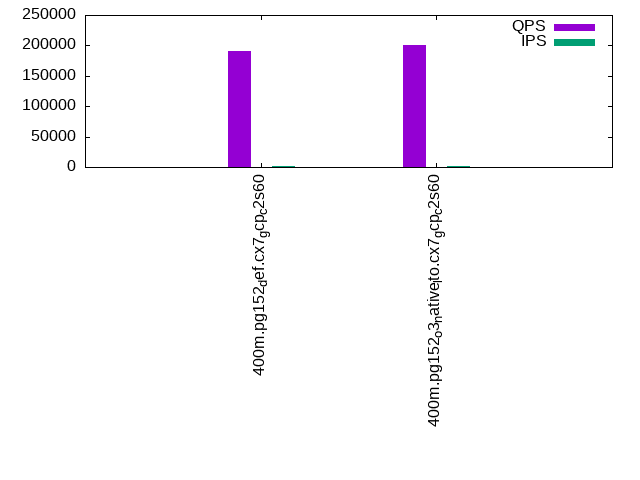
| 400m.pg152_def.cx7_gcp_c2s60 | 1342282 | 2685235 | 402414 | 191272 | 193504 | 195260 |
| 400m.pg152_o3_native_lto.cx7_gcp_c2s60 | 1403509 | 2703378 | 408163 | 200679 | 201426 | 205134 |
This lists the average rate of inserts/s for the tests that do inserts concurrent with queries. For such tests the query rate is listed in the table above. The read+write tests are setup so that the insert rate should match the target rate every second. Cells that are not at least 95% of the target have a red background to indicate a failure to satisfy the target.
| dbms | q100.1 | q500.1 | q1000.1 |
|---|---|---|---|
| pg152_def.cx7_gcp_c2s60 | 1977 | 9885 | 19769 |
| pg152_o3_native_lto.cx7_gcp_c2s60 | 1976 | 9885 | 19769 |
| target | 2000 | 10000 | 20000 |
l.i0
l.i0: load without secondary indexes. Graphs for performance per 1-second interval are here.
Average throughput:
Insert response time histogram: each cell has the percentage of responses that take <= the time in the header and max is the max response time in seconds. For the max column values in the top 25% of the range have a red background and in the bottom 25% of the range have a green background. The red background is not used when the min value is within 80% of the max value.
| dbms | 256us | 1ms | 4ms | 16ms | 64ms | 256ms | 1s | 4s | 16s | gt | max |
|---|---|---|---|---|---|---|---|---|---|---|---|
| pg152_def.cx7_gcp_c2s60 | 58.019 | 41.032 | 0.911 | 0.008 | 0.013 | 0.016 | 0.001 | 1.391 | |||
| pg152_o3_native_lto.cx7_gcp_c2s60 | 58.790 | 40.412 | 0.743 | 0.018 | 0.022 | 0.015 | 0.605 |
Performance metrics for the DBMS listed above. Some are normalized by throughput, others are not. Legend for results is here.
ips	qps	rps	rmbps	wps	wmbps	rpq	rkbpq	wpi	wkbpi	csps	cpups	cspq	cpupq	dbgb1	dbgb2	rss	maxop	p50	p99	tag
1342282	0	0	0.0	1789.6	447.1	0.000	0.000	0.001	0.341	238565	59.9	0.178	13	38.3	104.3	NA	1.391	76242	8890	400m.pg152_def.cx7_gcp_c2s60
1403509	0	0	0.0	1862.6	465.8	0.000	0.000	0.001	0.340	256157	59.0	0.183	13	38.3	103.4	0.0	0.605	79014	9590	400m.pg152_o3_native_lto.cx7_gcp_c2s60
l.x
l.x: create secondary indexes.
Average throughput:
Performance metrics for the DBMS listed above. Some are normalized by throughput, others are not. Legend for results is here.
ips	qps	rps	rmbps	wps	wmbps	rpq	rkbpq	wpi	wkbpi	csps	cpups	cspq	cpupq	dbgb1	dbgb2	rss	maxop	p50	p99	tag
2685235	0	10190	109.5	3306.3	836.4	0.004	0.042	0.001	0.319	107384	26.7	0.040	3	73.5	173.2	0.0	0.272	NA	NA	400m.pg152_def.cx7_gcp_c2s60
2703378	0	9760	107.1	3243.2	830.7	0.004	0.041	0.001	0.315	108973	26.0	0.040	3	73.5	171.7	0.0	0.055	NA	NA	400m.pg152_o3_native_lto.cx7_gcp_c2s60
l.i1
l.i1: continue load after secondary indexes created. Graphs for performance per 1-second interval are here.
Average throughput:
Insert response time histogram: each cell has the percentage of responses that take <= the time in the header and max is the max response time in seconds. For the max column values in the top 25% of the range have a red background and in the bottom 25% of the range have a green background. The red background is not used when the min value is within 80% of the max value.
| dbms | 256us | 1ms | 4ms | 16ms | 64ms | 256ms | 1s | 4s | 16s | gt | max |
|---|---|---|---|---|---|---|---|---|---|---|---|
| pg152_def.cx7_gcp_c2s60 | nonzero | 95.848 | 2.743 | 1.368 | 0.026 | 0.015 | 0.970 | ||||
| pg152_o3_native_lto.cx7_gcp_c2s60 | 0.004 | 95.933 | 2.639 | 1.384 | 0.025 | 0.015 | nonzero | 1.073 |
Performance metrics for the DBMS listed above. Some are normalized by throughput, others are not. Legend for results is here.
ips	qps	rps	rmbps	wps	wmbps	rpq	rkbpq	wpi	wkbpi	csps	cpups	cspq	cpupq	dbgb1	dbgb2	rss	maxop	p50	p99	tag
402414	0	5059	44.9	3499.8	521.0	0.013	0.114	0.009	1.326	300092	51.9	0.746	39	163.3	356.3	NA	0.970	25472	1699	400m.pg152_def.cx7_gcp_c2s60
408163	0	5261	45.3	3288.3	523.9	0.013	0.114	0.008	1.314	313851	50.9	0.769	37	163.3	356.5	0.0	1.073	26071	1848	400m.pg152_o3_native_lto.cx7_gcp_c2s60
q100.1
q100.1: range queries with 100 insert/s per client. Graphs for performance per 1-second interval are here.
Average throughput:
Query response time histogram: each cell has the percentage of responses that take <= the time in the header and max is the max response time in seconds. For max values in the top 25% of the range have a red background and in the bottom 25% of the range have a green background. The red background is not used when the min value is within 80% of the max value.
| dbms | 256us | 1ms | 4ms | 16ms | 64ms | 256ms | 1s | 4s | 16s | gt | max |
|---|---|---|---|---|---|---|---|---|---|---|---|
| pg152_def.cx7_gcp_c2s60 | 99.971 | 0.022 | 0.006 | 0.001 | nonzero | 0.024 | |||||
| pg152_o3_native_lto.cx7_gcp_c2s60 | 99.977 | 0.017 | 0.006 | 0.001 | nonzero | nonzero | 0.073 |
Insert response time histogram: each cell has the percentage of responses that take <= the time in the header and max is the max response time in seconds. For max values in the top 25% of the range have a red background and in the bottom 25% of the range have a green background. The red background is not used when the min value is within 80% of the max value.
| dbms | 256us | 1ms | 4ms | 16ms | 64ms | 256ms | 1s | 4s | 16s | gt | max |
|---|---|---|---|---|---|---|---|---|---|---|---|
| pg152_def.cx7_gcp_c2s60 | 93.825 | 4.946 | 1.228 | 0.001 | 0.066 | ||||||
| pg152_o3_native_lto.cx7_gcp_c2s60 | 92.774 | 5.997 | 1.203 | 0.026 | 0.107 |
Performance metrics for the DBMS listed above. Some are normalized by throughput, others are not. Legend for results is here.
ips	qps	rps	rmbps	wps	wmbps	rpq	rkbpq	wpi	wkbpi	csps	cpups	cspq	cpupq	dbgb1	dbgb2	rss	maxop	p50	p99	tag
1977	191272	0	0.0	3499.8	84.8	0.000	0.000	1.770	43.912	681653	63.0	3.564	99	163.9	314.2	0.0	0.024	9514	9190	400m.pg152_def.cx7_gcp_c2s60
1976	200679	0	0.0	3577.9	85.1	0.000	0.000	1.811	44.109	714310	62.7	3.559	94	163.9	325.0	0.0	0.073	10041	9653	400m.pg152_o3_native_lto.cx7_gcp_c2s60
q500.1
q500.1: range queries with 500 insert/s per client. Graphs for performance per 1-second interval are here.
Average throughput:

Query response time histogram: each cell has the percentage of responses that take <= the time in the header and max is the max response time in seconds. For max values in the top 25% of the range have a red background and in the bottom 25% of the range have a green background. The red background is not used when the min value is within 80% of the max value.
| dbms | 256us | 1ms | 4ms | 16ms | 64ms | 256ms | 1s | 4s | 16s | gt | max |
|---|---|---|---|---|---|---|---|---|---|---|---|
| pg152_def.cx7_gcp_c2s60 | 99.908 | 0.059 | 0.029 | 0.004 | nonzero | 0.052 | |||||
| pg152_o3_native_lto.cx7_gcp_c2s60 | 99.916 | 0.053 | 0.028 | 0.004 | nonzero | nonzero | 0.067 |
Insert response time histogram: each cell has the percentage of responses that take <= the time in the header and max is the max response time in seconds. For max values in the top 25% of the range have a red background and in the bottom 25% of the range have a green background. The red background is not used when the min value is within 80% of the max value.
| dbms | 256us | 1ms | 4ms | 16ms | 64ms | 256ms | 1s | 4s | 16s | gt | max |
|---|---|---|---|---|---|---|---|---|---|---|---|
| pg152_def.cx7_gcp_c2s60 | 45.259 | 24.771 | 28.699 | 1.270 | 0.001 | 0.272 | |||||
| pg152_o3_native_lto.cx7_gcp_c2s60 | 45.207 | 24.648 | 28.909 | 1.235 | 0.187 |
Performance metrics for the DBMS listed above. Some are normalized by throughput, others are not. Legend for results is here.
ips	qps	rps	rmbps	wps	wmbps	rpq	rkbpq	wpi	wkbpi	csps	cpups	cspq	cpupq	dbgb1	dbgb2	rss	maxop	p50	p99	tag
9885	193504	0	0.0	6143.1	193.5	0.000	0.000	0.621	20.046	677578	63.9	3.502	99	167.5	270.5	0.0	0.052	9609	9126	400m.pg152_def.cx7_gcp_c2s60
9885	201426	0	0.0	6271.8	194.8	0.000	0.000	0.634	20.180	704068	63.8	3.495	95	167.5	270.9	0.0	0.067	10005	9494	400m.pg152_o3_native_lto.cx7_gcp_c2s60
q1000.1
q1000.1: range queries with 1000 insert/s per client. Graphs for performance per 1-second interval are here.
Average throughput:
Query response time histogram: each cell has the percentage of responses that take <= the time in the header and max is the max response time in seconds. For max values in the top 25% of the range have a red background and in the bottom 25% of the range have a green background. The red background is not used when the min value is within 80% of the max value.
| dbms | 256us | 1ms | 4ms | 16ms | 64ms | 256ms | 1s | 4s | 16s | gt | max |
|---|---|---|---|---|---|---|---|---|---|---|---|
| pg152_def.cx7_gcp_c2s60 | 99.847 | 0.102 | 0.043 | 0.008 | 0.001 | 0.063 | |||||
| pg152_o3_native_lto.cx7_gcp_c2s60 | 99.860 | 0.092 | 0.041 | 0.007 | nonzero | nonzero | 0.092 |
Insert response time histogram: each cell has the percentage of responses that take <= the time in the header and max is the max response time in seconds. For max values in the top 25% of the range have a red background and in the bottom 25% of the range have a green background. The red background is not used when the min value is within 80% of the max value.
| dbms | 256us | 1ms | 4ms | 16ms | 64ms | 256ms | 1s | 4s | 16s | gt | max |
|---|---|---|---|---|---|---|---|---|---|---|---|
| pg152_def.cx7_gcp_c2s60 | 58.770 | 21.168 | 19.123 | 0.939 | 0.255 | ||||||
| pg152_o3_native_lto.cx7_gcp_c2s60 | 58.283 | 21.704 | 19.109 | 0.904 | 0.208 |
Performance metrics for the DBMS listed above. Some are normalized by throughput, others are not. Legend for results is here.
ips	qps	rps	rmbps	wps	wmbps	rpq	rkbpq	wpi	wkbpi	csps	cpups	cspq	cpupq	dbgb1	dbgb2	rss	maxop	p50	p99	tag
19769	195260	0	0.0	6340.4	271.7	0.000	0.000	0.321	14.075	664374	65.2	3.403	100	179.6	279.5	0.0	0.063	9765	8822	400m.pg152_def.cx7_gcp_c2s60
19769	205134	0	0.0	6333.6	267.9	0.000	0.000	0.320	13.876	696688	64.9	3.396	95	179.6	279.8	0.0	0.092	10153	9238	400m.pg152_o3_native_lto.cx7_gcp_c2s60
l.i0
l.i0: load without secondary indexes
Performance metrics for all DBMS, not just the ones listed above. Some are normalized by throughput, others are not. Legend for results is here.
ips	qps	rps	rmbps	wps	wmbps	rpq	rkbpq	wpi	wkbpi	csps	cpups	cspq	cpupq	dbgb1	dbgb2	rss	maxop	p50	p99	tag
1342282	0	0	0.0	1789.6	447.1	0.000	0.000	0.001	0.341	238565	59.9	0.178	13	38.3	104.3	NA	1.391	76242	8890	400m.pg152_def.cx7_gcp_c2s60
1403509	0	0	0.0	1862.6	465.8	0.000	0.000	0.001	0.340	256157	59.0	0.183	13	38.3	103.4	0.0	0.605	79014	9590	400m.pg152_o3_native_lto.cx7_gcp_c2s60
l.x
l.x: create secondary indexes
Performance metrics for all DBMS, not just the ones listed above. Some are normalized by throughput, others are not. Legend for results is here.
ips	qps	rps	rmbps	wps	wmbps	rpq	rkbpq	wpi	wkbpi	csps	cpups	cspq	cpupq	dbgb1	dbgb2	rss	maxop	p50	p99	tag
2685235	0	10190	109.5	3306.3	836.4	0.004	0.042	0.001	0.319	107384	26.7	0.040	3	73.5	173.2	0.0	0.272	NA	NA	400m.pg152_def.cx7_gcp_c2s60
2703378	0	9760	107.1	3243.2	830.7	0.004	0.041	0.001	0.315	108973	26.0	0.040	3	73.5	171.7	0.0	0.055	NA	NA	400m.pg152_o3_native_lto.cx7_gcp_c2s60
l.i1
l.i1: continue load after secondary indexes created
Performance metrics for all DBMS, not just the ones listed above. Some are normalized by throughput, others are not. Legend for results is here.
ips	qps	rps	rmbps	wps	wmbps	rpq	rkbpq	wpi	wkbpi	csps	cpups	cspq	cpupq	dbgb1	dbgb2	rss	maxop	p50	p99	tag
402414	0	5059	44.9	3499.8	521.0	0.013	0.114	0.009	1.326	300092	51.9	0.746	39	163.3	356.3	NA	0.970	25472	1699	400m.pg152_def.cx7_gcp_c2s60
408163	0	5261	45.3	3288.3	523.9	0.013	0.114	0.008	1.314	313851	50.9	0.769	37	163.3	356.5	0.0	1.073	26071	1848	400m.pg152_o3_native_lto.cx7_gcp_c2s60
q100.1
q100.1: range queries with 100 insert/s per client
Performance metrics for all DBMS, not just the ones listed above. Some are normalized by throughput, others are not. Legend for results is here.
ips	qps	rps	rmbps	wps	wmbps	rpq	rkbpq	wpi	wkbpi	csps	cpups	cspq	cpupq	dbgb1	dbgb2	rss	maxop	p50	p99	tag
1977	191272	0	0.0	3499.8	84.8	0.000	0.000	1.770	43.912	681653	63.0	3.564	99	163.9	314.2	0.0	0.024	9514	9190	400m.pg152_def.cx7_gcp_c2s60
1976	200679	0	0.0	3577.9	85.1	0.000	0.000	1.811	44.109	714310	62.7	3.559	94	163.9	325.0	0.0	0.073	10041	9653	400m.pg152_o3_native_lto.cx7_gcp_c2s60
q500.1
q500.1: range queries with 500 insert/s per client
Performance metrics for all DBMS, not just the ones listed above. Some are normalized by throughput, others are not. Legend for results is here.
ips	qps	rps	rmbps	wps	wmbps	rpq	rkbpq	wpi	wkbpi	csps	cpups	cspq	cpupq	dbgb1	dbgb2	rss	maxop	p50	p99	tag
9885	193504	0	0.0	6143.1	193.5	0.000	0.000	0.621	20.046	677578	63.9	3.502	99	167.5	270.5	0.0	0.052	9609	9126	400m.pg152_def.cx7_gcp_c2s60
9885	201426	0	0.0	6271.8	194.8	0.000	0.000	0.634	20.180	704068	63.8	3.495	95	167.5	270.9	0.0	0.067	10005	9494	400m.pg152_o3_native_lto.cx7_gcp_c2s60
q1000.1
q1000.1: range queries with 1000 insert/s per client
Performance metrics for all DBMS, not just the ones listed above. Some are normalized by throughput, others are not. Legend for results is here.
ips	qps	rps	rmbps	wps	wmbps	rpq	rkbpq	wpi	wkbpi	csps	cpups	cspq	cpupq	dbgb1	dbgb2	rss	maxop	p50	p99	tag
19769	195260	0	0.0	6340.4	271.7	0.000	0.000	0.321	14.075	664374	65.2	3.403	100	179.6	279.5	0.0	0.063	9765	8822	400m.pg152_def.cx7_gcp_c2s60
19769	205134	0	0.0	6333.6	267.9	0.000	0.000	0.320	13.876	696688	64.9	3.396	95	179.6	279.8	0.0	0.092	10153	9238	400m.pg152_o3_native_lto.cx7_gcp_c2s60
l.i0
- l.i0: load without secondary indexes
- Legend for results is here.
- Each entry lists the percentage of responses that fit in that bucket (slower than max time for previous bucket, faster than min time for next bucket).
Insert response time histogram
256us	1ms	4ms	16ms	64ms	256ms	1s	4s	16s	gt	max	tag
0.000	58.019	41.032	0.911	0.008	0.013	0.016	0.001	0.000	0.000	1.391	pg152_def.cx7_gcp_c2s60
0.000	58.790	40.412	0.743	0.018	0.022	0.015	0.000	0.000	0.000	0.605	pg152_o3_native_lto.cx7_gcp_c2s60
l.x
- l.x: create secondary indexes
- Legend for results is here.
- Each entry lists the percentage of responses that fit in that bucket (slower than max time for previous bucket, faster than min time for next bucket).
TODO - determine whether there is data for create index response time
l.i1
- l.i1: continue load after secondary indexes created
- Legend for results is here.
- Each entry lists the percentage of responses that fit in that bucket (slower than max time for previous bucket, faster than min time for next bucket).
Insert response time histogram
256us	1ms	4ms	16ms	64ms	256ms	1s	4s	16s	gt	max	tag
0.000	nonzero	95.848	2.743	1.368	0.026	0.015	0.000	0.000	0.000	0.970	pg152_def.cx7_gcp_c2s60
0.000	0.004	95.933	2.639	1.384	0.025	0.015	nonzero	0.000	0.000	1.073	pg152_o3_native_lto.cx7_gcp_c2s60
q100.1
- q100.1: range queries with 100 insert/s per client
- Legend for results is here.
- Each entry lists the percentage of responses that fit in that bucket (slower than max time for previous bucket, faster than min time for next bucket).
Query response time histogram
256us	1ms	4ms	16ms	64ms	256ms	1s	4s	16s	gt	max	tag
99.971	0.022	0.006	0.001	nonzero	0.000	0.000	0.000	0.000	0.000	0.024	pg152_def.cx7_gcp_c2s60
99.977	0.017	0.006	0.001	nonzero	nonzero	0.000	0.000	0.000	0.000	0.073	pg152_o3_native_lto.cx7_gcp_c2s60
Insert response time histogram
256us	1ms	4ms	16ms	64ms	256ms	1s	4s	16s	gt	max	tag
0.000	0.000	93.825	4.946	1.228	0.001	0.000	0.000	0.000	0.000	0.066	pg152_def.cx7_gcp_c2s60
0.000	0.000	92.774	5.997	1.203	0.026	0.000	0.000	0.000	0.000	0.107	pg152_o3_native_lto.cx7_gcp_c2s60
q500.1
- q500.1: range queries with 500 insert/s per client
- Legend for results is here.
- Each entry lists the percentage of responses that fit in that bucket (slower than max time for previous bucket, faster than min time for next bucket).
Query response time histogram
256us	1ms	4ms	16ms	64ms	256ms	1s	4s	16s	gt	max	tag
99.908	0.059	0.029	0.004	nonzero	0.000	0.000	0.000	0.000	0.000	0.052	pg152_def.cx7_gcp_c2s60
99.916	0.053	0.028	0.004	nonzero	nonzero	0.000	0.000	0.000	0.000	0.067	pg152_o3_native_lto.cx7_gcp_c2s60
Insert response time histogram
256us	1ms	4ms	16ms	64ms	256ms	1s	4s	16s	gt	max	tag
0.000	0.000	45.259	24.771	28.699	1.270	0.001	0.000	0.000	0.000	0.272	pg152_def.cx7_gcp_c2s60
0.000	0.000	45.207	24.648	28.909	1.235	0.000	0.000	0.000	0.000	0.187	pg152_o3_native_lto.cx7_gcp_c2s60
q1000.1
- q1000.1: range queries with 1000 insert/s per client
- Legend for results is here.
- Each entry lists the percentage of responses that fit in that bucket (slower than max time for previous bucket, faster than min time for next bucket).
Query response time histogram
256us	1ms	4ms	16ms	64ms	256ms	1s	4s	16s	gt	max	tag
99.847	0.102	0.043	0.008	0.001	0.000	0.000	0.000	0.000	0.000	0.063	pg152_def.cx7_gcp_c2s60
99.860	0.092	0.041	0.007	nonzero	nonzero	0.000	0.000	0.000	0.000	0.092	pg152_o3_native_lto.cx7_gcp_c2s60
Insert response time histogram
256us	1ms	4ms	16ms	64ms	256ms	1s	4s	16s	gt	max	tag
0.000	0.000	58.770	21.168	19.123	0.939	0.000	0.000	0.000	0.000	0.255	pg152_def.cx7_gcp_c2s60
0.000	0.000	58.283	21.704	19.109	0.904	0.000	0.000	0.000	0.000	0.208	pg152_o3_native_lto.cx7_gcp_c2s60