Introduction
This is a report for the insert benchmark with 400M docs and 20 client(s). It is generated by scripts (bash, awk, sed) and Tufte might not be impressed. An overview of the insert benchmark is here and a short update is here. Below, by DBMS, I mean DBMS+version.config. An example is my8020.c10b40 where my means MySQL, 8020 is version 8.0.20 and c10b40 is the name for the configuration file.
The test server is a c2-standard-60 from GCP with 30 cores, hyperthreading disabled, 240G RAM and 3T from XFS and SW RAID 0 striped over 8 local NVMe drives. The benchmark was run with 20 clients and there were 1 or 2 connections per client (1 for queries, 1 for inserts). The benchmark loads 400M rows without secondary indexes, creates secondary indexes, loads another 400M rows then does 3 read+write tests for one hour each that do queries as fast as possible with 100, 500 and then 1000 writes/second/client concurrent with the queries. Each read-write test runs for 1800 seconds. The test was configured to use one table. The database fits in the OS page cache but not the DBMS buffer pool. Clients and the DBMS share one server. The per-database configs are in the per-database subdirectories here.
The tested DBMS are:
- pg151_def.cx7_gcp_c2s60_4g - Postgres 15.1, the cx7_gcp_c2s60_4g config and a default build that used -O2
- pg151_o2_nofp.cx7_gcp_c2s60_4g - Postgres 15.1, the cx7_gcp_c2s60_4g config and a build that used -O2 -fno-omit-frame-pointer
- pg151_o3.cx7_gcp_c2s60_4g - Postgres 15.1, the cx7_gcp_c2s60_4g config and a build that used -O3
- pg151_o3_native.cx7_gcp_c2s60_4g - Postgres 15.1, the cx7_gcp_c2s60_4g config and a build that used -O3 -march=native -mtune=native
- pg151_o3_native_lto.cx7_gcp_c2s60_4g - Postgres 15.1, the cx7_gcp_c2s60_4g config and a build that used -O3 -march=native -mtune=native -flto (link-time optimization)
Contents
- Summary
- l.i0: load without secondary indexes
- l.x: create secondary indexes
- l.i1: continue load after secondary indexes created
- q100.1: range queries with 100 insert/s per client
- q500.1: range queries with 500 insert/s per client
- q1000.1: range queries with 1000 insert/s per client
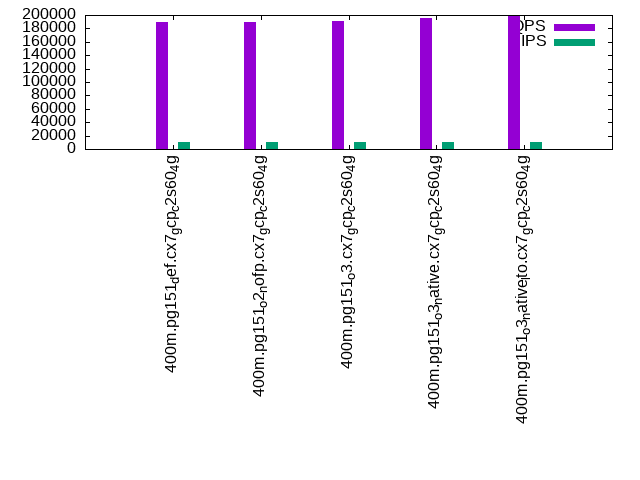
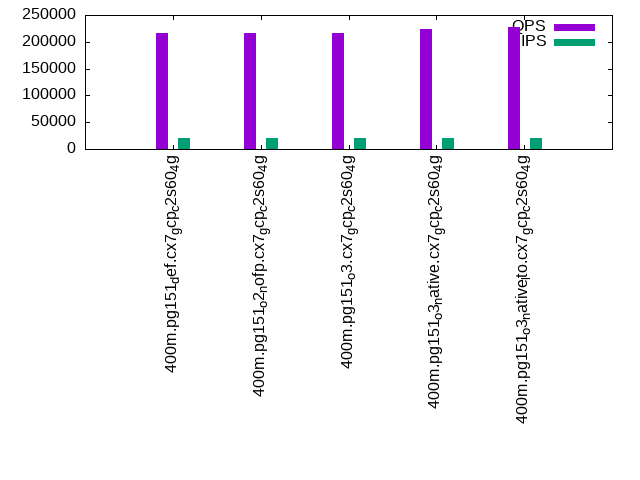
Summary
The numbers are inserts/s for l.i0 and l.i1, indexed docs (or rows) /s for l.x and queries/s for q*.2. The values are the average rate over the entire test for inserts (IPS) and queries (QPS). The range of values for IPS and QPS is split into 3 parts: bottom 25%, middle 50%, top 25%. Values in the bottom 25% have a red background, values in the top 25% have a green background and values in the middle have no color. A gray background is used for values that can be ignored because the DBMS did not sustain the target insert rate. Red backgrounds are not used when the minimum value is within 80% of the max value.
| dbms | l.i0 | l.x | l.i1 | q100.1 | q500.1 | q1000.1 |
|---|---|---|---|---|---|---|
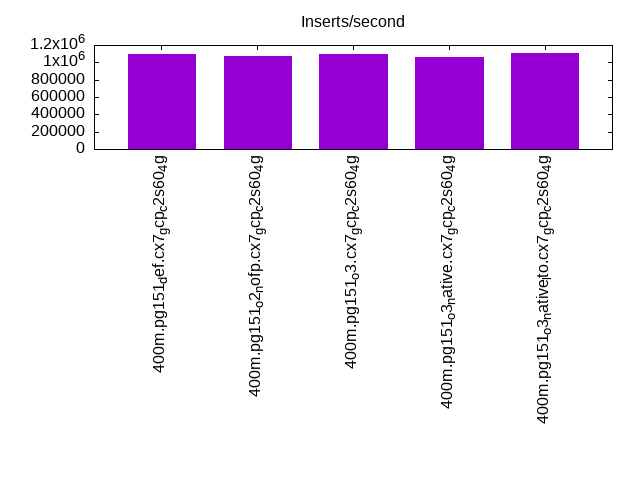
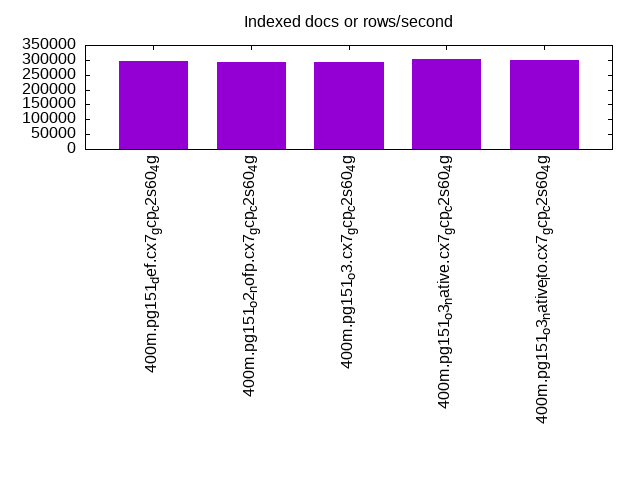
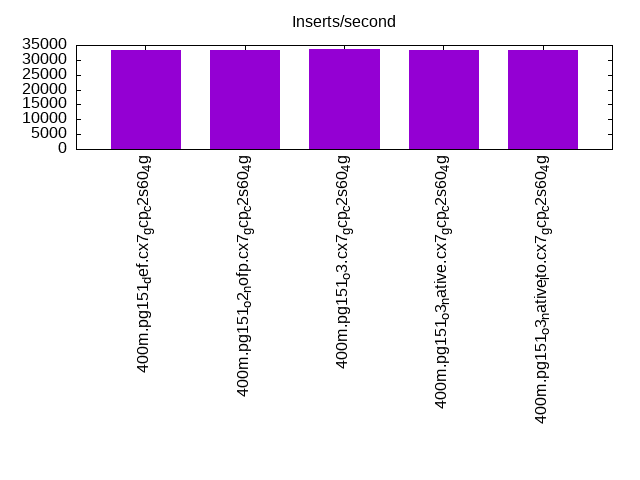
| 400m.pg151_def.cx7_gcp_c2s60_4g | 1095890 | 295277 | 33330 | 188713 | 189832 | 215898 |
| 400m.pg151_o2_nofp.cx7_gcp_c2s60_4g | 1072386 | 292685 | 33381 | 186198 | 188907 | 216473 |
| 400m.pg151_o3.cx7_gcp_c2s60_4g | 1095890 | 293759 | 33506 | 188463 | 191652 | 217319 |
| 400m.pg151_o3_native.cx7_gcp_c2s60_4g | 1061008 | 303336 | 33375 | 193324 | 195197 | 223810 |
| 400m.pg151_o3_native_lto.cx7_gcp_c2s60_4g | 1104972 | 300150 | 33470 | 197081 | 199585 | 227015 |
This lists the average rate of inserts/s for the tests that do inserts concurrent with queries. For such tests the query rate is listed in the table above. The read+write tests are setup so that the insert rate should match the target rate every second. Cells that are not at least 95% of the target have a red background to indicate a failure to satisfy the target.
| dbms | q100.1 | q500.1 | q1000.1 |
|---|---|---|---|
| pg151_def.cx7_gcp_c2s60_4g | 1976 | 9885 | 19672 |
| pg151_o2_nofp.cx7_gcp_c2s60_4g | 1976 | 9885 | 19661 |
| pg151_o3.cx7_gcp_c2s60_4g | 1976 | 9885 | 19683 |
| pg151_o3_native.cx7_gcp_c2s60_4g | 1976 | 9885 | 19683 |
| pg151_o3_native_lto.cx7_gcp_c2s60_4g | 1976 | 9885 | 19683 |
| target | 2000 | 10000 | 20000 |
l.i0
l.i0: load without secondary indexes. Graphs for performance per 1-second interval are here.
Average throughput:
Insert response time histogram: each cell has the percentage of responses that take <= the time in the header and max is the max response time in seconds. For the max column values in the top 25% of the range have a red background and in the bottom 25% of the range have a green background. The red background is not used when the min value is within 80% of the max value.
| dbms | 256us | 1ms | 4ms | 16ms | 64ms | 256ms | 1s | 4s | 16s | gt | max |
|---|---|---|---|---|---|---|---|---|---|---|---|
| pg151_def.cx7_gcp_c2s60_4g | 22.383 | 74.756 | 2.795 | 0.020 | 0.031 | 0.015 | 0.787 | ||||
| pg151_o2_nofp.cx7_gcp_c2s60_4g | 17.133 | 79.973 | 2.829 | 0.021 | 0.029 | 0.016 | 0.647 | ||||
| pg151_o3.cx7_gcp_c2s60_4g | 23.392 | 73.802 | 2.742 | 0.020 | 0.026 | 0.017 | 0.001 | 1.184 | |||
| pg151_o3_native.cx7_gcp_c2s60_4g | 20.862 | 75.763 | 3.309 | 0.023 | 0.029 | 0.015 | 0.001 | 1.330 | |||
| pg151_o3_native_lto.cx7_gcp_c2s60_4g | 28.125 | 68.867 | 2.944 | 0.023 | 0.022 | 0.017 | 0.001 | 1.273 |
Performance metrics for the DBMS listed above. Some are normalized by throughput, others are not. Legend for results is here.
ips	qps	rps	rmbps	wps	wmbps	rpq	rkbpq	wpi	wkbpi	csps	cpups	cspq	cpupq	dbgb1	dbgb2	rss	maxop	p50	p99	tag
1095890	0	199	4.3	2213.0	459.7	0.000	0.004	0.002	0.430	288352	57.5	0.263	16	43.0	112.7	NA	0.787	61432	8495	400m.pg151_def.cx7_gcp_c2s60_4g
1072386	0	134	4.8	2155.8	462.4	0.000	0.005	0.002	0.442	291600	58.1	0.272	16	43.0	113.7	NA	0.647	60056	9590	400m.pg151_o2_nofp.cx7_gcp_c2s60_4g
1095890	0	210	4.3	2223.4	464.5	0.000	0.004	0.002	0.434	286651	57.2	0.262	16	43.0	112.6	NA	1.184	61233	10788	400m.pg151_o3.cx7_gcp_c2s60_4g
1061008	0	144	4.5	2134.0	453.5	0.000	0.004	0.002	0.438	342807	56.7	0.323	16	43.0	113.8	NA	1.330	59035	4195	400m.pg151_o3_native.cx7_gcp_c2s60_4g
1104972	0	204	4.8	2258.8	464.8	0.000	0.004	0.002	0.431	321474	56.8	0.291	15	43.0	112.6	NA	1.273	61932	5194	400m.pg151_o3_native_lto.cx7_gcp_c2s60_4g
l.x
l.x: create secondary indexes.
Average throughput:
Performance metrics for the DBMS listed above. Some are normalized by throughput, others are not. Legend for results is here.
ips	qps	rps	rmbps	wps	wmbps	rpq	rkbpq	wpi	wkbpi	csps	cpups	cspq	cpupq	dbgb1	dbgb2	rss	maxop	p50	p99	tag
295277	0	2419	41.1	496.7	111.7	0.008	0.143	0.002	0.387	1805	3.3	0.006	3	78.3	162.0	0.0	0.003	NA	NA	400m.pg151_def.cx7_gcp_c2s60_4g
292685	0	2696	40.7	459.3	105.3	0.009	0.142	0.002	0.369	1875	3.2	0.006	3	78.3	161.3	0.0	0.002	NA	NA	400m.pg151_o2_nofp.cx7_gcp_c2s60_4g
293759	0	3218	41.5	495.6	110.0	0.011	0.145	0.002	0.383	2050	3.2	0.007	3	78.3	162.1	0.0	0.002	NA	NA	400m.pg151_o3.cx7_gcp_c2s60_4g
303336	0	2898	43.1	475.4	108.3	0.010	0.146	0.002	0.366	1696	3.3	0.006	3	78.3	161.5	0.0	0.002	NA	NA	400m.pg151_o3_native.cx7_gcp_c2s60_4g
300150	0	3117	43.3	506.1	114.9	0.010	0.148	0.002	0.392	2039	3.3	0.007	3	78.3	162.3	0.0	0.002	NA	NA	400m.pg151_o3_native_lto.cx7_gcp_c2s60_4g
l.i1
l.i1: continue load after secondary indexes created. Graphs for performance per 1-second interval are here.
Average throughput:
Insert response time histogram: each cell has the percentage of responses that take <= the time in the header and max is the max response time in seconds. For the max column values in the top 25% of the range have a red background and in the bottom 25% of the range have a green background. The red background is not used when the min value is within 80% of the max value.
| dbms | 256us | 1ms | 4ms | 16ms | 64ms | 256ms | 1s | 4s | 16s | gt | max |
|---|---|---|---|---|---|---|---|---|---|---|---|
| pg151_def.cx7_gcp_c2s60_4g | 0.056 | 5.758 | 88.748 | 5.437 | 0.001 | 0.392 | |||||
| pg151_o2_nofp.cx7_gcp_c2s60_4g | 0.045 | 5.754 | 88.815 | 5.384 | 0.001 | 0.488 | |||||
| pg151_o3.cx7_gcp_c2s60_4g | 0.055 | 5.852 | 88.767 | 5.324 | 0.002 | 0.350 | |||||
| pg151_o3_native.cx7_gcp_c2s60_4g | 0.054 | 5.765 | 88.782 | 5.398 | 0.002 | 0.675 | |||||
| pg151_o3_native_lto.cx7_gcp_c2s60_4g | 0.058 | 5.720 | 88.869 | 5.352 | 0.002 | 0.646 |
Performance metrics for the DBMS listed above. Some are normalized by throughput, others are not. Legend for results is here.
ips	qps	rps	rmbps	wps	wmbps	rpq	rkbpq	wpi	wkbpi	csps	cpups	cspq	cpupq	dbgb1	dbgb2	rss	maxop	p50	p99	tag
33330	0	71703	662.4	60612.4	582.3	2.151	20.350	1.819	17.888	128606	12.8	3.858	115	170.2	252.8	0.0	0.392	1698	700	400m.pg151_def.cx7_gcp_c2s60_4g
33381	0	71154	661.5	60765.1	583.1	2.132	20.293	1.820	17.888	128530	12.9	3.850	116	170.2	252.5	0.0	0.488	1698	749	400m.pg151_o2_nofp.cx7_gcp_c2s60_4g
33506	0	70694	658.0	60945.3	585.0	2.110	20.111	1.819	17.879	128752	12.8	3.843	115	170.2	251.9	0.0	0.350	1698	749	400m.pg151_o3.cx7_gcp_c2s60_4g
33375	0	71874	663.5	60752.8	582.9	2.154	20.357	1.820	17.883	129071	12.6	3.867	113	170.2	251.7	0.0	0.675	1698	749	400m.pg151_o3_native.cx7_gcp_c2s60_4g
33470	0	71636	663.3	60894.0	584.4	2.140	20.295	1.819	17.879	129469	12.5	3.868	112	170.2	250.2	0.0	0.646	1698	749	400m.pg151_o3_native_lto.cx7_gcp_c2s60_4g
q100.1
q100.1: range queries with 100 insert/s per client. Graphs for performance per 1-second interval are here.
Average throughput:
Query response time histogram: each cell has the percentage of responses that take <= the time in the header and max is the max response time in seconds. For max values in the top 25% of the range have a red background and in the bottom 25% of the range have a green background. The red background is not used when the min value is within 80% of the max value.
| dbms | 256us | 1ms | 4ms | 16ms | 64ms | 256ms | 1s | 4s | 16s | gt | max |
|---|---|---|---|---|---|---|---|---|---|---|---|
| pg151_def.cx7_gcp_c2s60_4g | 99.905 | 0.091 | 0.002 | 0.001 | nonzero | nonzero | 0.154 | ||||
| pg151_o2_nofp.cx7_gcp_c2s60_4g | 99.903 | 0.094 | 0.002 | 0.001 | nonzero | nonzero | 0.154 | ||||
| pg151_o3.cx7_gcp_c2s60_4g | 99.901 | 0.096 | 0.002 | 0.001 | nonzero | 0.031 | |||||
| pg151_o3_native.cx7_gcp_c2s60_4g | 99.916 | 0.081 | 0.002 | 0.001 | nonzero | 0.028 | |||||
| pg151_o3_native_lto.cx7_gcp_c2s60_4g | 99.922 | 0.075 | 0.002 | 0.001 | nonzero | 0.027 |
Insert response time histogram: each cell has the percentage of responses that take <= the time in the header and max is the max response time in seconds. For max values in the top 25% of the range have a red background and in the bottom 25% of the range have a green background. The red background is not used when the min value is within 80% of the max value.
| dbms | 256us | 1ms | 4ms | 16ms | 64ms | 256ms | 1s | 4s | 16s | gt | max |
|---|---|---|---|---|---|---|---|---|---|---|---|
| pg151_def.cx7_gcp_c2s60_4g | 0.511 | 99.422 | 0.067 | 0.238 | |||||||
| pg151_o2_nofp.cx7_gcp_c2s60_4g | 0.739 | 99.147 | 0.101 | 0.013 | 0.572 | ||||||
| pg151_o3.cx7_gcp_c2s60_4g | 0.449 | 99.403 | 0.082 | 0.067 | 0.462 | ||||||
| pg151_o3_native.cx7_gcp_c2s60_4g | 0.644 | 99.354 | 0.001 | 0.065 | |||||||
| pg151_o3_native_lto.cx7_gcp_c2s60_4g | 0.504 | 99.431 | 0.065 | 0.184 |
Performance metrics for the DBMS listed above. Some are normalized by throughput, others are not. Legend for results is here.
ips	qps	rps	rmbps	wps	wmbps	rpq	rkbpq	wpi	wkbpi	csps	cpups	cspq	cpupq	dbgb1	dbgb2	rss	maxop	p50	p99	tag
1976	188713	3977	40.0	4127.1	51.4	0.021	0.217	2.089	26.623	674928	63.1	3.576	100	171.1	231.9	0.0	0.154	9413	8970	400m.pg151_def.cx7_gcp_c2s60_4g
1976	186198	3722	38.4	4125.7	52.3	0.020	0.211	2.088	27.088	667879	63.2	3.587	102	171.1	232.0	0.0	0.154	9317	8950	400m.pg151_o2_nofp.cx7_gcp_c2s60_4g
1976	188463	3823	38.8	4118.3	50.8	0.020	0.211	2.084	26.345	675213	63.1	3.583	100	171.1	232.6	0.0	0.031	9381	8966	400m.pg151_o3.cx7_gcp_c2s60_4g
1976	193324	3799	39.1	4121.2	50.9	0.020	0.207	2.086	26.372	691803	62.9	3.578	98	171.1	234.0	0.0	0.028	9653	9274	400m.pg151_o3_native.cx7_gcp_c2s60_4g
1976	197081	3925	39.2	4121.9	51.4	0.020	0.204	2.086	26.627	704162	62.6	3.573	95	171.1	232.4	0.0	0.027	9749	9338	400m.pg151_o3_native_lto.cx7_gcp_c2s60_4g
q500.1
q500.1: range queries with 500 insert/s per client. Graphs for performance per 1-second interval are here.
Average throughput:
Query response time histogram: each cell has the percentage of responses that take <= the time in the header and max is the max response time in seconds. For max values in the top 25% of the range have a red background and in the bottom 25% of the range have a green background. The red background is not used when the min value is within 80% of the max value.
| dbms | 256us | 1ms | 4ms | 16ms | 64ms | 256ms | 1s | 4s | 16s | gt | max |
|---|---|---|---|---|---|---|---|---|---|---|---|
| pg151_def.cx7_gcp_c2s60_4g | 99.639 | 0.349 | 0.012 | 0.001 | nonzero | 0.033 | |||||
| pg151_o2_nofp.cx7_gcp_c2s60_4g | 99.634 | 0.354 | 0.012 | 0.001 | nonzero | 0.028 | |||||
| pg151_o3.cx7_gcp_c2s60_4g | 99.643 | 0.344 | 0.012 | 0.001 | nonzero | nonzero | 0.113 | ||||
| pg151_o3_native.cx7_gcp_c2s60_4g | 99.670 | 0.318 | 0.011 | 0.001 | nonzero | 0.030 | |||||
| pg151_o3_native_lto.cx7_gcp_c2s60_4g | 99.685 | 0.304 | 0.011 | 0.001 | nonzero | 0.027 |
Insert response time histogram: each cell has the percentage of responses that take <= the time in the header and max is the max response time in seconds. For max values in the top 25% of the range have a red background and in the bottom 25% of the range have a green background. The red background is not used when the min value is within 80% of the max value.
| dbms | 256us | 1ms | 4ms | 16ms | 64ms | 256ms | 1s | 4s | 16s | gt | max |
|---|---|---|---|---|---|---|---|---|---|---|---|
| pg151_def.cx7_gcp_c2s60_4g | 0.605 | 99.355 | 0.040 | 0.139 | |||||||
| pg151_o2_nofp.cx7_gcp_c2s60_4g | 0.579 | 99.395 | 0.021 | 0.006 | 0.338 | ||||||
| pg151_o3.cx7_gcp_c2s60_4g | 0.620 | 99.355 | 0.021 | 0.004 | 0.311 | ||||||
| pg151_o3_native.cx7_gcp_c2s60_4g | 0.691 | 99.292 | 0.016 | 0.206 | |||||||
| pg151_o3_native_lto.cx7_gcp_c2s60_4g | 0.674 | 99.282 | 0.044 | 0.188 |
Performance metrics for the DBMS listed above. Some are normalized by throughput, others are not. Legend for results is here.
ips	qps	rps	rmbps	wps	wmbps	rpq	rkbpq	wpi	wkbpi	csps	cpups	cspq	cpupq	dbgb1	dbgb2	rss	maxop	p50	p99	tag
9885	189832	17859	184.6	19527.7	208.3	0.094	0.996	1.976	21.576	659101	65.5	3.472	104	176.0	231.9	0.0	0.033	9445	8822	400m.pg151_def.cx7_gcp_c2s60_4g
9885	188907	17814	184.3	19528.1	208.2	0.094	0.999	1.976	21.566	655135	65.8	3.468	104	176.0	231.9	0.0	0.028	9413	8822	400m.pg151_o2_nofp.cx7_gcp_c2s60_4g
9885	191652	17751	184.3	19517.2	207.8	0.093	0.985	1.975	21.532	664434	65.7	3.467	103	176.0	229.4	0.0	0.113	9557	8934	400m.pg151_o3.cx7_gcp_c2s60_4g
9885	195197	17718	184.0	19518.5	207.4	0.091	0.965	1.975	21.483	677522	65.3	3.471	100	176.0	230.3	0.0	0.030	9716	9114	400m.pg151_o3_native.cx7_gcp_c2s60_4g
9885	199585	17868	184.6	19525.1	208.3	0.090	0.947	1.975	21.574	691791	65.4	3.466	98	176.0	229.6	0.0	0.027	9861	9206	400m.pg151_o3_native_lto.cx7_gcp_c2s60_4g
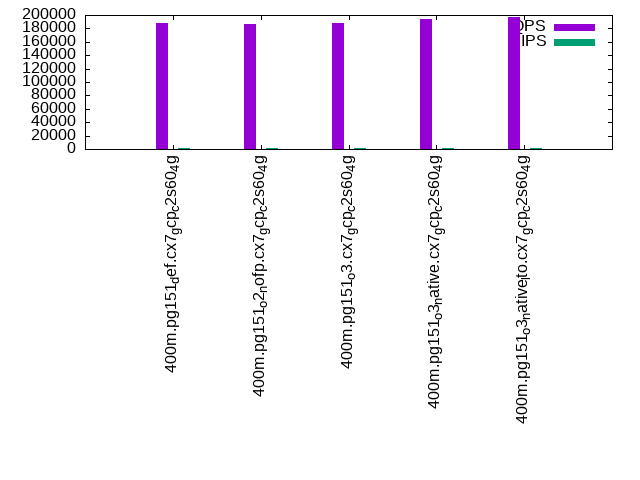
q1000.1
q1000.1: range queries with 1000 insert/s per client. Graphs for performance per 1-second interval are here.
Average throughput:
Query response time histogram: each cell has the percentage of responses that take <= the time in the header and max is the max response time in seconds. For max values in the top 25% of the range have a red background and in the bottom 25% of the range have a green background. The red background is not used when the min value is within 80% of the max value.
| dbms | 256us | 1ms | 4ms | 16ms | 64ms | 256ms | 1s | 4s | 16s | gt | max |
|---|---|---|---|---|---|---|---|---|---|---|---|
| pg151_def.cx7_gcp_c2s60_4g | 99.429 | 0.549 | 0.020 | 0.001 | nonzero | 0.061 | |||||
| pg151_o2_nofp.cx7_gcp_c2s60_4g | 99.438 | 0.540 | 0.020 | 0.001 | nonzero | 0.030 | |||||
| pg151_o3.cx7_gcp_c2s60_4g | 99.430 | 0.549 | 0.019 | 0.001 | nonzero | 0.049 | |||||
| pg151_o3_native.cx7_gcp_c2s60_4g | 99.478 | 0.502 | 0.019 | 0.001 | nonzero | nonzero | 0.064 | ||||
| pg151_o3_native_lto.cx7_gcp_c2s60_4g | 99.481 | 0.499 | 0.018 | 0.001 | nonzero | 0.053 |
Insert response time histogram: each cell has the percentage of responses that take <= the time in the header and max is the max response time in seconds. For max values in the top 25% of the range have a red background and in the bottom 25% of the range have a green background. The red background is not used when the min value is within 80% of the max value.
| dbms | 256us | 1ms | 4ms | 16ms | 64ms | 256ms | 1s | 4s | 16s | gt | max |
|---|---|---|---|---|---|---|---|---|---|---|---|
| pg151_def.cx7_gcp_c2s60_4g | 1.467 | 93.398 | 5.134 | nonzero | 0.409 | ||||||
| pg151_o2_nofp.cx7_gcp_c2s60_4g | 1.494 | 93.189 | 5.314 | 0.003 | 0.590 | ||||||
| pg151_o3.cx7_gcp_c2s60_4g | 1.555 | 93.223 | 5.222 | 0.242 | |||||||
| pg151_o3_native.cx7_gcp_c2s60_4g | 1.844 | 93.161 | 4.991 | 0.004 | 0.642 | ||||||
| pg151_o3_native_lto.cx7_gcp_c2s60_4g | 2.221 | 92.786 | 4.992 | 0.001 | 0.277 |
Performance metrics for the DBMS listed above. Some are normalized by throughput, others are not. Legend for results is here.
ips	qps	rps	rmbps	wps	wmbps	rpq	rkbpq	wpi	wkbpi	csps	cpups	cspq	cpupq	dbgb1	dbgb2	rss	maxop	p50	p99	tag
19672	215898	38044	385.2	37178.2	391.1	0.176	1.827	1.890	20.356	673262	69.7	3.118	97	189.4	261.2	0.0	0.061	10596	7996	400m.pg151_def.cx7_gcp_c2s60_4g
19661	216473	38310	387.1	37238.6	392.0	0.177	1.831	1.894	20.414	670293	69.9	3.096	97	189.4	261.2	0.0	0.030	10724	8204	400m.pg151_o2_nofp.cx7_gcp_c2s60_4g
19683	217319	39157	390.6	37279.2	392.4	0.180	1.841	1.894	20.412	677236	69.7	3.116	96	189.4	261.2	0.0	0.049	10692	8183	400m.pg151_o3.cx7_gcp_c2s60_4g
19683	223810	37754	383.7	37244.1	393.2	0.169	1.755	1.892	20.454	695022	69.8	3.105	94	189.4	261.2	0.0	0.064	11155	8311	400m.pg151_o3_native.cx7_gcp_c2s60_4g
19683	227015	37484	381.1	37350.3	391.6	0.165	1.719	1.898	20.371	707777	69.6	3.118	92	189.4	261.2	0.0	0.053	11305	8438	400m.pg151_o3_native_lto.cx7_gcp_c2s60_4g
l.i0
l.i0: load without secondary indexes
Performance metrics for all DBMS, not just the ones listed above. Some are normalized by throughput, others are not. Legend for results is here.
ips	qps	rps	rmbps	wps	wmbps	rpq	rkbpq	wpi	wkbpi	csps	cpups	cspq	cpupq	dbgb1	dbgb2	rss	maxop	p50	p99	tag
1095890	0	199	4.3	2213.0	459.7	0.000	0.004	0.002	0.430	288352	57.5	0.263	16	43.0	112.7	NA	0.787	61432	8495	400m.pg151_def.cx7_gcp_c2s60_4g
1072386	0	134	4.8	2155.8	462.4	0.000	0.005	0.002	0.442	291600	58.1	0.272	16	43.0	113.7	NA	0.647	60056	9590	400m.pg151_o2_nofp.cx7_gcp_c2s60_4g
1095890	0	210	4.3	2223.4	464.5	0.000	0.004	0.002	0.434	286651	57.2	0.262	16	43.0	112.6	NA	1.184	61233	10788	400m.pg151_o3.cx7_gcp_c2s60_4g
1061008	0	144	4.5	2134.0	453.5	0.000	0.004	0.002	0.438	342807	56.7	0.323	16	43.0	113.8	NA	1.330	59035	4195	400m.pg151_o3_native.cx7_gcp_c2s60_4g
1104972	0	204	4.8	2258.8	464.8	0.000	0.004	0.002	0.431	321474	56.8	0.291	15	43.0	112.6	NA	1.273	61932	5194	400m.pg151_o3_native_lto.cx7_gcp_c2s60_4g
l.x
l.x: create secondary indexes
Performance metrics for all DBMS, not just the ones listed above. Some are normalized by throughput, others are not. Legend for results is here.
ips	qps	rps	rmbps	wps	wmbps	rpq	rkbpq	wpi	wkbpi	csps	cpups	cspq	cpupq	dbgb1	dbgb2	rss	maxop	p50	p99	tag
295277	0	2419	41.1	496.7	111.7	0.008	0.143	0.002	0.387	1805	3.3	0.006	3	78.3	162.0	0.0	0.003	NA	NA	400m.pg151_def.cx7_gcp_c2s60_4g
292685	0	2696	40.7	459.3	105.3	0.009	0.142	0.002	0.369	1875	3.2	0.006	3	78.3	161.3	0.0	0.002	NA	NA	400m.pg151_o2_nofp.cx7_gcp_c2s60_4g
293759	0	3218	41.5	495.6	110.0	0.011	0.145	0.002	0.383	2050	3.2	0.007	3	78.3	162.1	0.0	0.002	NA	NA	400m.pg151_o3.cx7_gcp_c2s60_4g
303336	0	2898	43.1	475.4	108.3	0.010	0.146	0.002	0.366	1696	3.3	0.006	3	78.3	161.5	0.0	0.002	NA	NA	400m.pg151_o3_native.cx7_gcp_c2s60_4g
300150	0	3117	43.3	506.1	114.9	0.010	0.148	0.002	0.392	2039	3.3	0.007	3	78.3	162.3	0.0	0.002	NA	NA	400m.pg151_o3_native_lto.cx7_gcp_c2s60_4g
l.i1
l.i1: continue load after secondary indexes created
Performance metrics for all DBMS, not just the ones listed above. Some are normalized by throughput, others are not. Legend for results is here.
ips	qps	rps	rmbps	wps	wmbps	rpq	rkbpq	wpi	wkbpi	csps	cpups	cspq	cpupq	dbgb1	dbgb2	rss	maxop	p50	p99	tag
33330	0	71703	662.4	60612.4	582.3	2.151	20.350	1.819	17.888	128606	12.8	3.858	115	170.2	252.8	0.0	0.392	1698	700	400m.pg151_def.cx7_gcp_c2s60_4g
33381	0	71154	661.5	60765.1	583.1	2.132	20.293	1.820	17.888	128530	12.9	3.850	116	170.2	252.5	0.0	0.488	1698	749	400m.pg151_o2_nofp.cx7_gcp_c2s60_4g
33506	0	70694	658.0	60945.3	585.0	2.110	20.111	1.819	17.879	128752	12.8	3.843	115	170.2	251.9	0.0	0.350	1698	749	400m.pg151_o3.cx7_gcp_c2s60_4g
33375	0	71874	663.5	60752.8	582.9	2.154	20.357	1.820	17.883	129071	12.6	3.867	113	170.2	251.7	0.0	0.675	1698	749	400m.pg151_o3_native.cx7_gcp_c2s60_4g
33470	0	71636	663.3	60894.0	584.4	2.140	20.295	1.819	17.879	129469	12.5	3.868	112	170.2	250.2	0.0	0.646	1698	749	400m.pg151_o3_native_lto.cx7_gcp_c2s60_4g
q100.1
q100.1: range queries with 100 insert/s per client
Performance metrics for all DBMS, not just the ones listed above. Some are normalized by throughput, others are not. Legend for results is here.
ips	qps	rps	rmbps	wps	wmbps	rpq	rkbpq	wpi	wkbpi	csps	cpups	cspq	cpupq	dbgb1	dbgb2	rss	maxop	p50	p99	tag
1976	188713	3977	40.0	4127.1	51.4	0.021	0.217	2.089	26.623	674928	63.1	3.576	100	171.1	231.9	0.0	0.154	9413	8970	400m.pg151_def.cx7_gcp_c2s60_4g
1976	186198	3722	38.4	4125.7	52.3	0.020	0.211	2.088	27.088	667879	63.2	3.587	102	171.1	232.0	0.0	0.154	9317	8950	400m.pg151_o2_nofp.cx7_gcp_c2s60_4g
1976	188463	3823	38.8	4118.3	50.8	0.020	0.211	2.084	26.345	675213	63.1	3.583	100	171.1	232.6	0.0	0.031	9381	8966	400m.pg151_o3.cx7_gcp_c2s60_4g
1976	193324	3799	39.1	4121.2	50.9	0.020	0.207	2.086	26.372	691803	62.9	3.578	98	171.1	234.0	0.0	0.028	9653	9274	400m.pg151_o3_native.cx7_gcp_c2s60_4g
1976	197081	3925	39.2	4121.9	51.4	0.020	0.204	2.086	26.627	704162	62.6	3.573	95	171.1	232.4	0.0	0.027	9749	9338	400m.pg151_o3_native_lto.cx7_gcp_c2s60_4g
q500.1
q500.1: range queries with 500 insert/s per client
Performance metrics for all DBMS, not just the ones listed above. Some are normalized by throughput, others are not. Legend for results is here.
ips	qps	rps	rmbps	wps	wmbps	rpq	rkbpq	wpi	wkbpi	csps	cpups	cspq	cpupq	dbgb1	dbgb2	rss	maxop	p50	p99	tag
9885	189832	17859	184.6	19527.7	208.3	0.094	0.996	1.976	21.576	659101	65.5	3.472	104	176.0	231.9	0.0	0.033	9445	8822	400m.pg151_def.cx7_gcp_c2s60_4g
9885	188907	17814	184.3	19528.1	208.2	0.094	0.999	1.976	21.566	655135	65.8	3.468	104	176.0	231.9	0.0	0.028	9413	8822	400m.pg151_o2_nofp.cx7_gcp_c2s60_4g
9885	191652	17751	184.3	19517.2	207.8	0.093	0.985	1.975	21.532	664434	65.7	3.467	103	176.0	229.4	0.0	0.113	9557	8934	400m.pg151_o3.cx7_gcp_c2s60_4g
9885	195197	17718	184.0	19518.5	207.4	0.091	0.965	1.975	21.483	677522	65.3	3.471	100	176.0	230.3	0.0	0.030	9716	9114	400m.pg151_o3_native.cx7_gcp_c2s60_4g
9885	199585	17868	184.6	19525.1	208.3	0.090	0.947	1.975	21.574	691791	65.4	3.466	98	176.0	229.6	0.0	0.027	9861	9206	400m.pg151_o3_native_lto.cx7_gcp_c2s60_4g
q1000.1
q1000.1: range queries with 1000 insert/s per client
Performance metrics for all DBMS, not just the ones listed above. Some are normalized by throughput, others are not. Legend for results is here.
ips	qps	rps	rmbps	wps	wmbps	rpq	rkbpq	wpi	wkbpi	csps	cpups	cspq	cpupq	dbgb1	dbgb2	rss	maxop	p50	p99	tag
19672	215898	38044	385.2	37178.2	391.1	0.176	1.827	1.890	20.356	673262	69.7	3.118	97	189.4	261.2	0.0	0.061	10596	7996	400m.pg151_def.cx7_gcp_c2s60_4g
19661	216473	38310	387.1	37238.6	392.0	0.177	1.831	1.894	20.414	670293	69.9	3.096	97	189.4	261.2	0.0	0.030	10724	8204	400m.pg151_o2_nofp.cx7_gcp_c2s60_4g
19683	217319	39157	390.6	37279.2	392.4	0.180	1.841	1.894	20.412	677236	69.7	3.116	96	189.4	261.2	0.0	0.049	10692	8183	400m.pg151_o3.cx7_gcp_c2s60_4g
19683	223810	37754	383.7	37244.1	393.2	0.169	1.755	1.892	20.454	695022	69.8	3.105	94	189.4	261.2	0.0	0.064	11155	8311	400m.pg151_o3_native.cx7_gcp_c2s60_4g
19683	227015	37484	381.1	37350.3	391.6	0.165	1.719	1.898	20.371	707777	69.6	3.118	92	189.4	261.2	0.0	0.053	11305	8438	400m.pg151_o3_native_lto.cx7_gcp_c2s60_4g
l.i0
- l.i0: load without secondary indexes
- Legend for results is here.
- Each entry lists the percentage of responses that fit in that bucket (slower than max time for previous bucket, faster than min time for next bucket).
Insert response time histogram
256us	1ms	4ms	16ms	64ms	256ms	1s	4s	16s	gt	max	tag
0.000	22.383	74.756	2.795	0.020	0.031	0.015	0.000	0.000	0.000	0.787	pg151_def.cx7_gcp_c2s60_4g
0.000	17.133	79.973	2.829	0.021	0.029	0.016	0.000	0.000	0.000	0.647	pg151_o2_nofp.cx7_gcp_c2s60_4g
0.000	23.392	73.802	2.742	0.020	0.026	0.017	0.001	0.000	0.000	1.184	pg151_o3.cx7_gcp_c2s60_4g
0.000	20.862	75.763	3.309	0.023	0.029	0.015	0.001	0.000	0.000	1.330	pg151_o3_native.cx7_gcp_c2s60_4g
0.000	28.125	68.867	2.944	0.023	0.022	0.017	0.001	0.000	0.000	1.273	pg151_o3_native_lto.cx7_gcp_c2s60_4g
l.x
- l.x: create secondary indexes
- Legend for results is here.
- Each entry lists the percentage of responses that fit in that bucket (slower than max time for previous bucket, faster than min time for next bucket).
TODO - determine whether there is data for create index response time
l.i1
- l.i1: continue load after secondary indexes created
- Legend for results is here.
- Each entry lists the percentage of responses that fit in that bucket (slower than max time for previous bucket, faster than min time for next bucket).
Insert response time histogram
256us	1ms	4ms	16ms	64ms	256ms	1s	4s	16s	gt	max	tag
0.000	0.000	0.056	5.758	88.748	5.437	0.001	0.000	0.000	0.000	0.392	pg151_def.cx7_gcp_c2s60_4g
0.000	0.000	0.045	5.754	88.815	5.384	0.001	0.000	0.000	0.000	0.488	pg151_o2_nofp.cx7_gcp_c2s60_4g
0.000	0.000	0.055	5.852	88.767	5.324	0.002	0.000	0.000	0.000	0.350	pg151_o3.cx7_gcp_c2s60_4g
0.000	0.000	0.054	5.765	88.782	5.398	0.002	0.000	0.000	0.000	0.675	pg151_o3_native.cx7_gcp_c2s60_4g
0.000	0.000	0.058	5.720	88.869	5.352	0.002	0.000	0.000	0.000	0.646	pg151_o3_native_lto.cx7_gcp_c2s60_4g
q100.1
- q100.1: range queries with 100 insert/s per client
- Legend for results is here.
- Each entry lists the percentage of responses that fit in that bucket (slower than max time for previous bucket, faster than min time for next bucket).
Query response time histogram
256us	1ms	4ms	16ms	64ms	256ms	1s	4s	16s	gt	max	tag
99.905	0.091	0.002	0.001	nonzero	nonzero	0.000	0.000	0.000	0.000	0.154	pg151_def.cx7_gcp_c2s60_4g
99.903	0.094	0.002	0.001	nonzero	nonzero	0.000	0.000	0.000	0.000	0.154	pg151_o2_nofp.cx7_gcp_c2s60_4g
99.901	0.096	0.002	0.001	nonzero	0.000	0.000	0.000	0.000	0.000	0.031	pg151_o3.cx7_gcp_c2s60_4g
99.916	0.081	0.002	0.001	nonzero	0.000	0.000	0.000	0.000	0.000	0.028	pg151_o3_native.cx7_gcp_c2s60_4g
99.922	0.075	0.002	0.001	nonzero	0.000	0.000	0.000	0.000	0.000	0.027	pg151_o3_native_lto.cx7_gcp_c2s60_4g
Insert response time histogram
256us	1ms	4ms	16ms	64ms	256ms	1s	4s	16s	gt	max	tag
0.000	0.000	0.000	0.511	99.422	0.067	0.000	0.000	0.000	0.000	0.238	pg151_def.cx7_gcp_c2s60_4g
0.000	0.000	0.000	0.739	99.147	0.101	0.013	0.000	0.000	0.000	0.572	pg151_o2_nofp.cx7_gcp_c2s60_4g
0.000	0.000	0.000	0.449	99.403	0.082	0.067	0.000	0.000	0.000	0.462	pg151_o3.cx7_gcp_c2s60_4g
0.000	0.000	0.000	0.644	99.354	0.001	0.000	0.000	0.000	0.000	0.065	pg151_o3_native.cx7_gcp_c2s60_4g
0.000	0.000	0.000	0.504	99.431	0.065	0.000	0.000	0.000	0.000	0.184	pg151_o3_native_lto.cx7_gcp_c2s60_4g
q500.1
- q500.1: range queries with 500 insert/s per client
- Legend for results is here.
- Each entry lists the percentage of responses that fit in that bucket (slower than max time for previous bucket, faster than min time for next bucket).
Query response time histogram
256us	1ms	4ms	16ms	64ms	256ms	1s	4s	16s	gt	max	tag
99.639	0.349	0.012	0.001	nonzero	0.000	0.000	0.000	0.000	0.000	0.033	pg151_def.cx7_gcp_c2s60_4g
99.634	0.354	0.012	0.001	nonzero	0.000	0.000	0.000	0.000	0.000	0.028	pg151_o2_nofp.cx7_gcp_c2s60_4g
99.643	0.344	0.012	0.001	nonzero	nonzero	0.000	0.000	0.000	0.000	0.113	pg151_o3.cx7_gcp_c2s60_4g
99.670	0.318	0.011	0.001	nonzero	0.000	0.000	0.000	0.000	0.000	0.030	pg151_o3_native.cx7_gcp_c2s60_4g
99.685	0.304	0.011	0.001	nonzero	0.000	0.000	0.000	0.000	0.000	0.027	pg151_o3_native_lto.cx7_gcp_c2s60_4g
Insert response time histogram
256us	1ms	4ms	16ms	64ms	256ms	1s	4s	16s	gt	max	tag
0.000	0.000	0.000	0.605	99.355	0.040	0.000	0.000	0.000	0.000	0.139	pg151_def.cx7_gcp_c2s60_4g
0.000	0.000	0.000	0.579	99.395	0.021	0.006	0.000	0.000	0.000	0.338	pg151_o2_nofp.cx7_gcp_c2s60_4g
0.000	0.000	0.000	0.620	99.355	0.021	0.004	0.000	0.000	0.000	0.311	pg151_o3.cx7_gcp_c2s60_4g
0.000	0.000	0.000	0.691	99.292	0.016	0.000	0.000	0.000	0.000	0.206	pg151_o3_native.cx7_gcp_c2s60_4g
0.000	0.000	0.000	0.674	99.282	0.044	0.000	0.000	0.000	0.000	0.188	pg151_o3_native_lto.cx7_gcp_c2s60_4g
q1000.1
- q1000.1: range queries with 1000 insert/s per client
- Legend for results is here.
- Each entry lists the percentage of responses that fit in that bucket (slower than max time for previous bucket, faster than min time for next bucket).
Query response time histogram
256us	1ms	4ms	16ms	64ms	256ms	1s	4s	16s	gt	max	tag
99.429	0.549	0.020	0.001	nonzero	0.000	0.000	0.000	0.000	0.000	0.061	pg151_def.cx7_gcp_c2s60_4g
99.438	0.540	0.020	0.001	nonzero	0.000	0.000	0.000	0.000	0.000	0.030	pg151_o2_nofp.cx7_gcp_c2s60_4g
99.430	0.549	0.019	0.001	nonzero	0.000	0.000	0.000	0.000	0.000	0.049	pg151_o3.cx7_gcp_c2s60_4g
99.478	0.502	0.019	0.001	nonzero	nonzero	0.000	0.000	0.000	0.000	0.064	pg151_o3_native.cx7_gcp_c2s60_4g
99.481	0.499	0.018	0.001	nonzero	0.000	0.000	0.000	0.000	0.000	0.053	pg151_o3_native_lto.cx7_gcp_c2s60_4g
Insert response time histogram
256us	1ms	4ms	16ms	64ms	256ms	1s	4s	16s	gt	max	tag
0.000	0.000	0.000	1.467	93.398	5.134	nonzero	0.000	0.000	0.000	0.409	pg151_def.cx7_gcp_c2s60_4g
0.000	0.000	0.000	1.494	93.189	5.314	0.003	0.000	0.000	0.000	0.590	pg151_o2_nofp.cx7_gcp_c2s60_4g
0.000	0.000	0.000	1.555	93.223	5.222	0.000	0.000	0.000	0.000	0.242	pg151_o3.cx7_gcp_c2s60_4g
0.000	0.000	0.000	1.844	93.161	4.991	0.004	0.000	0.000	0.000	0.642	pg151_o3_native.cx7_gcp_c2s60_4g
0.000	0.000	0.000	2.221	92.786	4.992	0.001	0.000	0.000	0.000	0.277	pg151_o3_native_lto.cx7_gcp_c2s60_4g